Ammonium Salt Deposition Characteristics in an Air Cooler System Based on the Coupling of Fluid Flow and Heat Transfer Simulation
2020-01-13JinHaozheZhouJunfengLiuWenwenLiuXiaofeiOuGuofu
Jin Haozhe; Zhou Junfeng; Liu Wenwen; Liu Xiaofei; Ou Guofu
(1. The Institute of Flow-Induced Corrosion, Zhejiang Sci-Tech Uniνersity, Hangzhou 310018; 2. The Insititute of Flow-Induced Corrosion and Intelligent Precaution and Control, Changzhou Uniνersity, Changzhou 213016)
Abstract: The ammonium salt corrosion is a typical failure mode for the hydrogenation reaction effluent air cooler (REAC) system. In order to investigate the corrosion characteristics in the REAC system, numerical simulations were performed by using the mixture model, the heating transfer model, and the particles tracking model. The results show that the differences between the temperature and the velocity at each cross section of the first-row and second-row tubes are small. The inertia of the particles plays an important role in the particle’s deposition, and the smaller particles distribute more uniformly in the air cooler. However, for larger particles, they prefer falling from the inner side of the vertical elbow, and preferentially depositing at the inlet header and pipes before saturation. In the heat exchanger tubes, the particle deposition number is larger in the second-row tubes than that in the first-row tubes, and the high-risk tubes mainly concentrate on the middle and right side of the air cooler. The kinetic parameters of the particles are in accordance with the blocking-prone position in many real operating conditions.Key words: hydrogenation air cooler; multiphase flow; ammonium salt corrosion; particles drifting
1 Introduction
In the chemical process industry, multiphase flow system[1-3]used for transporting oil and natural gas, often contains solid particles, which will move along with the fluid under the effect of drag force[4-6]. In the hydrogenation reactor effluent air cooler system, the material properties of the multicomponent fluid such as oil, gas, and water are highly nonlinear, and the temperature has a great influence on the viscous thermal effect of fluid[7-9]. Owing to the coupling of fluid flow and heat transfer, ammonium salt crystallization particles are generated in the process of separation and cooling, and some serious consequences such as underdeposit corrosion, erosion corrosion and impact wear can occur due to the drifting and deposition of salt particles on the wall surface. The failure location and corrosion mechanism are very complicated[10-11], which has not been thoroughly investigated yet. Therefore, to study the drifting and deposition characteristics of the crystallized phase by multicomponent fluid and establish a reliable quantitative forecasting and evaluation method are very important to improve the safety and stability of the relevant equipment in the petrochemical industry.
Many researches have been done on the crystallization curve and particle erosion of equipment caused by ammonium salt, and a few progresses have been made in the study of particles motion under the coupling action between the fluid flow and heat transfer. Paulo, et al.[12-13]studied the crystallization behavior of ammonium chloride and analyzed the crystal deposition problem in the heat exchanger tubes. By analyzing the failure bundle, the failure prevention and control methods, such as reducing the content of the chlorine ions in the raw materials, upgrading the material of the tubes and adding injection points of water, were proposed. In the theory and experiment of Kane R. D., et al.[14], they use the H2S as an important indicator to assess the corrosion of equipment induced by the corrosive medium. Rani, et al.[15]studied the characteristics of fully developed two-phase flow in a pipe and analyzed the influence of various particles parameters on the fluid flow behavior. Supersonic gas-solid two-phase flow over a blunt body was studied by Volkov, et al.[16], who analyzed the effects of three factors on the fluid flow characteristics including the two-way coupling, the inter-particle collisions and the collisions between the particle and the blunt body surface. Zhang, et al.[17]studied particles deposition behavior in a horizontal turbulent duct flow based on the RANS method to build the turbulent pipe flow calculation model of particles deposition. They have predicted the dimensionless deposition rate of particles with a diameter ranging from 10 μm to 200 μm. Mark, et al.[18]carried out a series of experiments to study the particles drifting deposition characteristics in a ventilation duct. Even though a lot of work have been done to study the behaviors of the particle in pipes, the drifting and deposition characteristic in the air cooler is rarely investigated.
Jin, et al.[19-20]studied the crystalline equilibrium curve of ammonium salt and the drifting characteristics of corrosion products in the air cooler, and their results showed that the drifting characteristics were closely related to the multiphase flow and the heat transfer process. However, the effect of the coupling between the flow field and the temperature field on particles drifting motion was still lacking. Therefore, based on the previous studies, a new numerical simulation model of ammonium salt drifting motion was established by using the coupling method of the fluid dynamics and heat transfer to evaluate the drifting motion of the ammonium salt particles.
2 Mathematical Model and Numerical Method
2.1 Hydrogenation process flows and model of the computation domain
The typical process of the hydrogenation REAC system in a refining company is shown in Figure 1. The heating of the raw material oil and its reaction over the catalyst in the hydrogenation reactor generates the reaction effluent, which after being discharged from the bottom of the reactor flows through the heat exchanger and the air cooler. Thereafter, the effluent is separated into circulating hydrogen, oil, and sour water by the high-pressure separator. In this case, the recycle hydrogen returns to the reactor to be reused in the loop, and the oil from the highpressure separator enters the low-pressure separator to be separated into three phases. Reaction effluent is a typical multiphase flow system. Under the effect of the twoway coupling of the flow field and temperature field, the crystal particles of ammonium chloride will be generated in the air cooler, and after having accumulated to a certain amount can block and corrode the tube bundles.
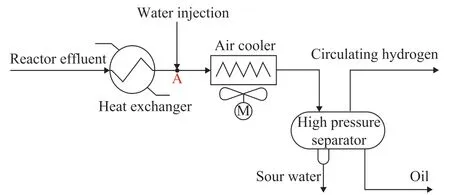
Figure 1 Process flow diagram of the hydrogenation REAC system
Many practical cases have shown that the blockage of the air cooler by ammonium salt often occurs in the first two rows of tubes, and this ammonium salt usually deposits in the front half of the tubes. Therefore, 1.5 meters of the tube bundle in the first two rows of the air cooler are selected, with the geometry model shown in Figure 2. The diameter of the inlet pipe is 230 mm, and the size of tube header is 2 906 mm×100 mm×110 mm, which is provided with two rows of tubes. The first-row has 47 tubes and the secondrow has 46 tubes. The height in vertical direction of adjacent bundles is 58 mm and the lateral distance is 62 mm. The tube specification is Φ26 mm×3 mm. The fan was installed under the air cooler to cool the multiphase flow medium in the heat transfer tube.
2.2 Governing equations
2.2.1 Fluid flow and heat transfer equations
The medium in the hydrogenation reaction effluent system includes gas, water, ammonium salt particles and other hydrocarbons, and the multiphase flow can be described using the mixture model. The continuity equation and the momentum equation are expressed below:
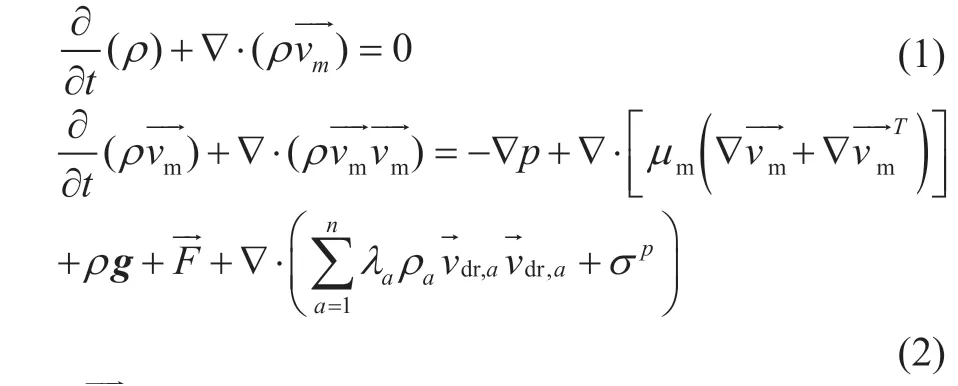
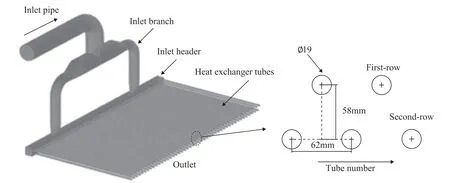
Figure 2 Geometry model of the computation domain
phase (kg/m3); t is the time (s); μmis the mixed viscosity (Pa·s); p is the pressure (Pa); n is the number of phase; g is the acceleration of gravity (m/s2);is the body force (N/kg); λαis the mass fraction of phase α; ραis the density of phase α (kg/m3); andis the drift velocity of phase α (m/s).
The equations of volume fraction of phase α can be written as:

where φαis the volume fraction of phase α, and the momentum equation can be solved using the standard k - ε turbulent model which is shown as follows:
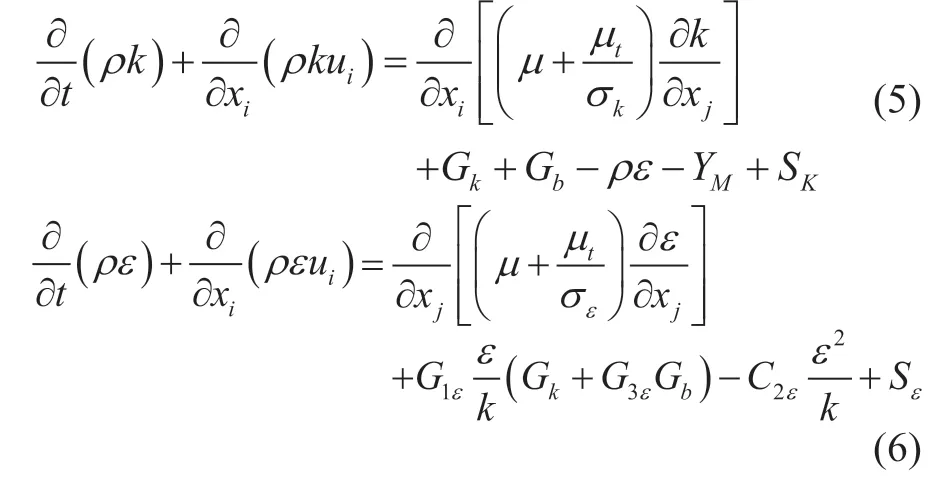
Turbulent viscosity μtcan be expressed as a function of turbulent kinetic energy k and turbulent dissipationThe model constants in the equation are: C2ε=1.92, C1ε=1.44, Cμ=0.99, σε=1.3, and σk=1.0.
The heat transfer in fluid can be solved with the following equation:

The different quantities involved here are recalled below: C is the specific heat capacity at constant pressure p (J/(kg· K)); T is the absolute temperature (K); u is the velocity vector (m/s); q is the heat flux by conduction (W/m2); α is the coefficient of thermal expansion (1/K);τ is the viscous stress tensor (Pa); Q contains heat sources other than viscous dissipation (W/m3). The Kays-Crawford[21]model is used to consider the added dispersion of heat transfer.
2.2.2 Particle motion equation
The motion of ammonium salt particles can be described as follow:

where mpis the mass of the particle (kg); ρpis the density of the particle (kg/m3); vpis the vector velocity of the particle (m/s); Apis the windward area of the particle (m2); g is the acceleration of gravity (m/s2); CDis the resistance coefficient of the particle motion[22]; Ftpis thermophoretic force (N); CDin fluid of the continuous phase is directly related to the Reynolds number.
2.3 Boundary conditions
2.3.1 Boundary conditions for the multiphase flow
By simulating the process of the air cooler with Aspen Plus software, the physical parameters of the multiphase flow at the inlet of the air cooler were obtained as shown in Table 1. The velocity at the inlet tube bundle was set to be 3.5 m/s, and the outlet condition was set as the pressure outlet. The wall of the entire computational domain was treated as no-slip boundary, and the near wall mesh was processed using the standard wall function. The inlet temperature of multiphase flow was 160 °C. The heat transfer coefficient of the tubes was 0.8 W/(m2∙K), and the rest wall was considered as an adiabatic wall. In the calculations, 10 000 particles were released uniformly at the entrance. Upon considering the size of NH4Cl crystal, in the present work six particles sizes (dp=25, 50, 75, 100, 125, and 150 μm) were selected to study the particle motions. The grid independence was verified by comparing the outlet fluid velocity of three different grid settings (1.2 million, 1.8 million, and 2.4 million). The result shows that the values of three settings were 4.99 m/s,4.97 m/s, and 4.97 m/s, and the difference between the average velocity was insignificant, when the grid number was larger than 1.8 million. Thus, a grid number of 1.8 million was selected for the present study.

Table 1 Physical characteristics of inlet boundary
2.3.2 Boundary conditions for the discrete phase
The drag, gravity and thermophoretic forces were considered in the present studies. The gravitational acceleration was set as 9.81 m/s2. The thermophoretic force was determined according to the particle’s properties and fluid properties. After colliding with wall, most of particles rebound following the law of momentum conservation, and a small amount of particles would stick to the wall under the actual operating condition. In the present simulation, the assumed stuck proportion is 5%.
3 Results and Discussion
3.1 Distribution of flow field in air cooler
The velocity contour of fluid in air cooler at an inlet velocity Vinlet=3.5 m/s is presented in Figure 3(a), and Figure 3(b) is the rear elevation of velocity contour. The computational model has no symmetry structure at the inlet pipe, so that there is a large difference in the velocity between fields 1 and 2 as labeled in the dotted lines in Figure 3(b). The fluid flows through the vertical tube bundle, and the average inner velocity can reach up to 5.34 m/s and 5.39 m/s, respectively. The difference of velocity is less than 0.2%, and the velocity contours in the head-bonnet seem to be symmetrical.

Figure 3 Velocity contours of air cooler at Vinlet = 3.5 m/s: (a) Global contours; (b) Rear elevation
Velocity contours of the different transversal sections in the head-bonnet are shown in Figure 4, and the black line is the projection section of the vertical tube bundle. The flow field information of the cross section of the first-row center is shown in Figure 4(a)—(b), and that of the second-row is shown in Figure 4(c)—(d). The flow velocity ranges from 3 m/s to 6 m/s in the first-row tubes, and ranges from 1 m/s to 8 m/s in the second-row tubes. This fact means that both of the maximum and minimum velocity regions exist at the bottom of the head-bonnet, which will lead to a higher momentum exchange. In the projection area of a vertical tube bundle, the local velocity, which is close to the inlet region, is higher than the bottom region. This can occur due to obstruction of the lower tube sheet, and it can force the fluid into the two sides of inlet as shown in Figure 4 (e). Based on the comparisons, it can be also observed that the deviations of fluid at the inlet of tubes are more severe for the second-row tubes than the first-row tubes. In addition, due to the barrier effect of the ends of head-bonnet, the velocity decreases faster near the ends of head-bonnet than that at the center.
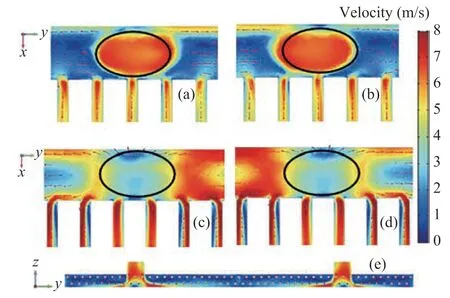
Figure 4 Velocity contours of different transversal sections: (a) First-row on the left side; (b) First-row on the right side; (c) Second-row on the left side; (d) Second-row on the right side; (e) Front view from tube exit section
3.2 Temperature distributions
The temperature contours in the air cooler is shown in Figure 5, and the velocity contours are also provided for a better comparison. It can be seen that the contours of temperature along the flow direction is wavy, which is caused by the uneven distribution of the flow field. In order to clarify this phenomenon, the enlarged partial view of outlet tube bundles at the same location for temperature and velocity distributions are selected for analysis. It can be seen that the larger velocity regions correspond to a higher fluid temperature and this can be contributed to the shorter duration of heat transfer promoted by the greater velocity. To specify the relationship between temperature and velocity, the average temperature and velocity distribution for the first-row tubes and second-row tubes are calculated as shown in Figure 6. It can be found that there is a consistent change between the temperature and velocity as mentioned above.
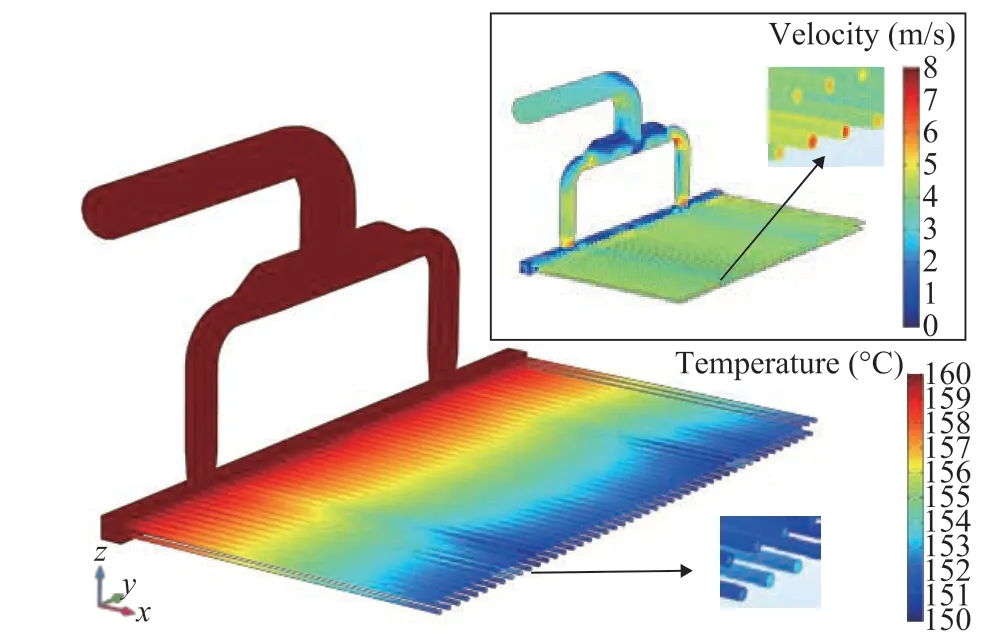
Figure 5 Temperature contours in the air cooler for Vinlet = 3.5 m/s
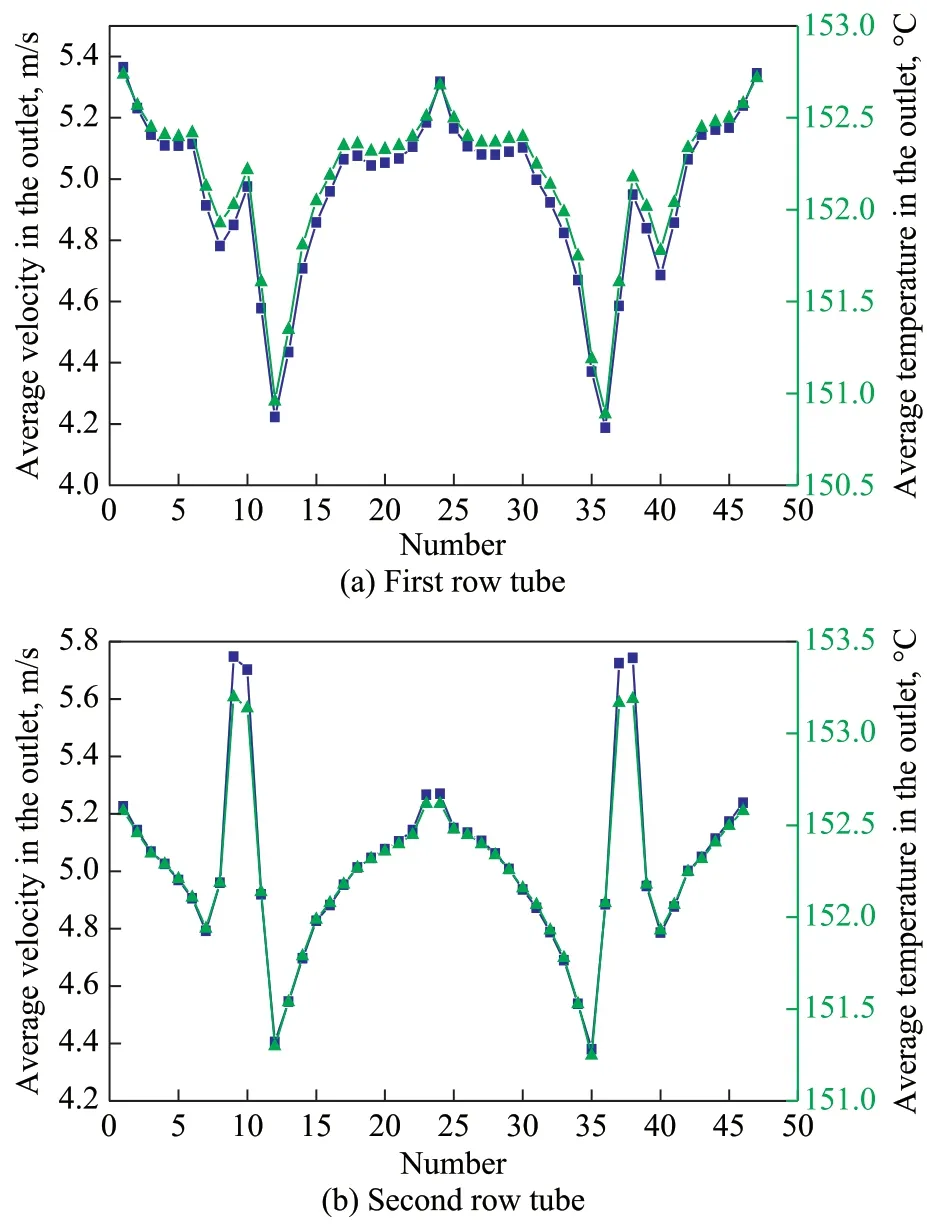
Figure 6 Relationship between the temperature and velocity for the two rows of tubes
■—Velocity; ▲—Temperature
3.3 Particles distribution
The particle distributions for different particle size under the steady state are shown in Figure 7. It can be seen that the particle distribution for dp= 25 μm is the most uniform in the air cooler, which reveals a better following behavior for smaller particle size. For particles size of 50 μm, there is only a small number of particles distributing in the intermediate area of the air cooler.
For particles with size of dp=75 μm and 100 μm, the centrifugal force in the bend acting on the particles gradually gets larger, which causes most of the particles drifting to the right side of the air cooler. However, when the particles size reaches 125 μm and 150 μm, the following behaviors of particles become severe, and the particles tend to fall from the inside of the elbow. Thus, as shown in Figure 7 (f), the particles would mainly accumulate in the inner area corresponding to the vertical tube bundle.
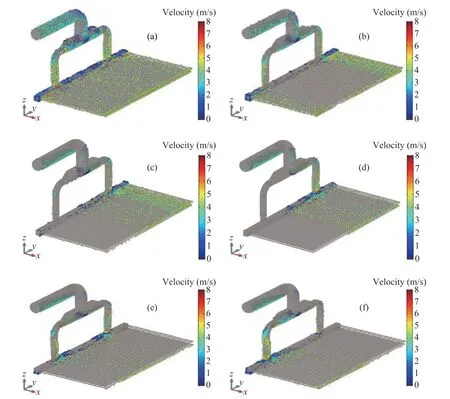
Figure 7 Distribution of different particles sizes in the air cooler: (a) dp = 25 μm; (b) dp = 75 μm; (d) dp = 100 μm; (e) dp = 125 μm; (f) dp = 150 μm
In order to visualize particles trajectories along the tubes, the Poincare map for the dp= 75 μm in the different flow direction of No. 46 tube in the second-row is given in Figure 8. The particle distributions at x=100 mm is uniform, and some particles can even stick to the upper wall. This is due to the higher turbulence intensity at the inlet of the heat exchanger tubes, which is consistent with corrosion under the deposited layer of the heat exchanger tube at the actual operating conditions. Along the flow direction, the turbulent intensity of multiphase flow decreases and the particles deposit to the bottom of the tube.
3.4 Particles statistical analysis
3.4.1 The effect of particles size on deposition quantity
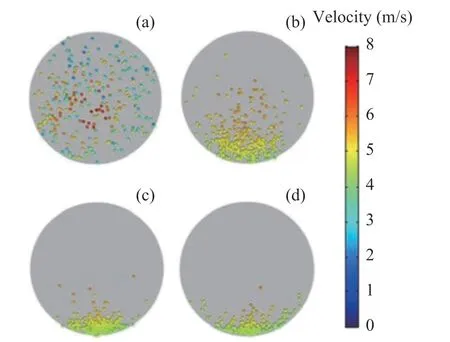
Figure 8 Poincare Map of particles in different cross section of a single heat exchanger tube: (a) x=100 mm; (b) x=500 mm; (c) x=1000 mm; (d) x=1500 mm
The deposition of particles with different particle sizes and locations in the air cooler are shown in Figure 9. For particles with a size of 25 μm and 50 μm, the phenomenon of particle deposition in all places is not obvious[23-24]. However, the deposition phenomenon in the heat exchanger tube is more severe than at its outlet. When the particles size ranges from 75 μm to 125 μm, the number of particle deposits in the inlet pipes can increase gradually. Correspondingly, the particle deposits in the heat exchanger tubes would decrease, and the difference between the inner and the outlet of heat exchanger tubes is not so obvious. For particles with sizes ranging from 50 μm to 100 μm, the number of particle depositions in the inlet header has increased significantly with the increase of its size, and the particle deposition in the heat exchanger tube and the outlet gradually decreases. When the particle size is larger than 100 μm, the deposition rate in the tubes is slowed, and the deposition process has become stable in the heat exchanger tube and at the heat exchanger outlet. The phenomenon mentioned above indicates that as the particles size increases, the particle’s following behaviors are weakened gradually and the deposition rate is accelerated. On the other hand, the deposition rate gradually decreases in the heat exchanger tube, when the adherent particles on the upstream inlet branch and the inlet header are saturated.

Figure 9 The deposition of different size particles in different parts of the air cooler
Figure 10 shows statistics for the deposition of different particle sizes in the first row, the second row, and the total heat exchanger tubes. It can be found that when the particles size is less than 50 μm, the total deposition in the tubes is almost constant. When the particles size is larger than 50 μm, the total number of deposited particles in the tube bundles begins to decline, and this is caused by the increase of particle deposits in the upstream pipe. It can also be found from Figure 10 that the number of particle deposits in the second-row tubes is greater than that of the first-row tubes except for the case with a particle size of dp=50 μm. As for the smaller particle size (dp=50 μm), the velocity in the second-row tubes are larger, and the particles easily follow the fluid into the second-row tubes. When the particle size is larger than 50 μm, the effect of particle inertia becomes larger, and particles tend to accumulate at the bottom of head-bonnet, which makes the particles more easily entrained to the second-row tubes than the first-row tubes. Thus, the risk of corrosion at the second-row tubes is more severe than the first-row, which is consistent with many failure cases in the air cooler.
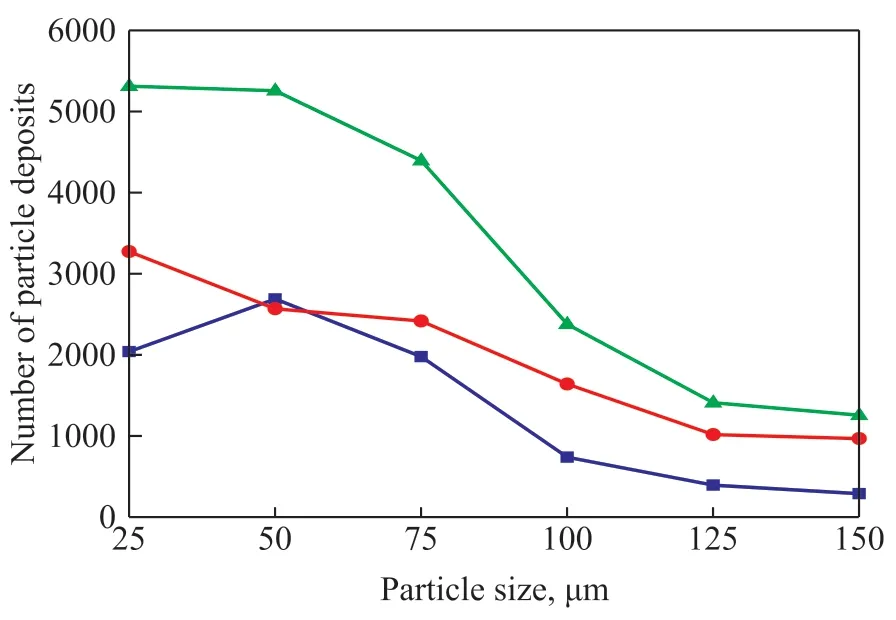
Figure 10 The particle deposition for different size in the heat exchanger tube
3.4.2 The distribution of particles in different heat exchanger tubes
The data on deposition of particle with different sizes in the first-row and second-row tubes have also been analyzed, as shown in Figure 11. For the first-row tubes (Figure 11.(a)), the tube bundles with the deposition amount of particles greater than 50 are No. 1—7, 22—26, 37—47. For the second-row tubes (Figure 11(b)), and in other tubes the amount of particle deposits all exceed 50 except for No. 7, and the particle number in tube No. 1, 23—26, 38—40, 43—46 is larger than 100. According to the above analysis, the particle deposition of high-risk prone position can be determined in the left area of No. 1—3 tube, the middle area of No. 23—26 tube, and the right area of No. 38—46 tubes for both of the first-row and second-row tubes.
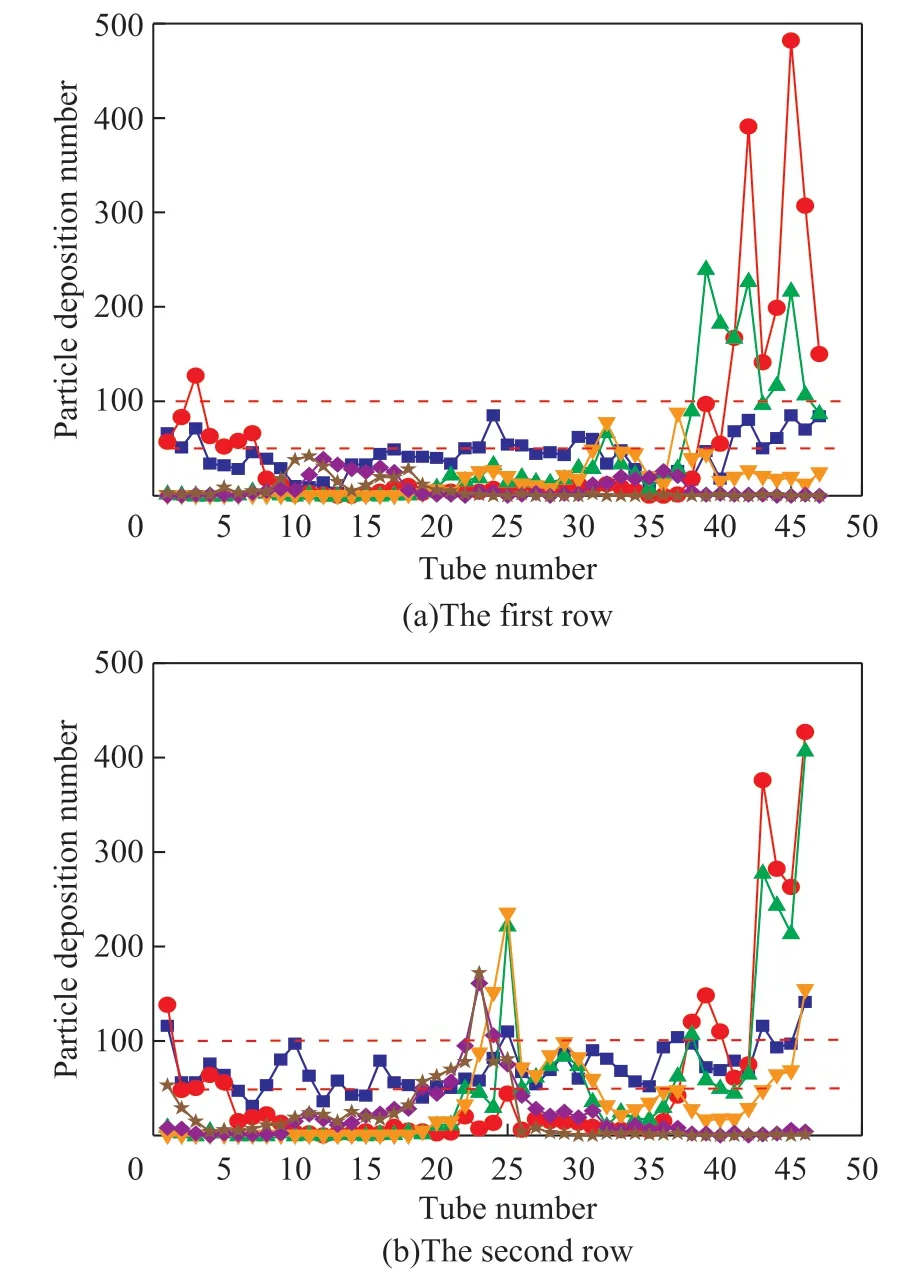
Figure 11 The deposition number of the particles in the two tube rows
4 Conclusions
This paper studies the drift deposition characteristics of ammonium salt particles in the hydrogenation air cooler, and the influence of multiphase flow and temperature has been investigated. Lagrangian particles tracking method is used to study particles trajectory, and the numerical simulation results tally with the actual position of deposition. The main conclusions are drawn below:
(1) The flow and temperature field appears as a symmetrical distribution in space. The variation of average temperature and the average velocity for each cross section in the first-row and second-row tubes is completely consistent.
(2) Following behaviors of ammonium salt particles highly depend on the particle size. For smaller particles, the deposition phenomenon is more uniform in the whole air cooler. For larger particles, the inertia of particles becomes the main factor affecting the particle trajectory.
The particles tend to fall from the interior of the vertical bend, so the inlet tube should be designed to be parallel to the heat exchanger tubes to avoid deviation of the particles.
(3) For larger particles, the particles tend to deposit in the inlet header and pipes other than the heat exchanger tubes. For heat exchanger tubes, under the effects of turbulence and particle inertia, the deposition number is larger in the second-row tubes than the first-row, and the particles distribute more uniformly in the entrance of the heat exchanger tube. In addition, the high-risk tubes mainly concentrate on the middle area and the right side area, which are the direction of structural optimization.
Acknowledgments:The project was supported by the National Key R&D Program of China (Grant No.2017YFF0210403), the Zhejiang Provincial Natural Science Foundation of China (Grant No.LY17E060008), the Talent Project of Zhejiang Association for Science and Development Project of SINOPEC (No.318023-2).
杂志排行
中国炼油与石油化工的其它文章
- Comparison on Adsorptive Separation of n-Paraffins Based on Binderless and Binder-containing Zeolite 5A Pellets
- Effect of Doped Vanadium Dioxide on Oxidative Desulfurization Reaction
- CoMnMgAl Hydrotalcite-like Compounds and their Complex Oxides: Facile Synthesis and FCC SOx Removal
- Boosting the Photocatalytic Activity of WO3 by Highly Dispersed CoWO4 or CuWO4
- Discussion on the Mechanism of Boric Acid and Phosphoric Acid to Improve the Hardening of Complex Calcium Lubricating Grease
- Effect of Zeolite 5A Particle Size on Its Performance for Adsorptive Separation of Ethylene/ Ethane
