Boosting the Photocatalytic Activity of WO3 by Highly Dispersed CoWO4 or CuWO4
2020-01-13HeFangKangMingliangSongChundongYangXiaZhangJing
He Fang*; Kang Mingliang*; Song Chundong; Yang Xia; Zhang Jing
(School of Chemistry and Materials Science, Liaoning Shihua Uniνersity, Fushun 113001)
Abstract: WO3 photocatalyst decorated with highly dispersed CoWO4 or CuWO4 nanoparticles (CoWO4/WO3 or CuWO4/WO3) was successfully synthesized using an in-situ impregnation method followed by solid-state reaction. The structure, morphology, photophysical property, and photocatalytic degradation mechanism of the CoWO4/WO3 or CuWO4/WO3 samples were investigated by XRD, SEM, TEM, EDS, HR-TEM, UV-vis DRS, SPV, and active trapping techniques. The XRD, SEM, and TEM results have revealed that CoWO4 or CuWO4 are highly dispersed on the WO3 surface, when the loading amount of CoWO4 or CuWO4 is small. However, obvious agglomeration is observed for the CoWO4 or CuWO4 particles, when the loading amount of CoWO4 or CuWO4 was increased. The visible-light photocatalytic degradation of RhB shows that all CoWO4/WO3 or CuWO4/WO3 samples exhibit superior photocatalytic performance as compared to pure WO3. This is mainly attributed to the formation of type II heterojunction between WO3 and CoWO4 or CuWO4, which can promote the photogenerated electrons and holes separation and transfer. Moreover, it is found that 0.2% CoWO4/WO3 or 0.2% CuWO4/WO3, in which MWO4 nanoparticles are uniformly dispersed on the surface of WO3, can achieve the most excellent photocatalytic activity among CoWO4/WO3 or CuWO4/WO3 samples, respectively. As compared with WO3, an enhancement about 9.1 times or 6.8 times in photocatalytic activity is observed on 0.2% CoWO4/WO3 or 0.2% CuWO4/WO3, respectively. Furthermore, the active species trapping experiment demonstrates that •OH, h+, and •O2- generated during the photocatalytic process are all the reactive species in photocatalytic degradation of Rhodamine B (RhB) on CoWO4/WO3 or CuWO4/WO3. This study presents a strategy to design superior photocatalyst for organic compound degradation.
Key words: WO3; CoWO4; CuWO4; heterojunction; photocatalytic degradation
1 Introduction
Energy crisis and environmental pollution are two major challenges the community has to face in the 21st century[1-2]. As an emerging technology, semiconductor photocatalytic technology has shown tremendous potential in clean energy production and organic pollutants degradation, which has attracted significant attention around the world[3-5]. Specially, photocatalysis has been widely applied in the treatment of organic pollutants in wastewater discharged from petroleum industry because it can completely oxidize organic pollutants into small molecular inorganic compounds at room temperature[6-7]. For the photocatalytic reaction, the charge separation and transfer is one of the critical steps for determining the photocatalytic reaction rate[5,8-11]. Thus, the study on improving the efficiency of charge separation and transfer is highly meaningful.
Many efforts, such as loading of a noble metal[12-13], semiconductor combination to form heterojunction[14-15], carbon-based material modification[16-17], morphology control[18-19], and crystal facet engineering[20-21]have been developed to promote the charge separation and transfer in photocatalytic reaction. Among these methods, fabrication of semiconductor heterojunction, which can form build-in electric fields at the interface of different semiconductors, has been widely applied due to its high efficiency in promoting the separation of the electrons and holes[22-25]. Since the heterojunction is formed in the interface region between two semiconductors, the closely contacted interface and large contact area between the two semiconductors are needed for significant improvement of the separation of the electrons and holes[26-27]. Therefore, it is of great significance to precisely control the interface and contact area in photocatalyst with a heterojunction structure.
As a transition metal oxide, tungsten oxide (WO3), which is characteristic of non-toxicity[28-29], stability[30-31], and good corrosion resistance[32-33], exhibits a relatively small band gap of 2.4—2.8 eV and shows response under visible light irradiation[34-35]. Nevertheless, the photocatalytic activity of pure WO3is quite low and far from satisfactory owing to its high recombination rate of charge carries, which renders its extensive application impossible[36-37]. The transition metal tungstates of MWO4type (M = Co, Cu, Ni, Mn, Zn, and so on), which are ternary oxide semiconductor materials, have been widely studied because they exhibit interesting technological properties such as ionic conductivity and photoluminescence[38-39]. Especially, many previous studies[40-41]have demonstrated that the band alignment of WO3and MWO4(such as CuWO4and ZnWO4) is suitable for the formation of heterojunction between WO3and MWO4, which provides a driving force for the separation of photo-generated charge carriers. Additionally, the in-situ method is beneficial to the formation of the close contact between MWO4and.
In this work, we took CoWO4and CuWO4as the typical tungstates, and MWO4nanoparticles were uniformly dispersed on the surface of WO3particles (CoWO4/WO3and CuWO4/WO3) using an in-situ impregnation method followed by solid-state reaction. The structure and morphology of CoWO4/WO3and CuWO4/WO3were investigated by powder X-ray diffraction (XRD), scanning electron microscope (SEM), high resolution transmission electron microscope (HRTEM), and the Brunauer-Emmett-Teller (BET) surface area measurement techniques. It is found that the photocatalytic activity of WO3was greatly boosted after loading the highly dispersed CoWO4or CuWO4nanoparticles onto the surface of WO3by the in-situ impregnation method. Furthermore, the mechanism of improved photocatalytic activity was further investigated by a surface photovoltage spectroscope (SPV), and the determination of reactive species experiment.
2 Experimental
2.1 Materials
Ammonium tungstate hydrate ((NH4)5H5[H2(WO4)6]·H2O), nitric acid (HNO3), copper nitrate trihydrate (Cu(NO3)2·3H2O), cobalt nitrate hexahydrate (Co(NO3)2·6H2O), Rhodamine B (RhB), ethylenediamine tetraacetic acid (EDTA), isopropanol (IPA), and ascorbic acid were purchased from the Sinopharm Chemical Reagent Co. Ltd. All above chemicals were of analytically pure grade and were directly used without further purification. All the aqueous solutions were prepared using deionized water.
2.2 Sample preparation
The procedure for preparing WO3by the precipitation method can be found in our previous work[44]. The assynthesized WO3sample was used as a support for CoWO4/WO3or CuWO4/WO3. The CoWO4/WO3or CuWO4/WO3samples were synthesized as follows: WO3support was dispersed in the solution containing different concentrations of Co(NO3)2·3H2O or Cu(NO3)2·6H2O, and the above suspension was dried in a hot water bath under continuous magnetic stirring. The obtained powder was further dried at 80 °C overnight and was then calcined at 500 °C in air for 3 h to obtain n% CoWO4/WO3or n% CuWO4/WO3, with the n% representing the mass ratio (0.05%, 0.1%, 0.2%, 1%, 3%, and 7%) of Co or Cu to W.
2.3 Characterization
The crystalline structure of all samples was characterized by the powder X-ray diffraction (XRD) technique using a Rigaku MiniFlex diffractometer with the Cu Kα radiation source. The morphology and particle size of samples were investigated using the scanning electron microscopy (SEM, Quanta 200 F) with an energy dispersive spectroscope (EDS) and the high-resolution transmission electron microscopy (HETRM, JEOL, JEM-2100). The ultraviolet-visible diffuse reflectance spectra (UV-vis DRS) were recorded on a JASCO V-550 UV-Vis spectrophotometer. The surface photovoltage spectra (SPV) were recorded by a self-assembled instrument including a photovoltaic cell, in which the photocatalyst powder were stuck in the middle of two ITO electrodes (d=1.2 mm, resistivity: 8—12 Ω/cm2, Sigma-Aldrich, USA). The Brunauer-Emmett-Teller (BET) specific surface area was examined by the adsorption-desorption N2isotherms using a NOVA 4200e surface area and pore size analyzer of Quantachrome.
2.4 Photocatalytic degradation of RhB
Photodegradation of RhB was carried out in a 250-mL Pyrex reactor filled with deionized water (60 mL) containing RhB (10 mg/L) and photocatalyst samples (0.06 g). The suspension was stirred for 2 h in the dark to obtain an adsorption-desorption equilibrium before illumination. After that, the suspension was irradiated with a 300 W xenon lamp (with a cutoff filter, λ > 420 nm). The distance between the light source and the surface of the suspension was controlled to be 15 cm. After irradiation with visible light, a 3-mL aliquot was taken out in every one hour of time interval and was immediately centrifuged. The RhB concentration in the clear solution was analyzed by the optical characteristic absorption (UV mini 1240 spectrophotometer, Shimadzu Corporation) at a wavelength of 553 nm which was the maximum absorption wavelength of RhB solution. The degradation rate of RhB can be calculated according to the method referred to in previous reports[45-46]θ
The photocatalytic stability of 0.2% CoWO4/WO3and 0.2% CuWO4/WO3photocatalysts in the degradation of RhB was investigated by the recycle experiments. After each cycle of reactions, the photocatalyst powder was centrifuged, collected, and washed for several times by ethanol and deionized water, respectively.
2.5 Active species trapping experiments
To investigate the active species in photocatalytic reaction on CoWO4/WO3or CuWO4/WO3samples, ethylenediamine tetraacetic acid (EDTA), isopropanol (IPA), and ascorbic acid were used as trapping agent for hole (h+), hydroxyl radical (•OH), and superoxide radical (•O2-), respectively[47]. The trapping agent was added to the solution before dark adsorption, with other steps kept in consistency with the degradation experiment.
3 Results and Discussion
3.1 Textural and morphology analysis
The crystal structures of pure WO3and CoWO4/WO3samples were characterized by XRD patterns. As presented in Figure 1(a), all diffraction peaks of WO3sample were in good agreement with monoclinic WO3(m-WO3) (PDF# 83-0951). The diffraction peaks at 23.1°, 23.5°, 24.4°, 26.6°, and 33.3° corresponded to planes of (002), (020), (200), (120), and (022) of WO3, respectively. It is found that the XRD patterns of 0.05% CoWO4/WO3, 0.1% CoWO4/WO3, and 0.2% CoWO4/WO3were almost the same as those of WO3. However, for 1% CoWO4/WO3, 3% CoWO4/WO3, and 7% CoWO4/WO3samples (Figure 1(b)), some small peaks of CoWO4at 15.6°, 18.9°, 30.5°, 31.4°, 36.5°, and 38.6° (PDF# 15-0867) could be observed in addition to the characteristic peaks of pure m-WO3. The formation of CoWO4implies that a solid-state reaction between WO3and CoO (WO3+CoO→CoWO4) occurred when the calcination temperature was 500 °C.

Figure 1 (a) XRD patterns and (b) magnified XRD patterns of the CoWO4/WO3 samples
A phenomenon should be noted that no characteristic peaks belonging to CoWO4were observed for 0.05% CoWO4/WO3, 0.1% CoWO4/WO3, and 0.2% CoWO4/WO3samples. The possible reasons are as follows: (1) The concentration of MWO4was quite low, which was below the detection limit of XRD[48]; (2) The particle size of MWO4was quite small and the MWO4particles were uniformly dispersed on the surface of WO3[49].
The similar result is also observed in the XRD patterns of CuWO4/WO3. As presented in Figure 2, some small characteristic peaks of CuWO4(PDF# 73-1823) at 19.0°, 26.0°, 30.1°, 31.7°, and 32.1° are observed for 1% CuWO4/WO3, 3% CuWO4/WO3, and 7% CuWO4/WO3samples in addition to the typical peaks of m-WO3. This result also demonstrated the formation of CuWO4on the surface of WO3.

Figure 2 (a) XRD patterns and (b) the magnified XRD patterns of the CuWO4/WO3 samples
SEM and EDS were employed to observe the morphology and the corresponding elementary composition of CoWO4/WO3and CuWO4/WO3samples. As presented in Figure 3(a), 3(b), and 3(c), WO3with a sphericallike structure was successfully prepared with an overall diameter of approximately 180 nm. When the loading amount of CoWO4or CuWO4was 0.2%, no recognizable changes in the morphology and particle size of WO3can be detected from the SEM images (Figure 3(d) and Figure 3(g)). The reason for this phenomenon may be that the CoWO4or CuWO4particles obtained by the solidstate reaction were quite small and well-dispersed on the surface of WO3particles, which could not be discerned by SEM. This result was consistent with the results of XRD analyses (Figure 1).
However, for the 7% CoWO4/WO3or 7% CuWO4/WO3samples, some small particles can be seen in addition to the large WO3particles (Figure 3(e) and 3(h)). This is true mainly because the CoWO4or CuWO4particles are prone to self-agglomeration during the calcination process, when the loading amount of CoWO4or CuWO4is increased. The results of EDS (Figure 3(f) and 3(i)) showed that Co, W, and O elements (or Cu, W, and O elements) were all detected at their corresponding binding energy of electron values, which further proved the purity of CoWO4/WO3or CuWO4/WO3samples.
In order to prove that small MWO4particles were really decorated on the surface of WO3in the 0.2% MWO4/WO3samples. The 0.2% CuWO4/WO3sample was selected as the representative sample to be characterized by TEM and HRTEM. As shown in Figure 4(a), some small particles with a diameter of about 20 nm are clearly loaded onto the surface of large particles. As shown in Figure 4(b) (HRTEM image of the 0.2% CuWO4/WO3sample), the spacing of the lattice fringes of the large WO3particle was found to be 0.357 nm, which can be well indexed as the (200) plane of WO3. The fringe spacing of the small particle was found to be 0.310 nm, which can be indexed as (-1-11) plane of CuWO4. Additionally, it is found from Figure 4(a) and 4(b) that the small CuWO4particle and the large WO3particle contacted closely, which was beneficial to the formation of heterojunction at the interface between CuWO4and WO3.

Figure 3 (a) SEM image and (b) pore size distribution of WO3, (c) EDS image of WO3, SEM images of (d) 0.2% CoWO4/WO3 and (e) 7% CoWO4/WO3, (f) EDS image of 0.2% CoWO4/WO3, SEM images of (g) 0.2% CuWO4/WO3, and (h) 7% CuWO4/WO3, (i) EDS image of 0.2% CuWO4/WO3.

Figure 4 TEM (a) and HRTEM (b) images of 0.2% CuWO4/WO3.
3.2 Photocatalytic properties
In order to investigate the photocatalytic activity of the as-prepared samples, RhB was chosen as a representative organic pollutant to compare the photocatalytic activity of CoWO4/WO3and CuWO4/WO3samples. Figure 5(a) presents the curves of RhB concentration changes with the irradiation time on WO3and CoWO4/WO3samples. It is clear that WO3presented a low degradation activity (30% in 6 h). The obviously increased photocatalytic activity was demonstrated by all the CoWO4/WO3samples, as displayed in Figure 5(a). The photocatalytic activity gradually increased when the loading amount of CoWO4increased from 0.05% to 0.2%. It should be noted that the greatly improved photocatalytic activity, which was as high as 95.1%, was revealed by the 0.2% CoWO4/WO3sample. However, the degradation rate decreased gradually when the loading amount of CoWO4was higher than 0.2%. The first-order rate constant (k) of all samples (Table 1), which can accurately reflect the photocatalytic performance, can be described by the first-order kinetics of ln(Ct/C0) versus the reaction time (t)[1,18]:


Figure 5 Photocatalytic degradation of RhB in aqueous solution in the presence of CoWO4/WO3 samples and CuWO4/WO3 samples
where k is the apparent first-order rate constant, C0and Ctare the equilibrium concentration of RhB after 2 h of dark adsorption and the RhB concentration remaining in the solution at an irradiation time t h, respectively. As presented in Table 1, the k value for the CoWO4/WO3firstly increased and then decreased when the CoWO4amount increased from 0.05% to 7%. The 0.2% CoWO4/WO3sample possessed the highest k value of 0.55514 h-1, which was 9.1 times that of pure WO3(0.06099 h-1). Furthermore, the photocatalytic activity of CuWO4/WO3with different CuWO4amounts was also investigated. An obvious volcano curve was observed for the photocatalytic degradation efficiency or k value with increase in the amount of CuWO4(Figure 5(b) and Table 1). The k value of 0.2% CuWO4/WO3, which was the highest value among the CuWO4/WO3samples, was 0.41759 h-1. This value is about 6.8 times greater as compared to pure WO3. As it has been discussed above, the 0.2% CoWO4/WO3or 0.2% CuWO4/WO3samples showed the highest activity among CoWO4/WO3or CuWO4/WO3samples. The stability and durability of a photocatalyst is crucial to the practical photocatalytic degradation applications. Therefore, the 0.2% CoWO4/WO3and 0.2% CuWO4/WO3samples were chosen as the representative samples to study the stability and reusability of photocatalyst for degradation of RhB under visible light. It can be seen from Figure 6 that the 0.2% CoWO4/WO3or 0.2% CuWO4/WO3samples have shown good reusability in degradation of RhB with only a small decline of activity after five cycles.
3.3 The mechanism for the enhanced photocatalytic performance of MWO4/WO3 photocatalyst
It is of interest to explore the reasons for enhanced photocatalytic activity of CoWO4/WO3and CuWO4/WO3samples. Many previous studies[16]have demonstrated that the surface area has a significant influence on the photocatalytic degradation of organic compounds. In general, a larger surface area can yield more absorption and reaction sites, which are in favor of the photocatalytic reaction[5]. As listed in Table 1, compared with the pristine WO3(8.5 m2/g), a little bit reduction was observed in the surface area of CoWO4/WO3and CuWO4/WO3samples. To exclude the contribution of surface area, the k values of the CoWO4/WO3and CuWO4/WO3sample were normalized to the corresponding BET surface areas (with k value being divided by the surface area). It can be seen that the activity trend of k/SBETis in accordance with that of k. Thus, it is concluded that the surface area is not the main reason for the enhanced performance of the CoWO4/WO3or CuWO4/WO3samples.

Table 1 First-order rate constants (k) for the degradation of RhB, BET surface areas, and relative coefficients (R2) for WO3 and MWO4/WO3 (M = Co, Cu) samples
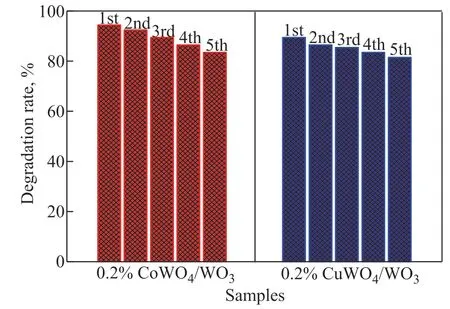
Figure 6 The recycle stability of 0.2% CoWO4/WO3 and 0.2% CuWO4/WO3 samples
The UV-vis DRS spectra were obtained to further evaluate the photophysical properties of the CoWO4/WO3or CuWO4/WO3samples, as shown in Figure 7. Compared to pure WO3, all CoWO4/WO3samples can utilize a little bit more lights. With the CoWO4loading amount increasing from 0.05% to 7.0%, the absorption edge gradually shifted to longer wavelength (485 nm for 0.05% CoWO4/WO3and 530 nm for 7% CoWO4/WO3, Figure 7(a)). As we all know, the enlarged spectral response range may result in the enhanced photocatalytic performance of CoWO4/WO3samples[50]. However, the k values of CoWO4/WO3did not increase although the spectral response range increases with an increasing loading amount of CoWO4on WO3, denoting that the 7% CoWO4/WO3sample exhibits the most wide range of the photoadsorption, while it shows the lowest photocatalytic activity. The similar phenomena were also observed in CuWO4/WO3samples (Figure 7(c) and Table 1). Thus, we can conclude that the enhanced light absorption of MWO4/WO3is not the predominant reason for its improvement in the photocatalytic performance.
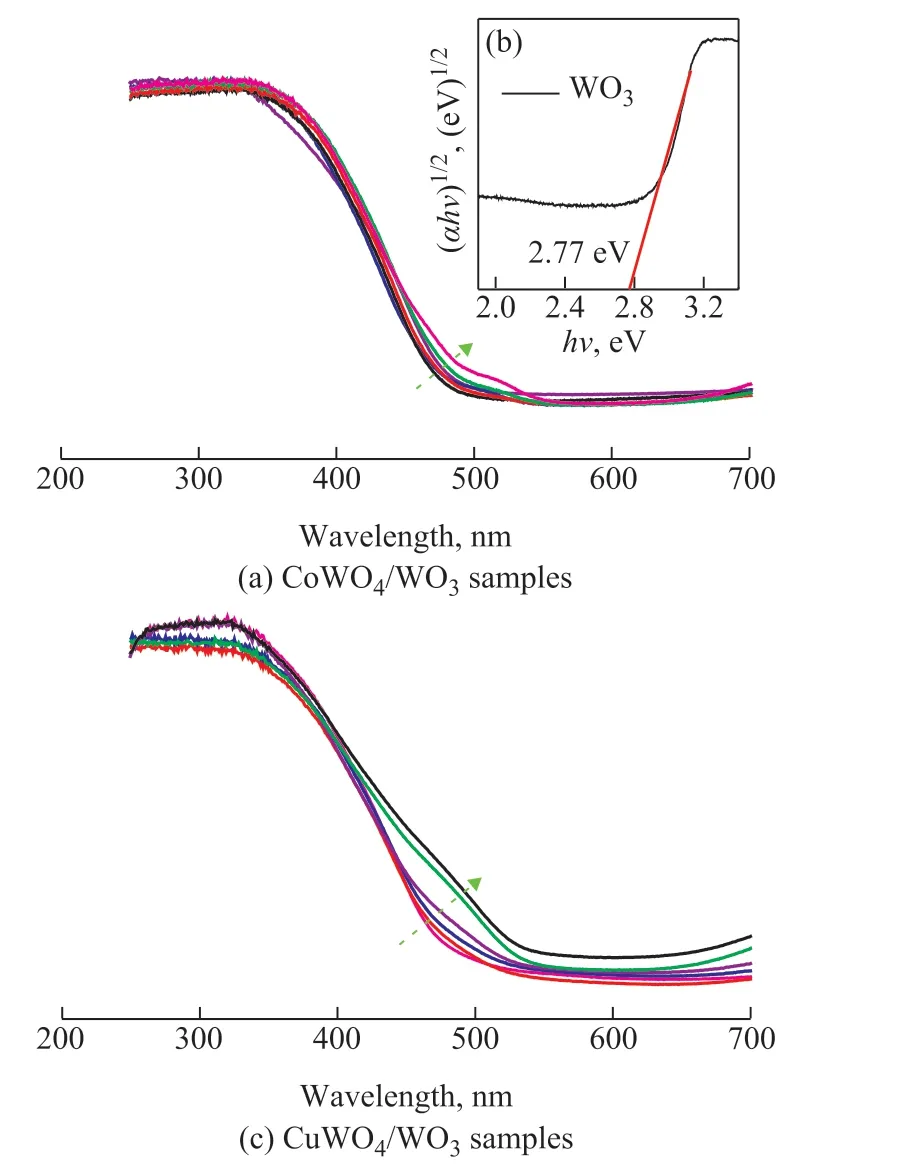
Figure 7 UV-vis DRS spectra of (a) WO3 and CoWO4/WO3 and (c) WO3 and CuWO4/WO3, (b) is the Tauc’s plot of WO3
It is well known that the formation of heterojunction boosts the photocatalytic activity due to the existence of the build-in electric fields at the interface of two semiconductors if their relative band edge positions are suitable[51]. The following analysis focuses on whether the heterojunction between CoWO4(or CuWO4) and WO3can be formed in CoWO4/WO3(or CuWO4/WO3) samples. The WO3band gap can be obtained from the UV-Vis DRS spectra according to Eq. (2)[52-53]:

where α, ν, A, and Egare the absorption coefficient, light frequency, proportionality constant, and band gap, respectively, and n is equal to either 1 for allowed direct transition or 4 for allowed indirect transition. The optical band gap of WO3is between the oxygen 2p orbitals and the tungsten 5d orbitals, which are indirect band transitions. Hence the value of n was determined to be 4. It can be seen from Figure 7(b) that the optical band gaps of 2.77 eV for WO3can be obtained through extrapolation of the (αhν)1/2vs. hν plot on the x intercepts. This value is completely in agreement with previous results[44]. The following Eqs. (3) and (4) can be used to calculate the valance band edge position and conduction band edge position of
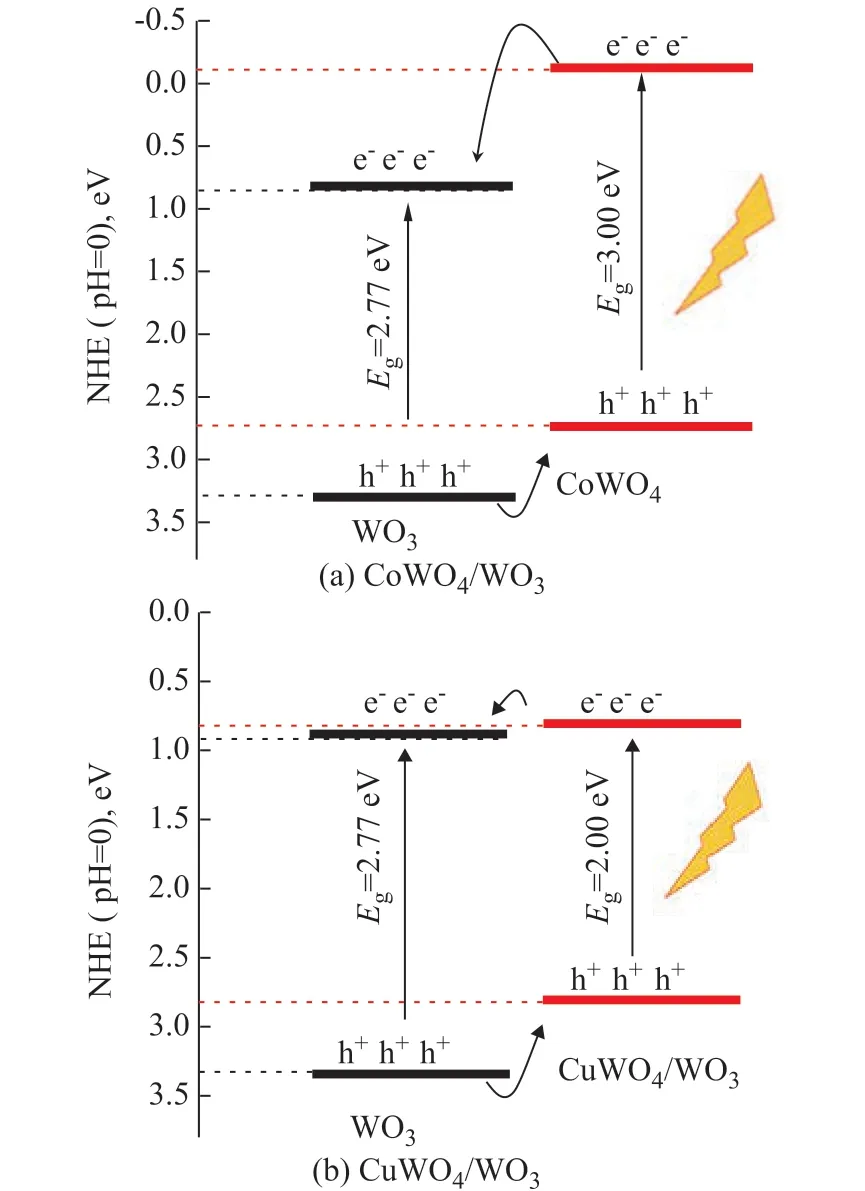
Figure 8 Relative band edge positions of (a) CoWO4/WO3 and (b) CuWO4/WO3

where EVBis the valance band edge potential, ECBis the conduction band edge potential, X is the absolute electronegativity of the semiconductor, Eeis the energy of free electrons on the hydrogen scale (about 4.5 eV), and Egis the band gap energy of the semiconductor. The X value for WO3is 6.59 eV[56]. Thus, the positions of the conduction and the valence bands of WO3are estimated to be 3.32 eV and 0.86 eV, respectively.
Many previous studies have shown that the positions of the conduction and the valence bands of CoWO4are 2.73 eV and -0.11 eV[40], and those of CuWO4are 2.82 eV and 0.82 eV[44], respectively. Obviously, the VB position of WO3is positive compared to that of CoWO4or CuWO4,while the CB level of CoWO4or CuWO4is negative compared to that of WO3. Thus, it is possible to fabricate a type II heterojunction structure between CoWO4or CuWO4and WO3(Figure 8), which is verified by HRTEM technique (Figure 4). The formation of heterojunction structure is beneficial to the separation of photo-excited electrons and holes.The surface photovoltage (SPV) was measured to study the separation behaviours of photo-excited electrons and holes in CoWO4/WO3or CoWO4/WO3samples. In the surface photovoltage (SPV) measurements, the signal of SPV is attributed to the change in surface potential barriers before and after light illumination. Generally, a higher SPV response intensity indicates a higher separation rate of photo-excited charges while a lower SPV response intensity denotes a lower separation rate of photoexcited charges[57-58]. As is presented in Figure 9, all CoWO4/WO3or CuWO4/WO3samples show higher SPV intensity as compared with pure WO3. This observation indicates an accelerated dynamics process of photo-induced charge separation occurring on the interface between CoWO4(or CuWO4) and WO3, which is crucial to the photocatalytic degradation of RhB in the CoWO4/WO3or CuWO4/WO3heterostructure. Moreover, the trend for the SPV response intensity is similar to that for the photocatalytic activity on CoWO4/WO3or CuWO4/WO3samples, indicating that the formation of heterojunction between CoWO4(or CuWO4) and WO3is the main reason explaining why the CoWO4/WO3or CuWO4/WO3samples exhibit the higher photocatalytic activity than pure WO3.Furthermore, it is of interest to study the reason denoting why the 0.2% CoWO4/WO3(or 0.2% CuWO4/WO3) sample exhibited the highest photocatalytic performance among CoWO4/WO3or CuWO4/WO3samples. According to the results of XRD (Figure 1 and Figure 2), SEM (Figure 3), and HRTEM (Figure 4), the formed MWO4nanoparticles are uniformly dispersed on the surface of WO3when the loading amount is low. These highly dispersed small nanoparticles are in contact with the large WO3particles to form a great number of interfacial regions, which are beneficial to the separation between photogenerated electrons and holes. However, when the loading amounts of MWO4are 0.05% and 0.1%, the contact regions between MWO4and WO3are too small, which cannot effectively promote the photo-induced charges transfer and separation. When the loading amount of MWO4is further increased to exceed 0.2%, the MWO4nanoparticles gradually agglomerate to large particles, which can also decrease the contact area and the corresponding separation efficiency. Additionally, compared with MWO4/WO3with a high loading amount of MWO4, the photo-induced electrons in the 0.2% MWO4/WO3sample can easily transfer to the surface and react with the RhB because of the small particle size of MWO4nanoparticles. As it has been discussed above, the proper contact region and transfer pathway are the main reasons explaining why the 0.2% MWO4/WO3sample exhibited the most excellent photocatalytic performance among the MWO4/WO3samples.

Figure 9 Surface photovoltage (SPV) spectra of (a) WO3 and CoWO4/WO3 or CuWO4/WO3
3.4 The proposed photocatalytic degradation mechanism
In order to further study the photodegradation mechanism of RhB by CoWO4/WO3or CuWO4/WO3samples, the trapping experiments of reactive species were performed. Isopropanol (IPA), ethylenediaminetetraacetate (EDTA), and ascorbic acid were employed as the hydroxyl radical (•OH), hole (h+), and superoxide radical (•O2-) scavengers, respectively[47]. The degradation rate of RhB on the 0.2% CoWO4/WO3was 95% under 6 h of irradiation and it decreased to 46%, 29%, and 19% as IPA, EDTA, and ascorbic acid were added into the reaction solution, respectively (Figure 10). Similarly, when IPA, EDTA, and ascorbic acid were added into the reaction solution in the presence of 0.2% CuWO4/WO3sample, the degradation of RhB on 0.2% CuWO4/WO3decreased from 90% to 52%, 33%, and 22%, respectively. These results indicate that all •OH, h+, and •O2-generated during the photocatalytic process are the reactive species which participate in photocatalytic degradation of RhB on CoWO4/WO3or CuWO4/WO3. Moreover, the effect of these active species on the photocatalytic activity decreased in the following order:> h+> •OH, which means that the reaction mechanism for CoWO4/WO3or CuWO4/WO3is similar.

Figure 10 Effects of scavengers on the photocatalytic degradation of RhB by 0.2% CoWO4/WO3 and 0.2% CuWO4/WO3 photocatalysts
Upon combining the results mentioned above, a possible mechanism for photocatalytic degradation of RhB on CoWO4/WO3or CuWO4/WO3is proposed, as shown in Figure 11. Due to the formation of heterojunction at the interface of MWO4/WO3samples, the photo-induced electrons of MWO4can transfer to WO3, and the photo-induced holes of WO3can transfer in the opposite direction, which can efficiently promote the photo-induced charges transfer and separation. Then, the electrons and holes can be transferred to take part in the reaction with absorbed species to form intermediate active species or final products. The intermediate active species can further react upon absorbed species to form final products.
When the loading amount of MWO4is 0.2%, the nanoscale MWO4particles are uniformly dispersed on the surface of WO3, resulting in a relatively highly contacted interface and short charge transport distance. This may be the main reason indicating why 0.2% MWO4/WO3samples exhibit the most excellent performance in the photocatalytic degradation of RhB.
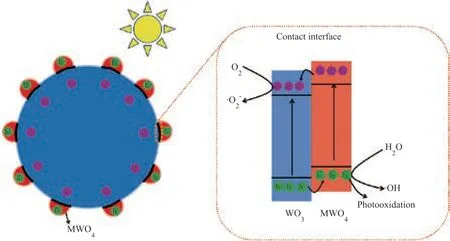
Figure 11 A possible scheme for the mechanism of the photocatalytic degradation of RhB
4 Conclusions
In summary, MWO4/WO3heterojunctions were successfully synthesized via the in-situ impregnation method followed by solid-state reaction. The results of photocatalytic degradation of RhB exhibited that all MWO4/WO3heterojunctions show superior photocatalytic performance as compared to the pristine WO3. Additionally, it is observed that the degradation efficiency of RhB over MWO4/WO3depends on the loading amount of MWO4on the surface of WO3. The 0.2% MWO4/WO3sample shows the most excellent photocatalytic performance among all the MWO4/WO3samples. Characterization and analysis results show that the enhanced activity is attributed to the formation of build-in electric fields at the interface between MWO4and WO3, which is in favor of the photo-induced charges separation and transfer. The reason on why 0.2% MWO4/WO3can show the most excellent performance is that the nanoscale MWO4particles are uniformly dispersed on the WO3surface, which can increase the effectively contacted interface and decrease the charges transport distance. These results can provide a guidance for the development of highly efficient WO3photocatalyst.
Acknowledgement:This work was supported financially by the National Natural Science Foundation of China (21573101), the Program for Liaoning Excellent Talents in University (LR2017011), the support plan for Distinguished Professor of Liaoning Province ([2015]153), and the Liaoning BaiQianWan Talents program ([2017]96).
杂志排行
中国炼油与石油化工的其它文章
- CoMnMgAl Hydrotalcite-like Compounds and their Complex Oxides: Facile Synthesis and FCC SOx Removal
- Effects of Blending Long-Chain Alcohols with Jet Fuel on the Macroscopic Spray Characteristics
- Effect of Zeolite 5A Particle Size on Its Performance for Adsorptive Separation of Ethylene/ Ethane
- Comparison on Adsorptive Separation of n-Paraffins Based on Binderless and Binder-containing Zeolite 5A Pellets
- Discussion on the Mechanism of Boric Acid and Phosphoric Acid to Improve the Hardening of Complex Calcium Lubricating Grease
- Effect of Doped Vanadium Dioxide on Oxidative Desulfurization Reaction
