Research on the Impact of New and Renewable Energy Replacing Fossil Energy Resource under Constraint of Carbon Emissions
2020-01-13ZhaoLixiangYangChuxiao
Zhao Lixiang; Yang Chuxiao
(Applied Economics Department, College of Economics & Management, Beijing Uniνersity of Technology, Beijing 100124)
Abstract: For studying new and renewable energy as a substitute for fossil energy in primary energy consumption and its impact on carbon emissions to cope with economic uncertainties, a multi-sector DSGE model was employed to simulate the dynamic impact on carbon emissions and macroeconomic development. The structural adjustment of energy consumption and the carbon emissions mitigation policy were considered in the model. The simulation results showed that using new and renewable energy instead of fossil energy is an optimal choice for the firms to comply with the regulations of carbon emission mitigation policy. Structural adjustment of energy consumption is the best route to achieve the dual goal of economic development and carbon emission reduction. Unexpected sharp fall in free carbon quota has a negative impact on the economy.
Key words: new and renewable energy; traditional fossil energy; energy substitution; carbon emission reduction
1 Introduction
Characterized by high-input, high-consumption, and high emissions, China’s extensive economic development mode, which is still in a transition stage to a certain extent, has caused energy wastage and misallocation of resources. Nowadays, China has become the world’s largest energy consumer to account for a 23% share of total global energy consumption. Fossil energy, represented by coal, petroleum, and natural gas, has accounted for 86.7% in primary energy consumption.The prediction of China’s primary energy structure by 2020 and 2035 is shown in Table 1.
Energy consumption consists of fossil energy and nonfossil energy. According to the forecast in BP World Energy Outlook (2018 edition), China’s energy demand growth will slow down to an average annual rate of 1.5% in the period of 2016—2040. The energy structure continues to evolve, with the proportion of coal falling from 62% in 2016 to 36% in 2040. China’s share of global energy demand rose from 23% in 2016 to 24% in 2040, accounting for 27% of global net growth. The proportion of natural gas has nearly doubled to 13%, and the share of renewable energy will increase from 3% in 2016 to 18% in 2040. The growth rate of change in oil demand and natural gas demand is 28% and 194%, respectively. Besides, renewable energy generation, nuclear power, and hydropower grow rapidly, with the growth rate of change equating to 789%, 574%, and 32%, respectively. Between 2016 and 2040, the average annual growth rate of nuclear power is 8%. And by 2040, China will account for 36% of global nuclear power generation, while the oil import dependence will grow to 72% in 2040 from the level of 67.4% in 2017. Natural gas import dependence will increase to 43% in 2040 from the current level of 34%. Renewable energy is expanding rapidly, growing at an average annual rate of 9.5% by 2040 to account for 31% of global renewable energy. In addition, the proportion of energy-related carbon emissions has increased to 70% in recent years. How to balance environmental protection and economic growth has become a critical issue in recent years.
Many academics argue for carbon emission reduction policies, among them, the carbon emissions trading scheme (CETS) has aroused great attention. The CETS is considered as an effective means of carbon emission reduction with its market orientation feature to minimize the greenhouse gas abatement cost. It is also considered to be a powerful way to reduce greenhouse gas emissions and improve the efficiency of resource use. Carbon trading mechanism will face some potential uncertainties in course of its implementation[1]. Some of the studies also suggested that industries covered by the carbon trading scheme are under great pressure to suffer too much impact, which may lead to high cost of emission reduction[2]. A unified understanding of the time, scope of action, and policy effects of the carbon trading scheme has not yet been formed.
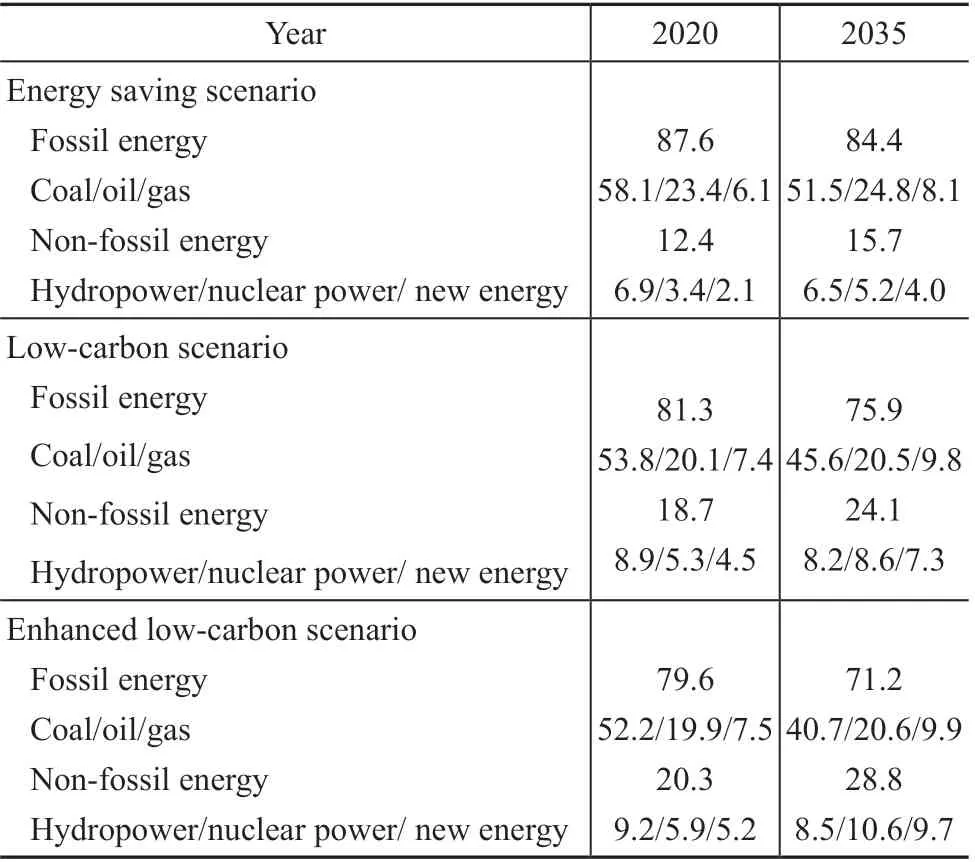
Table 1 China’s primary energy structure by 2020 and 2035 %
A body of techniques has been developed that now allows one to build quite complicated analysis framework named the dynamic stochastic general equilibrium (DSGE) model, which is the frontier of contemporary economic theory[3]. Despite the wide application of DSGE models which are used to examine the aggregate economic activity and macroeconomic policy, a few empirical exercises involving DSGE have been used to examine the effect of both the energy consumption structural adjustment and the environmental policies on aggregate economies, especially in China.
Although some researches[4-6]identified the impact of technology shock on aggregate economic activity with consideration of environmental policies, the efforts mainly represented the US economic fluctuation after the shock occurred, and none of these efforts were allowed for studying the different dynamic effects of environmental policy comparison or the energy consumption structural change effects. In addition, some of these studies assumed that carbon emission is proportional to the aggregate production.
To the best of our knowledge, energy consumption per unit of GDP is a key variable that must be considered in regard to carbon emission and aggregate production. Energy consumption per unit of GDP is a variable that is dependent on technology. We attempt to address this issue in our model. In addition, the energy consumption structure is a critical issue because low carbonization in energy use is an essential development trend for the future[7]. There has not yet been any research discussing this issue under a DSGE framework. Determining how to introduce adjustment of the energy consumption structure into a DSGE model to analyze environmental and carbon emissions is critical.
Therefore, this paper will introduce an energy substitution relationship into the framework of the DSGE model, while taking into account the multiple exogenous uncertainties and carbon emission policy constraints. In order to analyze the dynamic impact of energy consumption structural adjustment in line with the carbon emission reduction constraint, we have adopted the scenario comparison method. Compared to the existing literature reports, we adjust the setting of the carbon emission function, and the energy consumption per unit of GDP is considered as a variable constraint to technology. In addition, the role of energy consumption structural adjustment in carbon emission reduction is also considered by applying a more detailed division of energy use categories in production and numerical simulation.
2 Methods
In this paper, we develop and use a DSGE model with three sectors: the representative consumer, the government, and the final goods firms. To investigate the energy substitution effect on carbon emission reduction, the substitution rate achieved by new and renewable sources of energy is taking into consideration. A carbon emission function is employed to relate energy consumption to carbon emissions. This allows us to examine the effect of energy structural adjustment on the carbon emissions and the economy. In order to simplify the model, we only consider carbon emissions emanated from fossil energy combustion. Carbon emissions are related to the proportion of fossil energy input.
2.1 Households
A separable instantaneous logarithmic utility function,which assumes that there is a typical household sector with unlimited life span in the economy[3]is adopted in the model. Real business cycle model with indivisible labor[8]suggests that a representative consumer can earn income by supplying labor to the final goods firms and get utility through the enjoyment of consumption and leisure time. Representative consumer allocates one unit of time between work and leisure, each of them maximizes the expected value of an intertemporal utility function, which is given by:

where β is the discount factor, η is the relative preference for leisure time, Ctis the aggregate consumption, and Ltis the aggregate working time. Therefore, 1- Ltrepresents the leisure time. Since we focus on the business cycle implication of different environmental polies and technological progress, we assume a constant population and normalize it to one[5].
In each period, households’ budget constraint is given by Equation (2) to make both ends meet

in which wtis the wage level,is the rate of rent for capital, Itis the investment in period t and determines the stock of capital in the next period; in other words, we assume Ktto be predetermined. The accumulation equation of capital can be represented as

where δ is the rate of capital depreciation and δ∈(0,1).
The maximization of the utility function, which is subject to the resource budget constraint, yields the first-order conditions for consumption and working hours. The equilibrium conditions for households are given by

Equation (4) describes the labor-supply equation, which indicates that the optimal labor supply is related to the income rate and the aggregate consumption. Equation (5) describes the consumption intertemporal substitution relation, also referred to as the Euler equation of consumption, which indicates the optimal intertemporal consumption choice for a representative consumer.
2.2 Final goods
Energy is considered as an input in the production function, and carbon dioxide emissions related to fossil energy combustion is also taken into consideration. The final goods producers choose {Lt,Kt,Tt} to maximize their profit. Meanwhile, they should also pay for the carbon emission that is above the ceiling limits. Therefore, the profit function of producers is given by

in which πtis the profit, (EM)tis the total carbon emission,is a unit of carbon quota auction price, andrepresents the energy price per standard energy unit. According to the historical movements of energy price, we assume that it follows an autoregressive process, that is

Total output Ytis a function of capital stock Kt, labor Lt, and the energy consumption Et. Assuming that Ytis a constant-returns-to-scale Cobb-Douglas function expressed as follows[9]:

where the capital share of income is the value α, the labor supply share of income is the value γ, and the energy share of income is the value 1-α-γ. The technology shock Ztfollows the first-order autoregressive process expressed as follows[9]:

where Z¯>0 and -1<ρz<1. And the serially uncorrelated correlationis normally distributed with a mean zero and a standard deviation.
The fossil fuel energy combustion process releases CO2gas, which would accumulate in the atmosphere to raise the global average temperature. However, the new energy includes mainly the wind energy, the solar energy, the tidal energy, the biomass energy, etc. Biomass energy combustion may generate carbon dioxide, which does not add to the total carbon in the atmosphere because of the carbon cycle. Except for biomass energy, the new energy will not generate carbon emission during conversion. Therefore, we assumed that the use of new and renewable energy will not generate any carbon emission for the simplification of the model. Therefore the corresponding carbon emission factor will be zero. Energy consumption during production can be given by


2.3 Government
The CETS is a market trading system based on the GHG emission permits or credits. It is built to reduce the abatement costs for the enterprises[10]. It is noteworthy that whether the initial allocation of carbon quota is free will depend upon whether the government’s choice on allocation plan is grandfathering or benchmarking.
In October 2011, the Chinese government approved a pilot project of carbon emissions trading scheme in seven provinces and cities. After 6 years of experimentation, China implemented a comprehensive CETS on December 19th, 2017. The pilot cities that have implemented CETS mostly adopt the combination of free distribution and auction for initial quota allocation[11]. Therefore, we adopt this mixed allocation method in our model settings. In addition, the price of the European Union emission allowance (EUA) is related to the energy consumption structure[12]. It is assumed that the government collects and uses all the revenues from permits auction for carbon emissions mitigation and other related investment. Hence, the government budget constraint can be expressed as

where θ is the share of free carbon quota and Ptemis the carbon quota auction price, which obeys an AR(1) process.
2.4 Market clearing condition
It is assumed that there are infinitely identical final goods producers in the market and they cannot negotiate the price but accept it. The market is governed by perfect competition and any kind of adjustment cost or monopoly power does not exist. The market clearing condition is given by:

We linearize the equilibrium conditions around the steady state using the log-linearisation method[13], and conduct the impulse response simulation on the obtained linear equation with Dynare 4.5.1 software.
2.5 Parameter calibration and estimation
The nonlinear system of the equilibrium equations has no analytical solution. China’s primary energy consumption is mainly dependent on coal and crude oil. The energy input in the production process is converted according to the standard oil equivalent. And the Brent, West Texas, and Shanghai crude oil futures price is used as the original data of energy price for estimation of an exogenous energy price shock’s coefficient and standard deviation. According to the AR (1) process estimation results from EViews 8, the coefficient and standard error of carbon quota price shock are 0.996 and 0.01, respectively; and they are 0.997 and 0.005 for energy price shock, respectively. The data range of Brent crude oil futures price covered from May 28th, 2018 to May 12th, 2019. According to the Intergovernmental Panel on Climate Change (IPCC) recommended method, we calculate the carbon emission coefficient of fossil energy with weighted average of coal and crude oil. The fossil fuel energy data used in this paper is emanated from BP Statistical Review of World Energy 2018.
Among the literature reports involving environmental issues, the value of discount factor tends to be high, such as 0.97[14], and 0.95[5]. Therefore, upon referring to China’s nominal annual interest rate in recent years and the value range, the value of discount rate in this paper is set at 0.985. Under the circumstance of highly focusing on economic development and environmental protection, the representative agent tends to be relatively short-sighted in the preference of consumption and leisure. We set the parameter η to be 0.77[15].

Table 2 Calibrated parameter values and sources
All calibrated parameters for both carbon mitigation policies scenarios are displayed in Table 2. We solve the model by log-linearizing the steady state and analytically solving the system of linear rational expectations equations.
Although fossil energy includes multi-types of energy, among which the consumption of coal, petroleum, and natural gas accounts for the largest proportion of China’s total energy consumption. Therefore, this paper calculates the carbon emissions coefficient by applying a weighted value of carbon emissions from coal, petroleum, and natural gas. At the beginning of CETS, the free carbon quota will take prominent possession, then the auction of payment quota will gradually replace the free ones step by step in due time. In this paper, the proportion of free carbon quota is assumed to be 90% in the benchmark scenario based on successful experience in developed countries, and this proportion will be adjusted according to the implementation stage of the CETS.
3 Results and Discussion
Based on the above results of parameter calibration, we investigate the dynamic impact of carbon permit price shocks, energy price shocks, and technology shocks on carbon emissions and macroeconomic variables, while taking into consideration of new and renewable energy to substitute for the fossil energy. To investigate the policy effects in different launch stage, we simulate three different scenarios, viz.: the benchmark scenario, the mid-term scenario, and the long-term scenario. To simulate multiple scenarios, we assign different values according to historical and forecast data for key parameters, such as θ and ζ. The time mark of these scenarios is corresponding to EU-ETS and parameters are chosen according to “Bluebook of Petroleum 2018”. We set the benchmark scenario with θ = 0.95 and ζ = 0.15, denoting that the free carbon quota proportion is 95%, and the new and renewable energy substitution rate is 15%. According to EU-ETS stages, we set a mid-term scenario and a long-term scenario, with θ = 0.9, ζ = 0.288 and θ = 0.3, ζ = 0.40, respectively. Although natural gas was considered as the new energy from the perspective of clean energy in some literature, its emission source is the same as fossil energy. Hence, natural gas is included in fossil fuel energy in this paper, because we focus on carbon emissions.
All the impulse responses are reported as percentage deviations from the steady state of variables over a 100-quarterly period. We simulate three scenarios and the impulse response functions (IRFs) for each scenario, which is represented by different color. For example, the benchmark scenario, the mid-term scenario, and the long-term scenario correspond to blue curve (scenario 1), red curve(scenario 2), and yellow curve(scenario 3), respectively. Some of the variables would change insignificantly under different scenarios and the IRFs curves could overlap with each other. We focus on carbon emissions and energy substitution, and related variables show a difference under three scenarios and we do a comparison analysis in order to depict energy substitution’s effect on carbon emissions reduction and economy in different scenarios.
3.1 Environmental policy uncertainty
We simulate the effect of environmental policy uncertainty by simulating the effect of a positive carbon permit price shock on the economic system. Figure 1 represents the results of environmental policy uncertainty in three scenarios, viz.: the benchmark, the mid-term, and the long-term. All the impulse responses are reported as percentage deviations from the steady state over a 100-quarterly period.
When the economy is affected by a positive carbon permit price shock, most variables will negatively deviate from the steady state values. All of the variables show a slight difference between scenario 1 and scenario 2, and their impulse response curves are overlapping with each other. This fact indicates that with a soft constraint of CETS in the recent 10 or 15 years, the excessive proportion of free carbon quota fails to form the constraint of carbon emission reduction and has little impact on the economy. In scenario 3, with a low free carbon quota ratio and a high energy substitution rate in the long-term, most variables show a significant deviation at the beginning and gradually reach a convergence with steady state after 10 periods. This outcome indicates that CETS has a short duration of impact only.
Upon comparing with scenario 1 and scenario 2, the energy consumption and output will fall to 0.257% and 0.035%, respectively, in scenario 3, and will gradually attain a convergence with the steady state. This indicates that when a rise happens to carbon permit price, enterprises with emissions exceeding the free carbon quota need to pay more for carbon permit, which will lead to a fall in energy use for pursuing a maximum profit, especially in fossil energy use. This may lead to a fall in output, since the level of technology is not advanced enough for enterprises to increase the energy substitution rate in the benchmark scenario. The enterprises have to compress the output for cost-saving purposes under the limitation of carbon emissions.
In comparison to scenario 1 and scenario 2, the labor supply shows an increase in scenario 3. This indicates that enterprises choose to enlarge labor input and capital input under CETS constraint. And in order to maximize the intertemporal utility, representative consumers need to lift their consumption for more satisfaction. That is why the consumption has a positive trend after the shock.
With respect to carbon emissions and energy use, following a positive carbon permit price shock, the total energy consumption, carbon emissions, fossil energy use, and new energy and renewable energy use all trend down and gradually reach a steady-state. This implies that a positive carbon quota price shock may cause an increase in carbon quota price, leading to a cost increase due to excessive carbon emissions from the enterprise. The final goods sector is willingly to expand production scale to gain profit, resulting in a growth in labor supply and capital stock. Meanwhile, a raise in demand for input factors by the final goods sector may also lead to an increase in wages and capital rents. This also explains why the consumption raises after the shock.
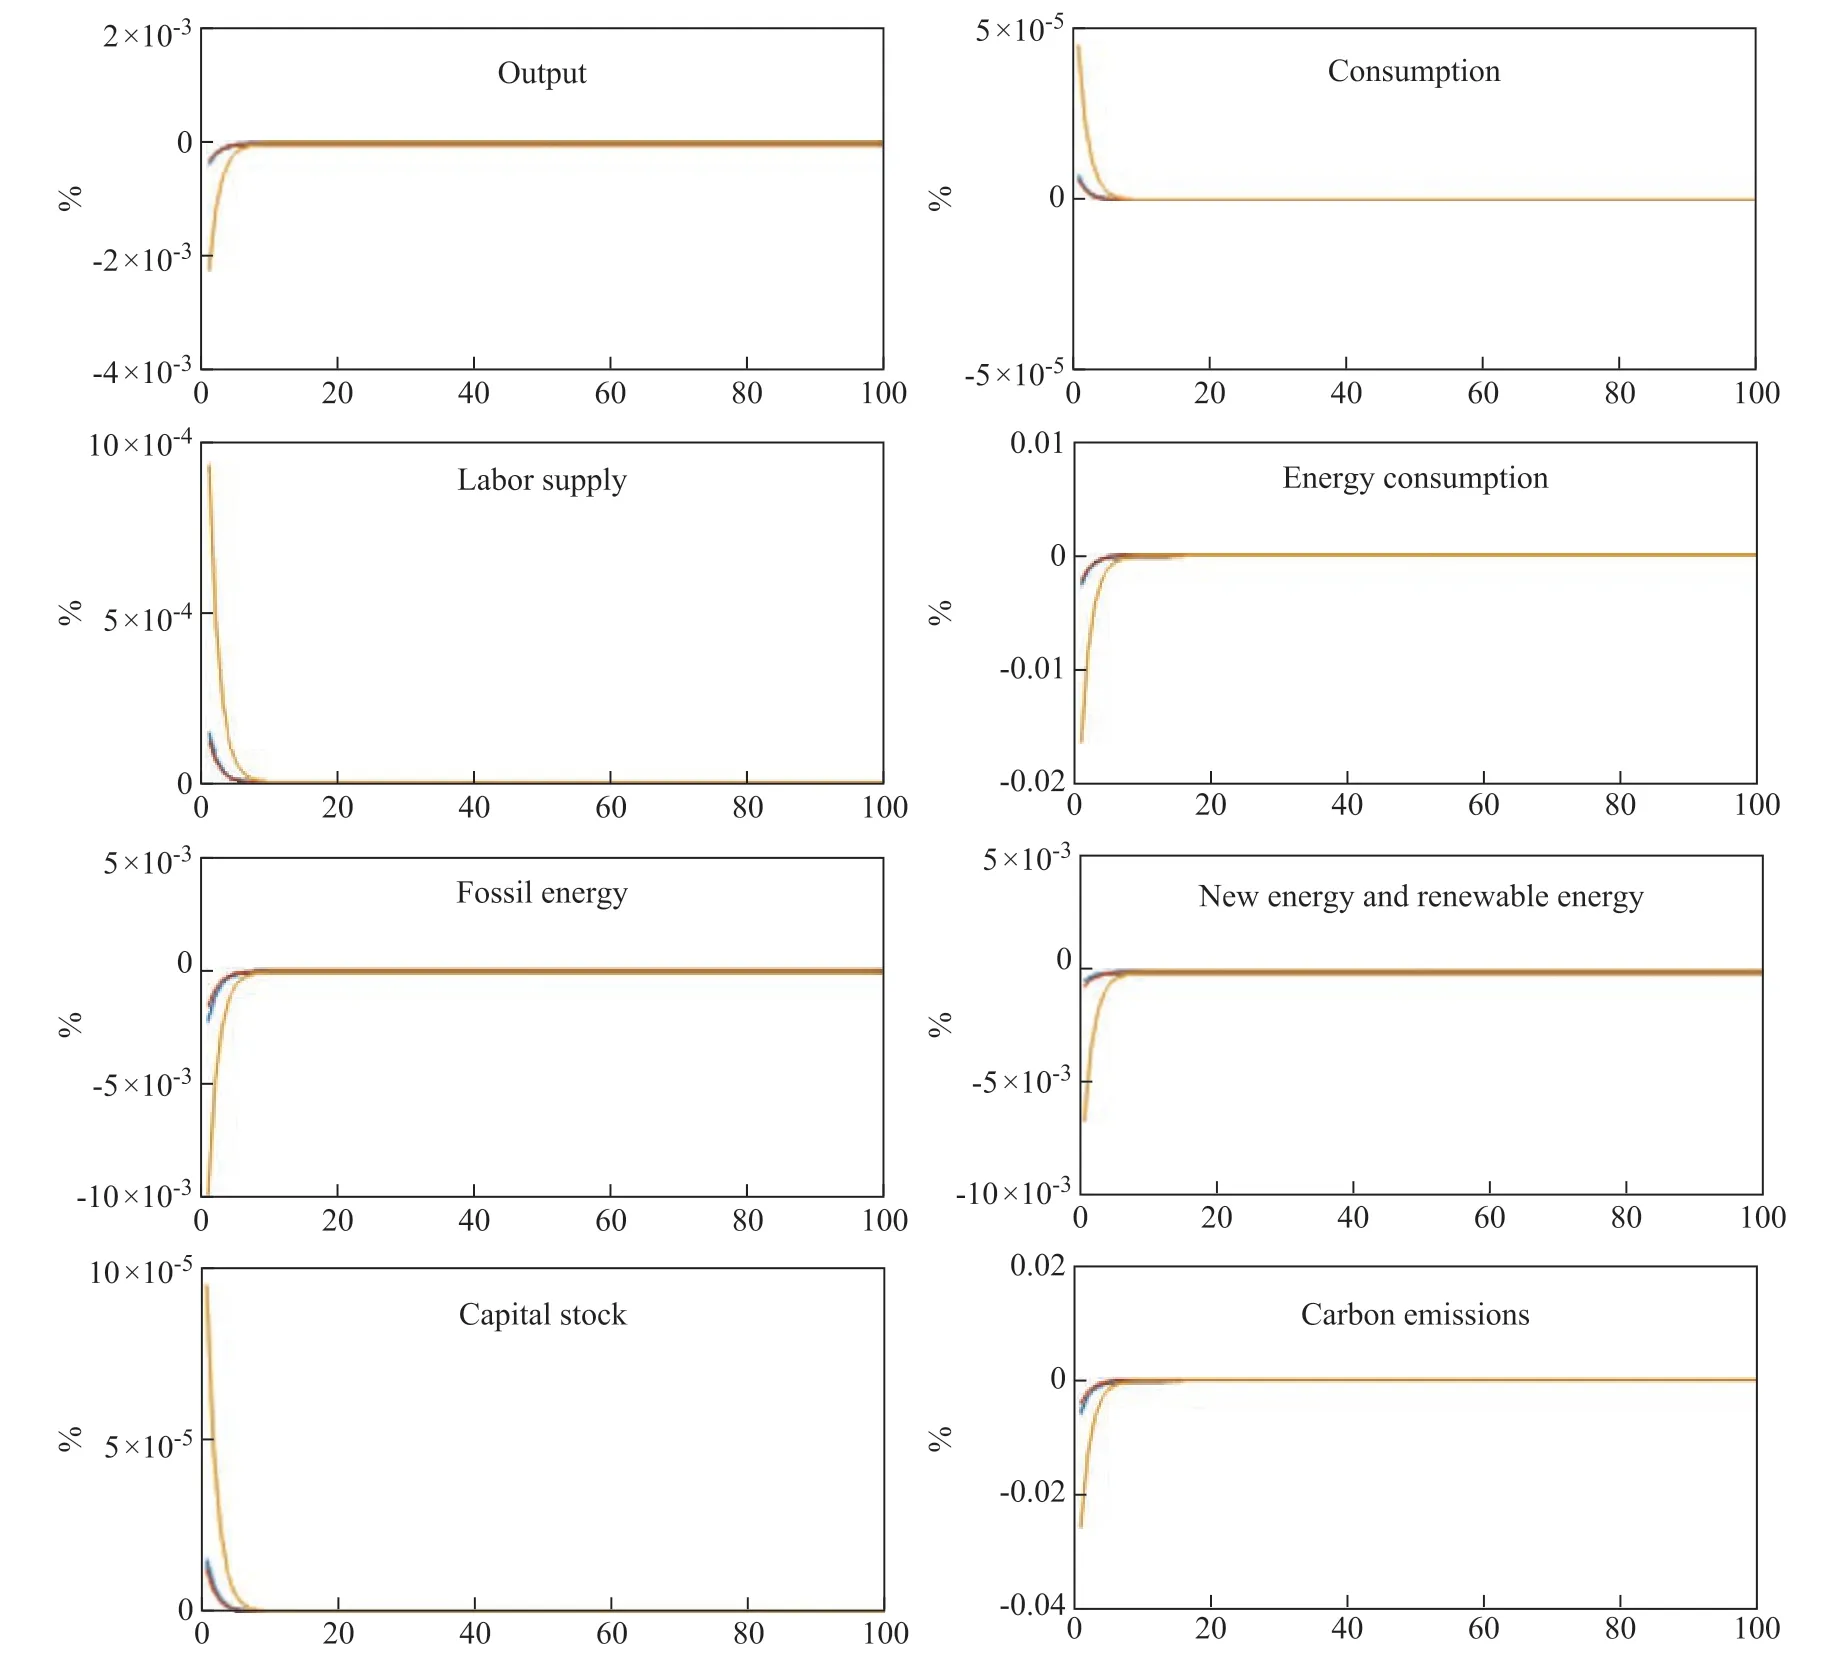
Figure 1 Impulse response of carbon quota price shock
3.2 Energy price uncertainty
The results of the impulse response of the main macroeconomic variables to an energy price shock in the three scenarios are displayed in Figure 2. More specifically, we simulate the effect of an energy price shock by exerting one unit positive impact of variable
Following the shock, the total output, energy consumption, and fossil energy use all react negatively, which stimulate the carbon emissions to fall in response to the shock. When the rise happens to energy price, especially with regard to international oil price, the total energy consumption will decrease. Fossil energy use would drop more in scenario 1 and this magnitude gradually falls in scenario 2 and scenario 3. However, the new and renewable energy use would fall slightly in scenario 1, and this magnitude is bigger in scenario 2 and would reach its trough in scenario 3. This is because when a rise happens to fossil energy price, the demand for fossil energy will fall and lead to a surge in non-fossil energy demand. Therefore, a rise will then happen to non-fossil energy price. That is why the new energy and renewable energy has a bigger decreasing trend in scenario 3 than scenario 1.
Figure 2 also shows that the total output will drop to 1.169% in response to energy price increase. In comparison to Figure 1, this magnitude is equal to only 0.0348%. Besides, the consumption shows a higher deviation with energy price shock than carbon quota price shock, indicating that energy price shock gives the economy more fluctuations than carbon quota price shock. Energy consumption always plays a significant role in carbon emissions and macroeconomic development.
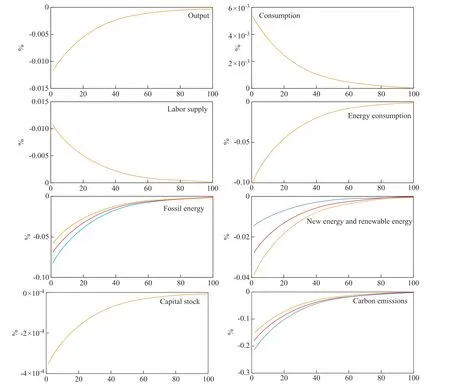
Figure 2 Impulse response of energy price shock
3.3 Technology shock
We simulate the effect of a technology shock by exerting onestandard-deviation impact of variable Zt. Figure 3 represents the results of technology uncertainty in three scenarios, viz.: the benchmark, the mid-term, and the long-term. All the impulse responses are reported as percentage deviations from the steady state of variables over a 100-quarterly period.
When the economy is affected by a positive technology shock, most variables react positively. Intuitively, the technology shock means an enhancement in productivity, which means that the enterprises can produce the same output with lower input. However, with the constraint of CETS, enterprises may choose to enlarge their production scale with an adjustment in input portfolio, for example by applying less fossil energy input but more labor and investment for profit maximization.
In scenario 2 and scenario 3, with a higher energy substitution rate, the enterprise can use more new and renewable energy instead of fossil ones. Higher demand in labor and investment will lead to a rise in wage and capital rent. Enterprises will adjust and optimize portfolio of input for profit maximization. According to the simulation result shown in Figure 3, the labor supply and capital stock show a negative reaction to technical progress. This may result in enterprise adjustment during production. And with the adoption of advanced technology, the energy consumption will rise by 0.6% and will gradually converge to steady-state values. In addition, with higher energy substitution rate, carbon emissions are lower in scenario 3 than in scenario 1. Enterprise will use more new energy and renewable energy and less fossil energy in scenario 3 as compared to scenario 1.
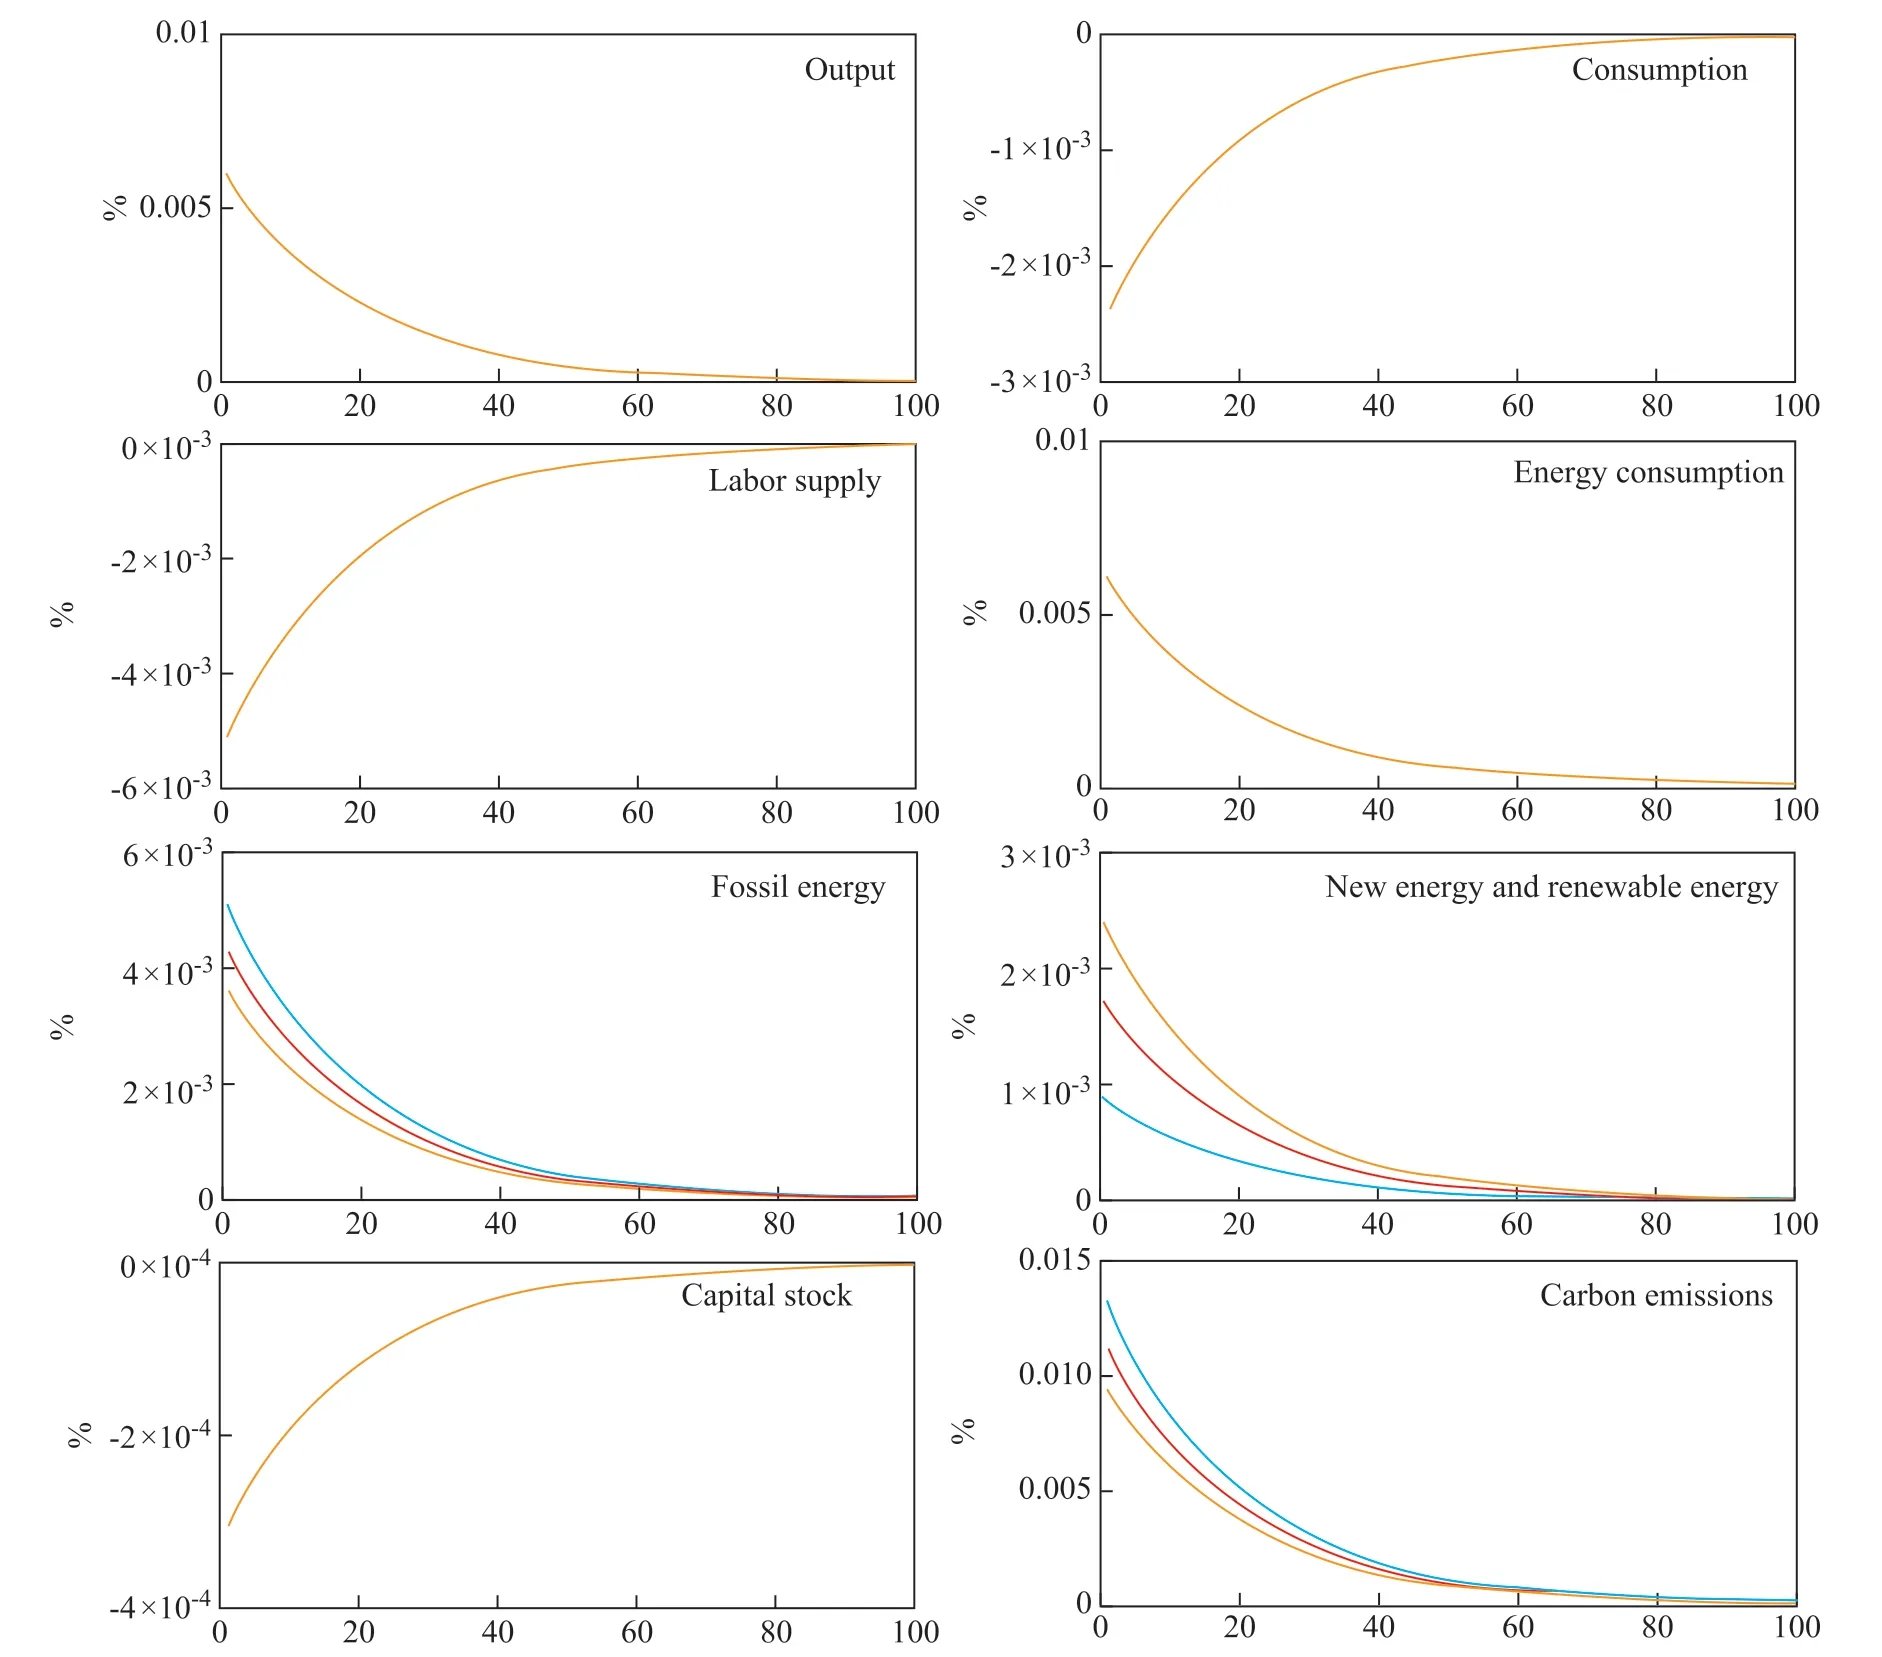
Figure 3 Impulse response of technology shock
4 Conclusions
In this paper, we construct a DSGE model under classical RBC framework embodying the environmental policy, new and renewable energy use, and energy substitution that are aimed to compare the dynamic impacts of energy consumption adjustment on the macroeconomic fluctuations and carbon emissions under conditions of technology uncertainty, energy price uncertainty, and carbon quota price uncertainty. The results of this paper indicate the following aspects.
Environmental policy has a negative impact on the economy. CETS has a relatively short duration of its impact, and different free carbon quota ratio does not affect the economy and carbon emissions a lot, unless there is a change in energy substitution. In addition, the excessive proportion of free carbon quota fails to form the constraint of carbon emission reduction and has little impact on the economy. The rearrangement of input portfolio is an optimized decision for enterprises to make for profit maximization under the carbon emissions constraint. For representative consumers, they will choose more consumption for utility maximization to balance the longer working hours.
A positive energy price shock will lead to a corresponding decrease in energy consumption, which can lead to falling carbon emissions. Carbon emissions will decrease less in longterm scenario (scenario 3), because the energy substitution rate is higher than it is in scenario 1. The total carbon emissions show a decreasing trend in all three scenarios, and the dynamic response shows that the energy price shock exerts a greater impact than the carbon quota price shock. This indicates that a rise in energy price has a bigger impact on carbon emissions than a rise in carbon quota price. The multi-scenario analysis and comparison under the energy price uncertainty have revealed that the more the energy use, the bigger the fluctuations which will happen in response to the shock. That is why the new energy and renewable energy decrease more in the long-term scenario (scenario 3) as compared to the benchmark scenario (scenario 1). And the fossil energy consumption shows opposite volatility that will decrease more in the benchmark scenario (scenario 1) as compared to the long-term scenario (scenario 3).
The results show that technology shock causes economic expansion. Intuitively, technical progress leads to an enhancement in productivity, which gives the enterprises an access to harvesting more output with less labor.
Besides, with production enlargement, capital stock is falling and investment is increasing. Output, energy consumption, and carbon emissions show an increase in response to the shock, even under the limitation of CETS. This indicates a rebound effect of carbon emissions and energy consumption under technical progress.
Therefore, to enable China to realize the goal of a lowcarbon economy and sustainable energy development, the government should implement various policies accordingly to provide support and subsidy so as to encourage enterprises to participate in the energy transformation process. Judging from the perspective of the short-term, the government should keep a high proportion of free initial carbon quota to motivate more and more enterprises to participate in the carbon trading market. Although this approach will lift the abatement cost, this movement will fit in the promises given by the government on the Paris Agreement of China’s Intended Nationally Determined Contributions (INDC). Besides, the unexpected falling in the share of free carbon quota may cause a dramatic impact on the economy. However, excessive free quota cannot restrain carbon emissions or motivate enterprises to substitute the new and renewable energy for the fossil energy use. Hence, how to balance the economic development and choose the suitable share of free carbon quota will become a critical issue for the policy-maker in the future.
Acknowledgements:The authors are grateful for the financial support from the National Natural Science Foundation of China (71473010, 41701635).
杂志排行
中国炼油与石油化工的其它文章
- Comparison on Adsorptive Separation of n-Paraffins Based on Binderless and Binder-containing Zeolite 5A Pellets
- Effect of Doped Vanadium Dioxide on Oxidative Desulfurization Reaction
- CoMnMgAl Hydrotalcite-like Compounds and their Complex Oxides: Facile Synthesis and FCC SOx Removal
- Boosting the Photocatalytic Activity of WO3 by Highly Dispersed CoWO4 or CuWO4
- Discussion on the Mechanism of Boric Acid and Phosphoric Acid to Improve the Hardening of Complex Calcium Lubricating Grease
- Effect of Zeolite 5A Particle Size on Its Performance for Adsorptive Separation of Ethylene/ Ethane
