Optimization management of hybrid energy source of fuel cell truck based on model predictive control using traffic light information
2019-12-09QiuyiGUOZhiguoZHAOPeihongSHENPeidongZHOU
Qiuyi GUO, Zhiguo ZHAO, Peihong SHEN, Peidong ZHOU
National Engineering Laboratory for Clean Energy Automotives and Powertrain Systems,School of Automotive Studies,Tongji University,Shanghai 201804,China
Abstract Energy optimization management can make fuel cell truck(FCT)power system more efficient,so as to improve vehicle fuel economy.When the structure of power source system and the torque distribution strategy are determined,the essence is to find the reasonable distribution of electric power between the fuel cell and other energy sources.The paper simulates the assistance of the intelligent transport system (ITS) and carries out the eco-velocity planning using the traffic signal light. On this basis,in order to further improve the energy efficiency of FCT, a model predictive control (MPC)-based energy source optimization management strategy is innovatively developed,which uses Dijkstra algorithm to achieve the minimization of equivalent hydrogen consumption. Under the scenarios of signalized intersections, based on the planned eco-velocity, the off-line simulation results show that the proposed MPC-based energy source management strategy(ESMS)can reduce hydrogen consumption of fuel cell up to 7% compared with the existing rule-based ESMS. Finally, the Hardware-in-the-Loop (HiL) simulation test is carried out to verify the effectiveness and real-time performance of the proposed MPC-based energy source optimization management strategy for the FCT based on eco-velocity planning with the assistance of traffic light information.
Keywords: Fuel cell truck,hybrid energy source management strategy,model predictive control,traffic light
1 Introduction
Hydrogen energy has enjoyed a growing popularity within the engineering industries because of the high energy efficiency, reliability and cleanliness. It is considered to be one of the most promising directions of development for future energy strategy [1]. In recent years,fuel cells have broad application prospects in the field of transportation [2]. Among various types of fuel cells,the proton exchange membrane fuel cell(PEMFC)is mainly being considered for automotive applications because of its high-power density, low operating temperature,longevity,and relative ability to rapidly adjust to power demand changes.However,at the same time,PEMFC has the disadvantages of soft power characteristics and slow dynamic response[3].The combination of fuel cells and other energy storage systems can effectively utilize the advantages of high-energy density,reversibility, and fast energy release capability, which can improve the power supply flexibility of the system and prolong the durability of the fuel cell[4,5].Typically,a fuel cell hybrid propulsion system consists of a fuel cell as the prime power source and a rechargeable battery or ultracapacitor as the secondary power source[6].
The energy management strategy (EMS) affects the overall performance of fuel cell vehicles(FCVs)and plays an important role in system development [7,8]. The main purpose of EMS in FCVs is to solve the problem of mechanical power demand of fuel cell hybrid system and decide the dynamic output power between different energy sources under driving cycles,while fulfilling particular design requirements[9].At present,EMSs can be divided mainly into two categories,the rule-based control strategies and the optimal control strategies[10,11].The rule-based EMS is relatively simple and has good real-time performance as well as relative great robustness. However, it cannot guarantee the portability and the potential energy improvement. It also requires an unnecessary effort to repeatedly adjust the model according to engineering experience [12]. The optimized EMS seeks the global or local optimal solution of the system by solving optimization problem of the cost function, thereby improving vehicle energy economy.Dynamic programming(DP)is one of the classic global optimization algorithms.However,it is difficult to be implemented for real-time control due to the exponentially increased computational complexity,also known as the“curse of dimensionality”.Faresa et al.proposed a twostage control strategy for FCVs, which first optimizes the control parameters off-line based on the weighted improved DP algorithm and then uses the stored lookup table for on-line optimization[13].For the real-time optimization control, Roddtz et al. proposed an original concept to convert the electrical power flow into equivalent hydrogen cost,and the previously developed equivalent consumption minimization strategy (ECMS)was used to determine the real-time optimal power distribution [14]. Model predictive control is used for optimization in the prediction horizon. It calculates a future control sequence that minimizes a performance index which reflects the optimization goals subject to the equations of the dynamic model of the system and to the constraints[15].To this day,MPC has been widely used in the development of EMS for the oil-electric hybrid electric vehicles and has proved its effectiveness and good on-line optimization effects[16-19].Guo et al.proposed a computationally effective EMS using MPC to find the energy optimal torque split,gear shift,and velocity control of a parallel hybrid electric vehicle(HEV)[17].Zhang and Shen presented an nonlinear MPC based on the continuation/generalized minimum residual algorithm for power-split plug-in hybrid electric vehicles(PHEVs)[18].Xie et al.proposed a MPC based on Pontryagin’s Minimum Principle (PMP) to develop a timeefficient online EMS for PHEVs, and demonstrated the computational efficiency of PMP-MPC through comparison of other widely used predictive EMSs under different preview horizons[19].However,for FCVs,there are few studies on the application of MPC-based EMS development[20,21].Zhao et al.proposed an MPC-based EMS for the FCV with the goal of improving energy economy and verified the real-time performance through HiL tests[21].Additionally,MPC-based EMSs are better able to contribute to improved fuel economy,for MPC offers a predictive scheme letting future driving information be incorporated into different EMSs.
With the rapid development of ITS and intelligent vehicle technology, the high-precision digital map, global positioning system (GPS) and vehicle-to-infrastructure(V2I)communication will soon be popularized,making it possible for vehicles to obtain the driving cycle information of a future time period.Developing EMSs based on future driving cycles or traffic information will further contribute to improving vehicle energy economy.Based on a preview of the traffic ahead provided by the telemetry,Kim et al.proposed a two-stage PMP approach for HEV model to develop a multivariable optimal controller which minimizes the fuel consumption over a finite length of traffic preview[22].The signalized intersection is an indispensable part of the urban road traffic environment and also one of the road sections with the highest fuel consumption for vehicles due to rapid acceleration and deceleration as well as idling. Planning eco-velocity in this scenario aims at bringing together the benefits of connecting vehicles and infrastructure to enhance roadway safety, reduce traffic congestion and so on. Rakha et al. developed a framework to enhance vehicle fuel consumption efficiency by providing the driver with an economic velocity when approaching a signalized intersection through the provision of traffic signal information that may be available through V2I communication[23].Under the assumption that the automobile receives traffic signal information from ITS,Yu et al. proposed an MPC-based control system for ecological driving of the hybrid vehicle using traffic signal and road slope information. And the simulation results showed that the fuel economy and the driving profile are optimized using the proposed approach[24].However,the above researches mainly focuses on oil-electric hybrid vehicles, the energy source characteristics of fuel cell hybrid vehicles make the power distribution rules between power sources somewhat different from the torque distribution strategies between power sources of common oil-electric hybrid systems. And few studies have combined future traffic information with the development of ESMSs for FCTs at present. If the information of future traffic provided by ITS is applied to the development of the ESMS for FCT, the MPC-based control strategy can be carried out in advance based on the predicted information, which can further improve the energy economy of the FCT.
In this study, a forward feedback simulation model of the power system is built for a certain concept FCT.Based on the simulated information of the ITS system,the eco-velocity through the traffic light is recommended for the truck.On this basis,in order to further improve the energy economy, a novel energy source optimization management strategy based on MPC for the FCT is proposed, and the Dijkstra algorithm is used for online calculation. And then the simulation comparison tests between the proposed MPC-based ESMS and the rule-based ESMS are carried out in different traffic signal scenarios. Finally, through the HiL simulation test,the effectiveness and real-time performance of the ecovelocity planning algorithm through the signalized intersection and the MPC-based optimization ESMS are verified.
2 Fuel cell truck powertrain model
The study takes the tri-axial FCT as research object,and its the configuration is shown in Fig.1. The energy source consists of three fuel cells and a battery which constitutes an auxiliary energy source.The driving components(power source)are six in-wheel motors that are evenly distributed on both sides of the three drive shafts.
The vehicle design parameters are shown in Table 1.
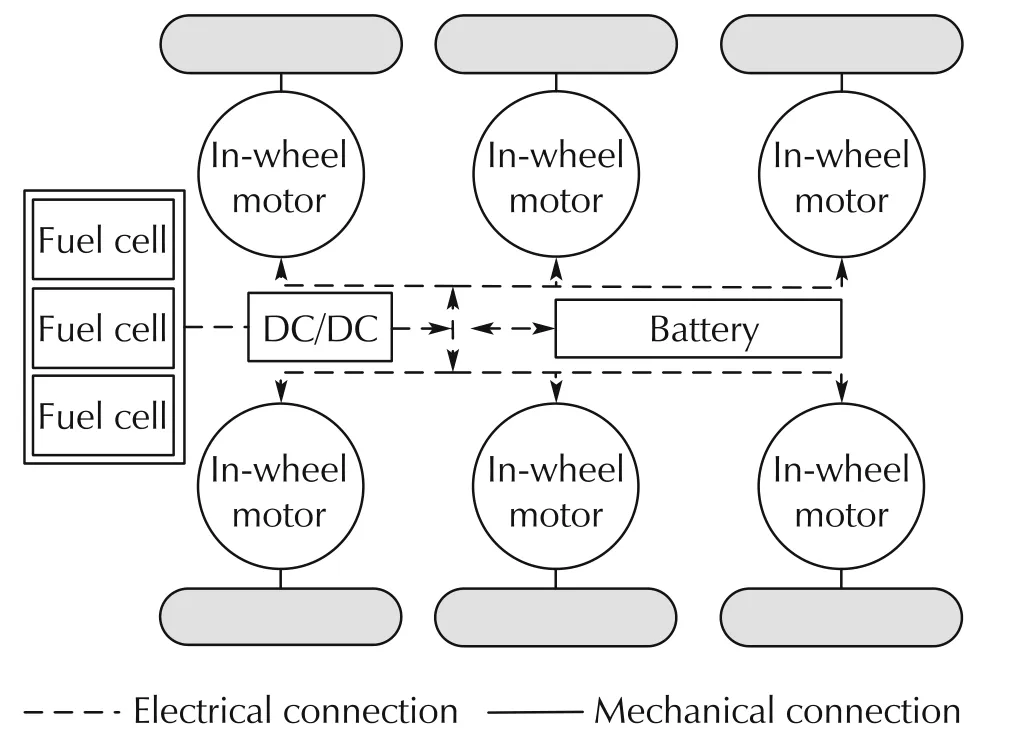
Fig.1 Fuel cell truck configuration.
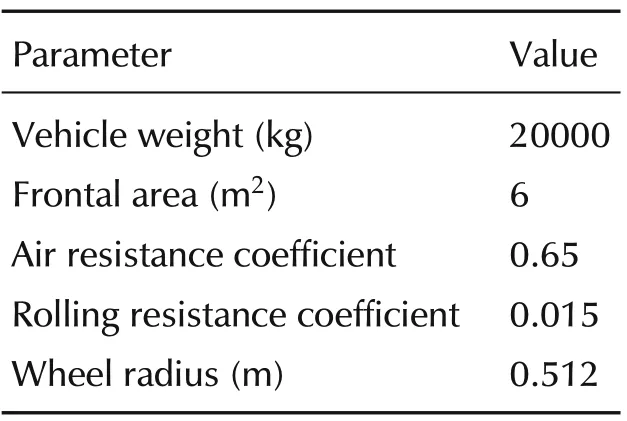
Table 1 The design parameters of the fuel cell truck.
The forward feedback simulation model of FCT is shown in Fig.2. Since the study critically focuses on the optimal distribution of electrical power between energy sources of the FCT, the established power component models (including PEMFC, DC/DC converter,power battery and the in-wheel motor) only have to accurately reflect their energy consumption characteristics. Therefore, the study mainly concerns the external characteristics of the power system components during modeling,and ignores their internal reaction process.
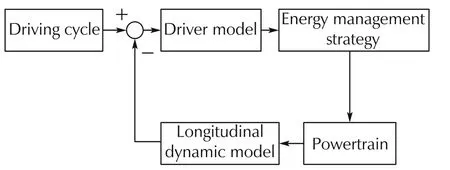
Fig. 2 Forward feedback simulation model structure of the FCT.
2.1 The PEMFC model
PEMFC is the main energy source of the FCT, which converts chemical energy into electrical energy through electrochemical reactions [6]. Based on the empirical model,the mathematical model is established based on the PEMFC voltage polarization characteristics[21].
The actual output voltage of the PEMFC cell Uois determined by theoretical ideal potential Enernstand the polarization voltage,as shown in equation(1),wherein the polarization voltage mainly includes the ohmic voltage drops Uohm, the activation overpotential Uact, and the concentration voltage drops Ucon.

A fuel cell with a rated power of 100 kW is selected in this study, and the volt-ampere characteristic of a single fuel cell stack is shown in Fig.3, while the system efficiency-power characteristic is shown in Fig.4. The specific parameters can be found in [21]. The PEMFC model is built using the fuel cell simulation module in Matlab/Simulink.Considering that the fuel cell reaction process is slower than that of the battery,in order to facilitate the power distribution,six commonly used fixed power values each at intervals of 20 kW within the range of 0 to 100 kW are selected as the fuel cell setting working points when studying the energy distribution strategy, as shown in Fig.4. The maximum power change rate limit of a single fuel cell in the model is set to be 3 kW/s based on experimental data.
Considering that the in-wheel motors are symmetrically arranged on the three drive shafts, to simplify the research,on the one hand,the torque distribution strategy of the total demand torque is equally distributed among the six motors. On the other hand, the power between the three fuel cell stacks adopts the principle of even distribution. That is, when studying the energy distribution strategy,the fuel cell power working points are selected as 0 kW,60 kW,120 kW,180 kW,240 kW,and 300 kW.
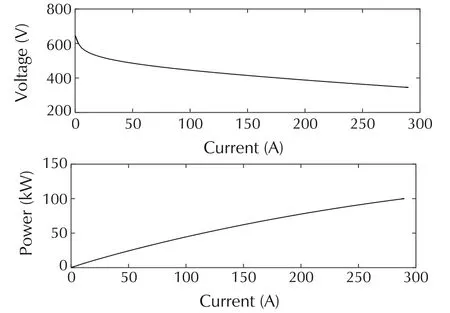
Fig.3 Volt-ampere characteristic curve of the fuel cell.
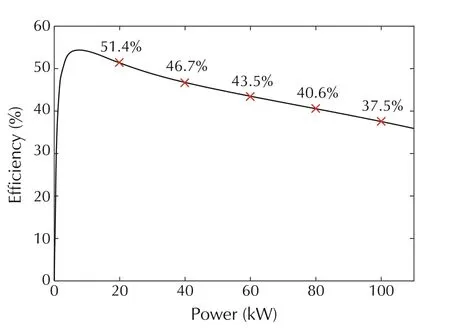
Fig.4 Efficiency characteristic curve of the fuel cell.
2.2 Lithium ion battery model
The Rint model,one of the most common equivalent circuit models, is used to establish the battery model,which is shown in Fig.5.In the diagram,Vocand Voare the open circuit voltage and the terminal voltage of the battery,while Rchgand Rdisare respectively the internal resistance of the battery when charging and discharging.
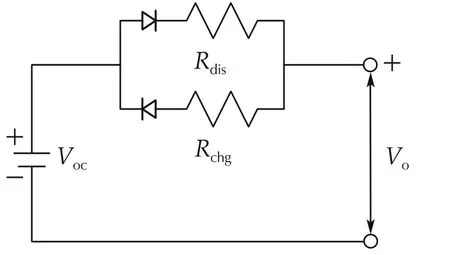
Fig.5 Battery equivalent circuit of Rint model.
When the required battery power Pbatis known, the Voand current of the battery Ioare calculated according to equations(2)and(3):

where Rintis the internal resistance of the battery, and is referred to Rdis, Rchgwhen discharging and charging respectively.
Equation (4) can be obtained by combining the two equations above.

The current battery SOC can be calculated using the ampere hour algorithm,shown in equation(5).
where SOCiniis the initial value of battery SOC,and Q is the battery capacity.
Since the working state and related parameters of the battery are related to the temperature of the battery T(t),the influence of the its internal temperature should be considered,as shown in equation(6).

where cpis the specific heat capacity,A is the total heat dissipation area of the battery, hcis the heat transfer coefficient of the battery cooling system, and Tais the ambient temperature.
2.3 The DC/DC converter model
The DC/DC converter serves to regulate and manage the output power in the fuel cell power system, and the efficiency characteristic curve of which is shown in Fig.6.The input-output power relationship at steady state is:

where Pdcdc,outand Pdcdc,inare the output and input power of the DC/DC converter, respectively, and ηdcdcis the efficiency of the DC/DC converter.
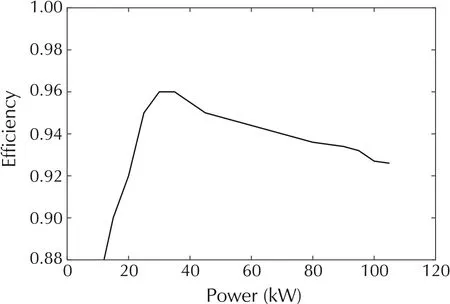
Fig.6 Efficiency characteristic curve of the DC/DC converter.
2.4 The in-wheel motor model
The efficiency characteristic field of the in-wheel motor is shown in Fig.7, and the reduction ratio of single motor is set to 2.5.
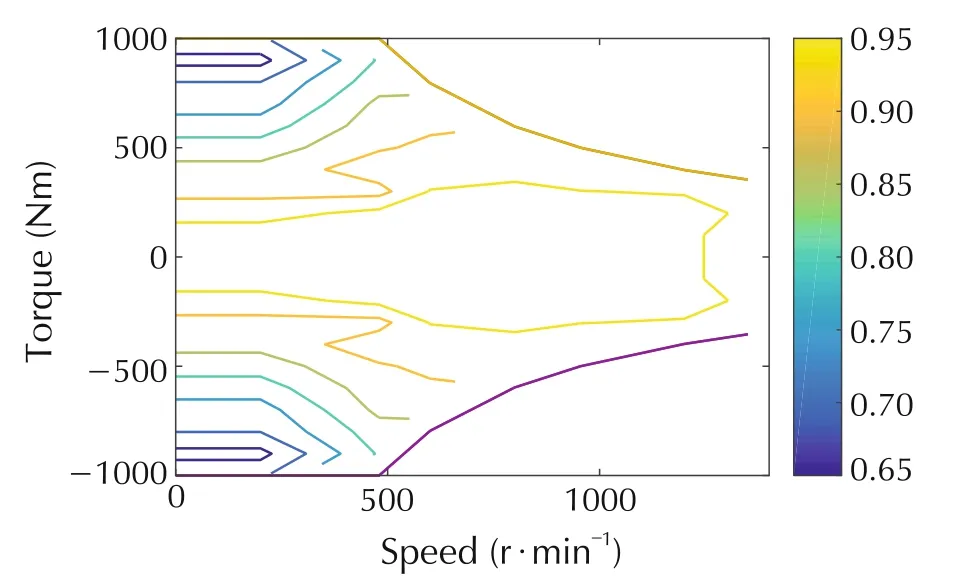
Fig.7 The in-wheel motor external characteristic field.
3 Eco-velocity planning based on traffic signal assistance
Signalized intersection system is one of the most commonly applied traffic systems in urban roads. Due to the influence of traffic signal lights, vehicles often have frequent start-stops or rapid acceleration and deceleration operations, which lead to increases in energy consumption.Studies have shown that by providing a wellplanned eco-velocity at signalized intersections,the vehicle economy can be effectively improved[23-25].The eco-velocity planning strategy based on the traffic light assistance is proposed with the help of the simulated ITS system.Based on traffic signal information provided by the ITS simulation system, the study proposes an eco-velocity planning strategy in the following, which aims to use the signal timing and phasing (SPaT) and other information to enable the FCT to drive through the signalized intersections at a more energy-efficient speed. Under the premise of obeying the traffic rules,the eco-velocity planning strategy should try to serve the following purposes: a) eliminate frequent or sharp acceleration/deceleration operations as much as possible;b)minimize the idling time at the traffic signals,and try to avoid stopping at a red light if feasible.
The strategy is mainly composed of two parts, scenario pre-analysis and eco-velocity planning algorithm.The scenario pre-analysis is used to decide what movements,such as acceleration and deceleration,the vehicle should perform in order to reach the intersection during the green phase of the signal light.The eco-velocity planning algorithm determines the specific vehicle speed curve for each scenario according to the result of the pre-analysis.
3.1 Scenario pre-analysis
Scenario pre-analysis determines the best possible plan to pass the target signalized intersections ecologically based on some key parameters,such as the SPaT,road speed limit and vehicle position,which can be provided by the ITS system through V2I communication and GPS.For the sake of convenience,the status of the signal light is divided into two types,green and red.Moreover,to ensure driving safety,the yellow light is attributed to the red light interval. The traffic light signal cycles are expressed as [],i = 1,2,3,..., wheredenotes the start of ith green window,whiledenotes the end of ith green window. An intuitive illustration of driving through the signalized intersection is given in Fig.8,which is the corresponding time-distance diagram. As is shown in the figure, the vertical axis represents the distance between the traffic light and the truck,and the horizontal axis represents time.
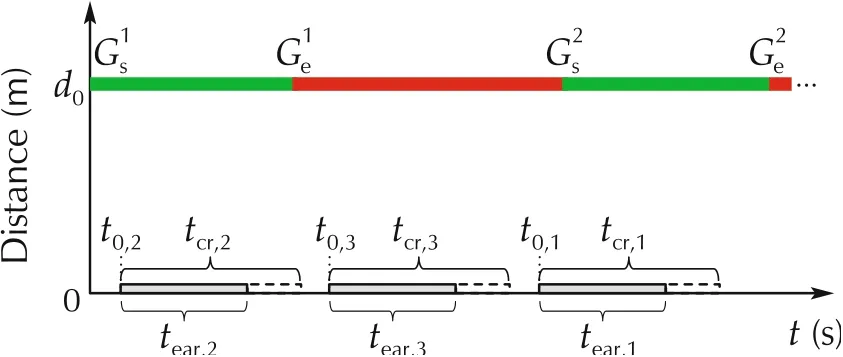
Fig. 8 The illustration of vehicle crossing signalized intersection.
Assuming there is no car in front or any queue effect at the intersections,the truck arrives d0at t0with a initial speed of v0. And d0is a predefined route distance between the vehicle and the traffic light stop-bar, as a matter of fact,the eco-velocity planning launched when the vehicle arrives d0.The possible arrival time of the vehicle falls into a range betweenand.tcris the cruise time to the arrival of the traffic light stopbar,and tearrepresnets the approximate earliest time to arrive at the traffic light stop-bar without breaking the road velocity limitation vlimit. To be more specific, the scenario can be divided into the following three cases.And these three scenarios are also illustrated in Fig.8,where t0,irepresents the arriving time at d0in scenario i,tcr,irepresnets the cruise time to the arrival of the traffic light stop-bar in scenario i, and tear,irepresnets the approximated earliest time to the arrival of the stop-bar in scenario i,where i=1,2,3 refers to each corresponding scenario.
1) Scenario 1 (’cruise’): when (t0+ tcr) ∈(],i = 1,2,3,..., the vehicle can cruise through the intersection at its current speed v0. In this case, in order to avoid unnecessary acceleration and deceleration,the vehicle continues to travel at v0to pass the traffic light.This case is shown in Fig.8 when the time of arriving at d0is t0= t0,1, and the time to arrive at the traffic light stop-bar is tarr=t0+tcr.
2) Scenario 2 (’acceleration’): when (t0+ tcr) ∈(], i = 1,2,3,..., the truck cannot pass the intersection at its current speed v0.If(t0+tear)∈(],i = 1,2,3,..., the truck will accelerate and manage to make it through the intersection within the green phase,which is represented by t0= t0,2in Fig.8. In this case,tarr=, which means the vehicle arrives at the traffic light at the end of the ith green light interval.
3) Scenario 3 (’deceleration’): when (t0+ tcr) and(t0+tear) both belong to (], i = 1,2,3,..., represented by t0,3= t0,3in Fig.8, the truck will actively decelerate to a lower speed and then pass the intersection when the traffic light turns green again.In this case,without compromising the time cost,let tarr=.
3.2 Eco-velocity planning algorithm
For the acceleration and deceleration scenarios defined above, the study plans the eco-velocity using the piecewise trigonometric function in [25]. While the expected speed is reached as soon as possible,the mathematical characteristics of the piecewise trigonometric function can ensure the smoothness of the vehicle speed curve,which guarantees driving comfort by limiting the jerk. Assuming v0= 40 km/h and d0= 200 m, when the vehicle reaches d0, different arriving time t0would cause differences in eco-velocity curves. For example,set green phase interval as 20 s and red phase interval as 25 s, and Fig.9 shows several cases of how the ecovelocity would be planned using the piecewise trigonometric function under different t0.
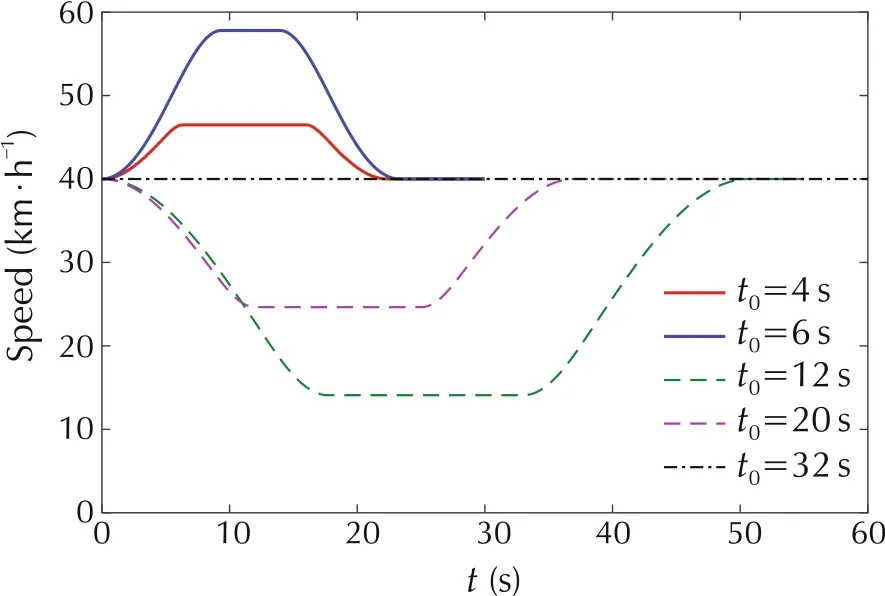
Fig. 9 Eco-velocity planning using the the piecewise trigonometric function.
4 Hybrid energy source management strategy for FCT
The following part first proposes a rule-based ESMS for the FCT,which is used as a standard basis compared to the optimized ESMS. Moreover, in order to improve the FCT energy economy, an MPC-based EMS is proposed,and the Dijkstra shortest path algorithm is used as an innovation to solve the optimal problem in this strategy.
4.1 The rule-based ESMS
The rule-based EMS mainly determines the operating state of the hybrid system based on the demand power Preqand the battery SOC during the driving process and finds the target output powers of the fuel cell Pfcand the battery Pbatby searching the energy distribution rules of the energy source, which are determined in advance.The proposed power distribution rules are shown in Table 2, where Pfc,eあis the efficient working point of fuel cell,set to 120 kW,Pfc,nearis the fuel cell power which is set to the nearest working point according to the current demand power; Pfc,maxis the maximum output power of fuel cell;and Pfc,minis the minimum output power of the battery.
4.2 The optimized ESMS based on MPC
An MPC-based ESMS for FCT is proposed in the following,which improves the energy economy by solving the energy optimization problem in a finite horizon at each time step.First,the power predictive model is established, and then the equivalent hydrogen consumption in the prediction horizon is considered in the optimal control problem.Finally,the Dijkstra shortest path algorithm is used to solve the optimization problem,and the optimized output power of the fuel cell is obtained.
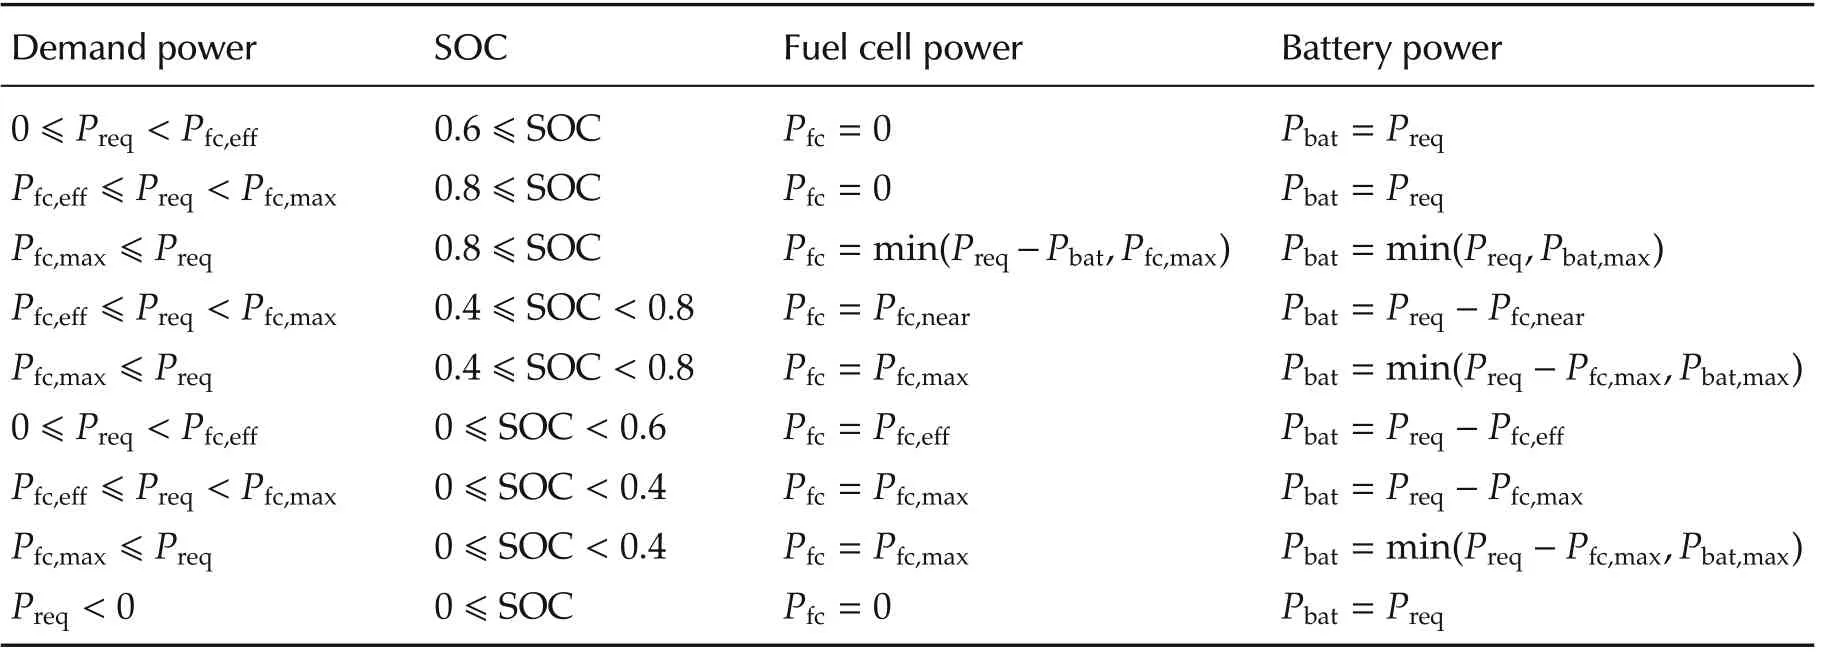
Table 2 The energy distribution rules of energy sources of rule-based ESMS.
4.2.1 Predictive model
According to the basic principle of MPC, based on the target eco-velocity planned in advance, the power predictive model is established according to the vehicle longitudinal dynamic model, and the predicted power of each step is obtained through equation (8). The information required for calculation can be obtained from the ITS system.

where Pprdt(t)is the predicted power at time t;Fslope(t)is the road slope resistance at time t; Ff(t) is the road rolling resistance; Facc(t) is the acceleration resistance;v(t)is the vehicle velocity at t;and Fair(t)is the air resistance.
4.2.2 Optimal control problem
For a conventional fuel cell power system,the battery is only an auxiliary energy source, acting as an energy buffer, and the fuel cell is the main source of energy.All the energy consumed by the entire system is ultimately derived from the chemical energy in the fuel hydrogen. In the following, the optimization objective function is established with reference to the equivalent hydrogen consumption in the hybrid vehicle ECMS strategy[14].Since the consumed battery power requires to be compensated by the power system burning a certain amount of hydrogen during the subsequent driving process, it is necessary to establish an equivalent relationship between the battery power and the fuel cell power consumed by the compensation process, so the equivalence factors(EFs)of charging and discharging are first discussed in the section. The equivalent hydrogen consumption is as shown in equation(9).

where ˙mtotal(t) is the total equivalent hydrogen consumption; ˙mfc(t) is the hydrogen consumption rate of the fuel cell;and ˙mbat(t)is the equivalent hydrogen consumption rate of the battery.
When the battery is discharging, the SOC is decreased,and in order to maintain the SOC balance,the fuel cell is required to charge the battery in the future.Also,the energy charged should be equal to the energy currently released by the battery. Based on the energy flow relationship of the hybrid power system,equations(10)and(11)are obtained,and the EF of discharging sdisis calculated through equation(12).
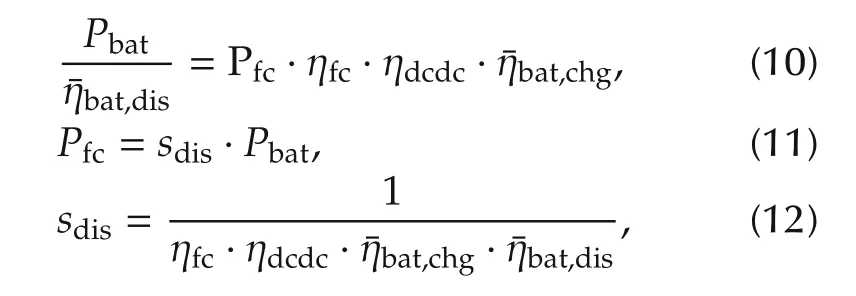
where Pbatis the motor demand power;are the average efficiency of battery charging and discharging;ηfcis the fuel cell efficiency;Pfcis the fuel cell output power;and ηdcdcis the efficiency of the DC/DC converter.
The battery SOC rises when the battery is charging.In order to maintain the SOC balance,the in-wheel motors will have to use the energy from the battery to drive the vehicle in the future.The amount of this energy is equivalent to the hydrogen consumption required for the fuel cell to output the same energy.According to equations(13)-(15),the EF of charging schgcan be obtained.

where Pbatis the power for charging the battery (from the fuel cell);Pfcis the fuel cell output power.
The hydrogen consumption rate is calculated based on the fuel cell output power in this study:


where LHVH2is the hydrogen low calorific value,and s represents the EF.
The control input is the output power of fuel cell u(t)=[Pfc(t)]. The state variable is the SOC of the battery x(t)=[SOC(t)],and the state equation is shown in equation (18), wherein the meanings of related parameters refer to the battery model in Section 2.2.

The objection function J is shown in equation (19).The current time is set as k, and the sum of the accumulated equivalent hydrogen consumptions of both the fuel cell and the battery in the prediction horizon is considered as the MPC optimization problem.

and let function L be

fsoc(t)is the SOC penalty factor[26],shown in equation(21).

where SOCtargetis the target SOC value; SOC is the current SOC value;a and b are both adjustment factors.
The inequality constraints shown in equation (23)must be enforced in the optimization process, in order to meet the physical limits of the FCT components.For the battery,the bounds on the SOC are limited to avoid overcharging and overdischarging. The minimum and maximum of SOC are chosen to 20%and 90%,respectively.For the fuel cell,because the markedly changing power has negative effect on the its performance, the power-changing rate should be limited for better fuel cell performance. And the maximum rate of the fuel cell power ΔPfc,maxis selected to be 3 kW/s. For any t ∈{k,k+1,...,k+Np-1}, the constraints are as follows.
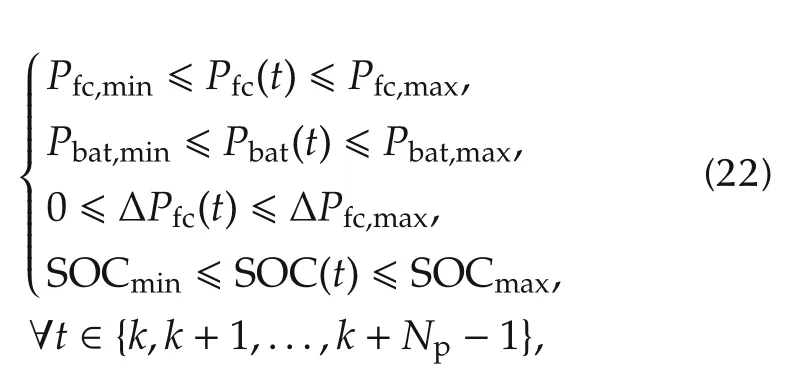
where Pfc,minand Pfc,maxdenote the minimum and maximum values of the fuel cell power; ΔPfc(t) = |Pfc(t)-Pfc(t-1)| refers to the power gradient of the fuel cell;Pbat,minand Pbat,maxare the minimum and maximum values of the battery power; SOCminand SOCmaxdenote the allowed lower and upper boundaries of the battery SOC,respectively.
4.2.3 Dijkstra based optimization algorithm
The Dijkstra algorithm was proposed by the Dutch computer scientist Dijkstra in 1959 and has been one of the most popular and widely used shortest path finding algorithms for all arcs with weights[27].The algorithm uses greedy algorithm skills and selects the local optimal solution at each step,expecting to achieve a global optimal solution.And the shortest path does not only refer to the shortest distance in general.The shortest time and lowest cost can also be extended to the shortest path.
The classic Dijkstra algorithm flow chart is shown in Fig.10.
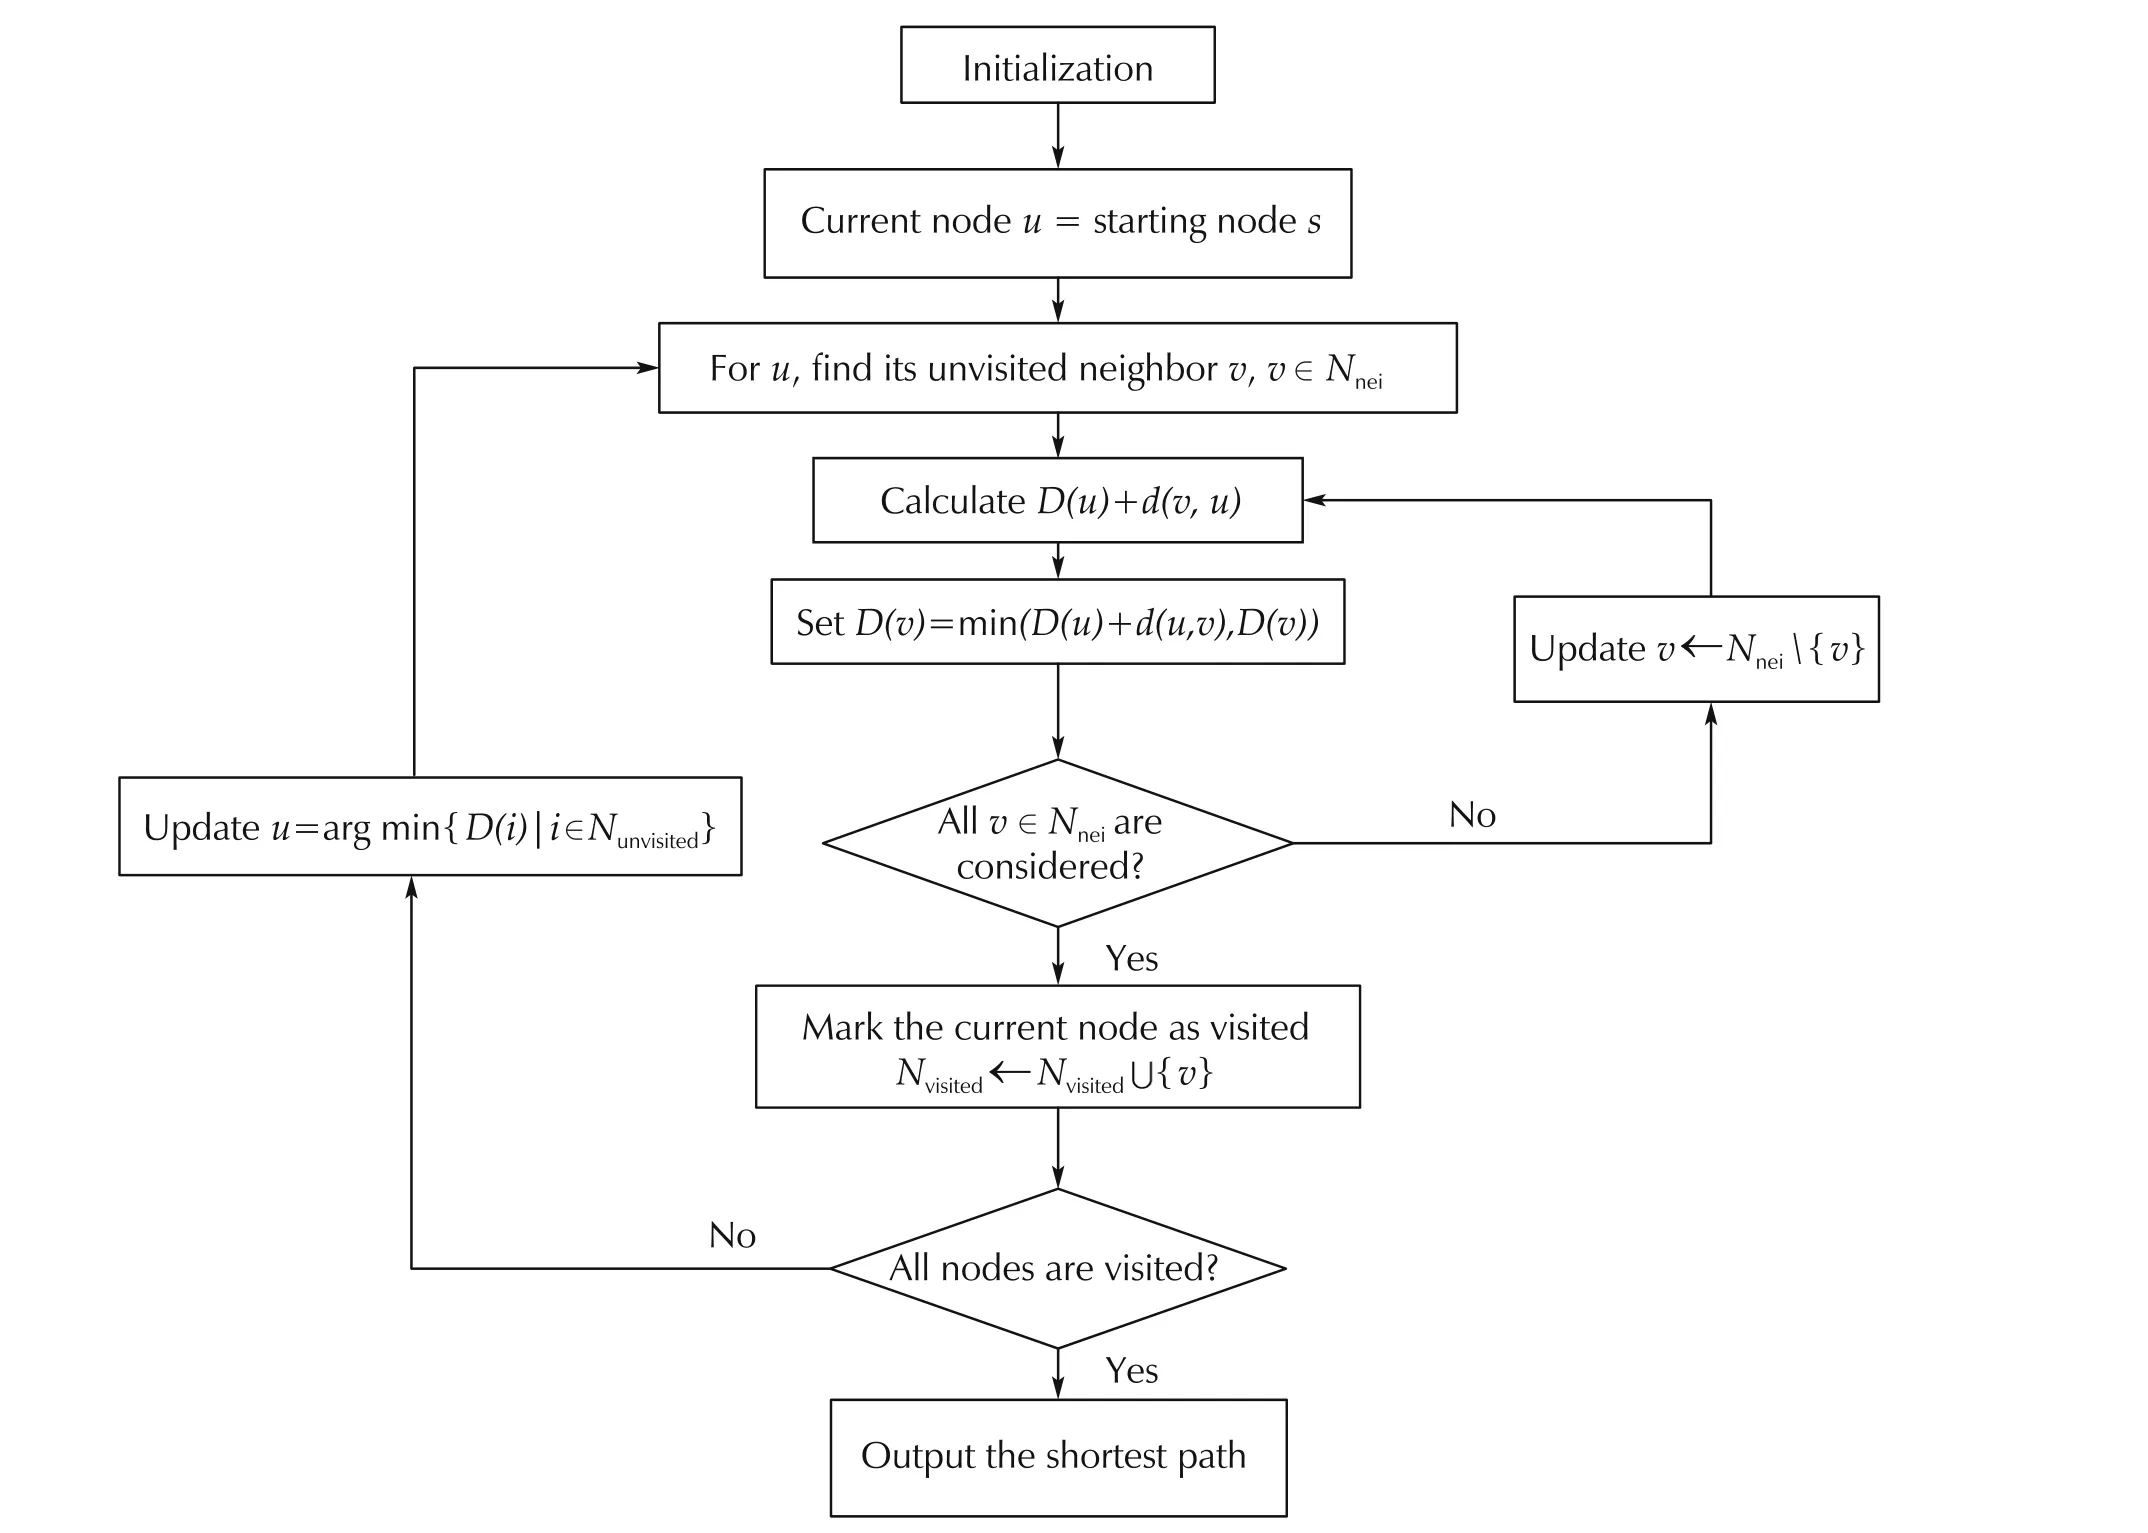
Fig.10 Flow chart of the Dijkstra algorithm.
First,the nodes in the network are divided into three parts: unvisited node set Nvisited, temporary marked node set and visited node set Nvisited, and the shortest distance values from all other nodes to the starting node s are set to infinity. At the beginning of the algorithm,the starting point s is initialized to be the current node u,and the rest belong to Nvisited.For each current node u,search for the temporary node v from its unvisited neighbors nodes set Nneiand calculate the tentative distance D(v)through the current node u.Compare the newly tentative distance to the current assigned value and assign the smaller one, and d(u,v) represents the direct distance from node u to node v.When all nodes in Nneiare searched, mark the current node u as visited Nvisitedand remove it from Nvisited.Update the new“current node”u with the smallest distance one among Nvisited. Repeat the above steps until all nodes are visited. Finally, the shortest path from the starting node s to an ending node can be obtained.
Assume a virtual starting node 1 and a virtual ending node n, each working point of the fuel cell is taken as a node described in the above algorithm, as shown in Fig.11,where 2 ~(n-1)represents the power working point of the fuel cell at different time steps respectively andrepresents the road weight from the last node to the ith point at k step. In order to prevent the dramatic change between two fuel cell power values,only changes between two adjacent power working points are allowed. To this end, the MPC optimization problem,which is to solve the minimum value of the accumulated equivalent hydrogen consumption in the predicted horizon Np, can be converted into finding the shortest path from the starting point 1 to the ending point n.If the exhaustive method is used to find the shortest path, there would be c possibilities for each step (c is a constant, representing the possible fuel cell working points)and a total of cNpcalculation times in prediction horizon Np, which means the algorithm complexity is O(cn). However, the algorithm complexity of Dijkstra’s shortest path algorithm is O(n2)[27]and thus improves the computational efficiency.
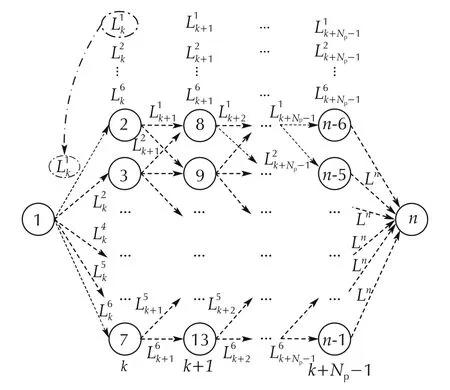
Fig.11 The illustration of solving optimization objectives using Dijkstra.
4.2.4 The MPC based energy source distribution optimization strategy
The mentioned Dijkstra algorithm is used to solve the optimization problem in MPC,and the obtained optimal result is used as the control variable in the energy source power distribution, so as to reduce the equivalent hydrogen consumption of FCT and improve the energy economy.Based on the information provided by the ITS system, the overall process of the MPC based EMS of FCT is shown in Fig.12.First,the continuous time is discretized.Set the current time as k,and the control variable ukis the fuel cell output power.Based on the information provided by the ITS system and the well-planned eco-velocity described in Section 3, the power predictive model,according to equation(8)in Section 4.2.1,is used to obtain the predicted demand power sequencein the predicted horizon Np.For the total demand powersince the fuel cell works at six power points,it generates six power combinations with the battery, where j represents the fuel cell working point sequence number, andIn order to reduce the computation online, the study firstly calculates the output power of each fuel cell working point Pfcand its corresponding battery power Pbat, and obtainsoffline, using equations (12), (15)-(17),with the required power ranging from 0 to 400 kW at 5 kW intervals,and stores them into MAP.Fig.13 is the instantaneous equivalent hydrogen consumptionMAP of the battery.On this basis,when solving online,this strategy only need to find the corresponding combinations according to the MAP,and use the equation(21)to calculate the current fsoconline, and then the function{|j = 1,2,...,6}according to equation(20)can be obtained,andrepresents the function calculated by the power combination of the jth fuel cell working point of the k+i step.By repeating the above steps,each corresponding function{|i=0,1,...,Np-1,j=1,2,...,6},which is the road weight between the nodes shown in Fig. 11, in the prediction horizon Npcan be obtained. And then, the shortest path from the starting node 1 to the ending point n is calculated, and the sequenceis obtained using the Dijkstra algorithm,shown in Fig.12, where i = 0,1,...,Np-1. The optimal sequenceis obtained, and the first element of the computed optimal control sequence is applied to the target system.That is,is selected as the current fuel cell output power,and the corresponding battery output power is calculated and then all applied to the vehicle model.
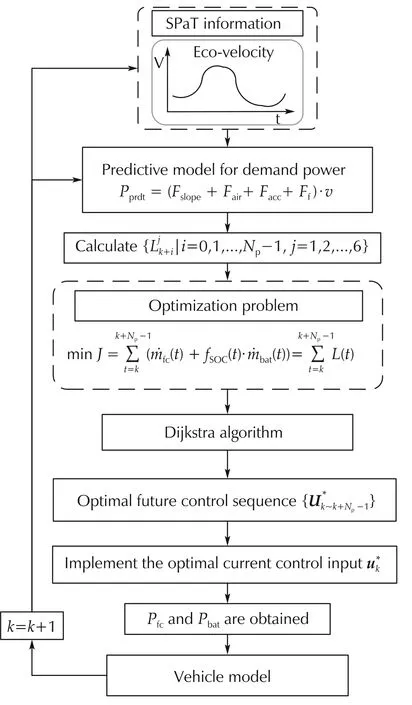
Fig.12 The optimized ESMS based on MPC for the FCT.
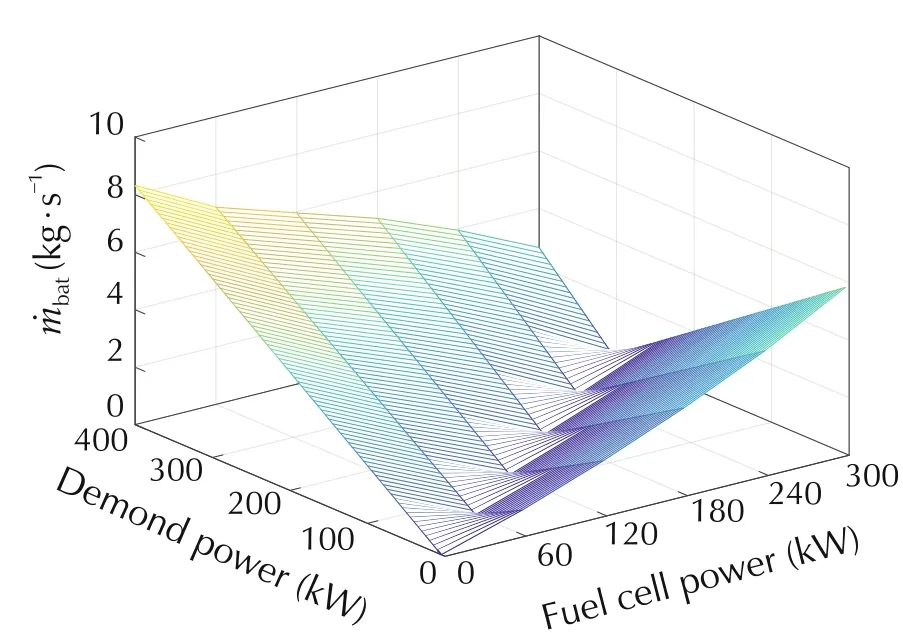
Fig.13 The instantaneous equivalent hydrogen consumption ˙mbat MAP.
5 Off-line simulation and results analysis
The control strategy and the fuel cell truck powertrain simulation model are constructed on the Matlab/Simulink platform. Based on the eco-velocity planning of traffic signal lights,the MPC-based energy source optimization management strategy for FCT is tested and compared with the rule-based ESMS.The test scenario is that the vehicle passes two traffic signal lights in succession.In the first scene,the time when the vehicle arrives at d0=200 m before the first traffic light is t0=5 s,and the time of it arriving at d0= 200 m before the second traffic light is t0=6 s,which stands for the acceleration scenario. And in the second scene, let the first arriving time be t0= 5 s, and the second be t0= 12 s, which is a deceleration scenario.And the SPaT information is set to the same as in Section 3.2.In the MPC controller,the sampling time is 0.05 s,and the prediction time horizon is Np=5.The comparative results of two test scenarios are shown in Figs.14 and 15.At the first traffic signal,as for the MPC strategy, the fuel cell starts first, which is shown in Figs.14(b)and 15(b).In the rule-based strategy, the fuel cell is mainly operated at a larger power,which has a relatively lower efficiency.However,in the MPC based strategy,the fuel cell attempts to work at a comparatively high efficiency working point. It can be seen that different power distributions have a remarkable impact on the overall efficiency of the system, resulting in the difference in hydrogen consumptions as shown in Figs. 14(c)and 15(c).Because the MPC based ESMS optimizes the equivalent hydrogen consumption in the prediction horizon, the power distribution between two energy sources takes into account the optimal hydrogen consumption of the system, so as to improve the energy economy of the FCT.
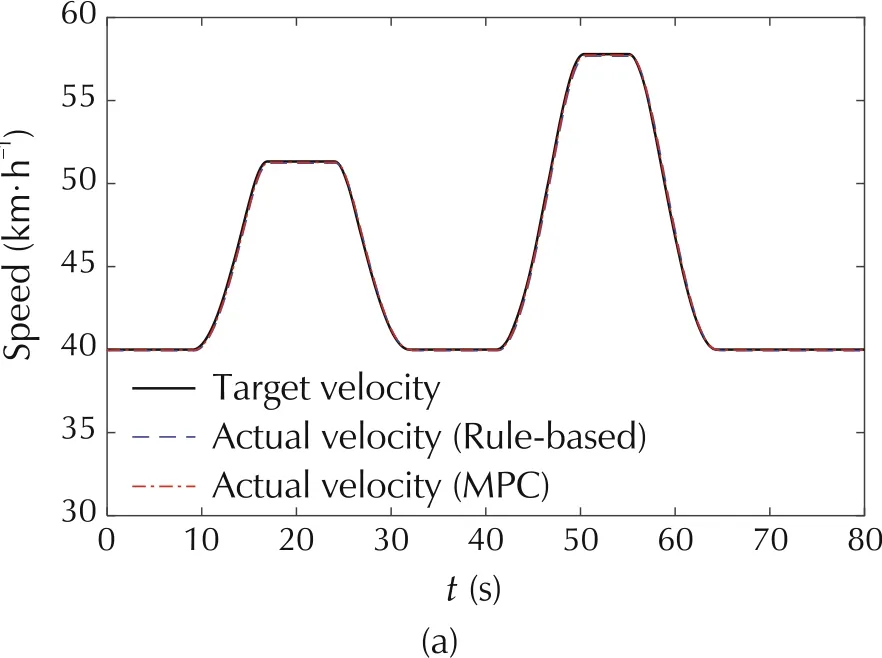
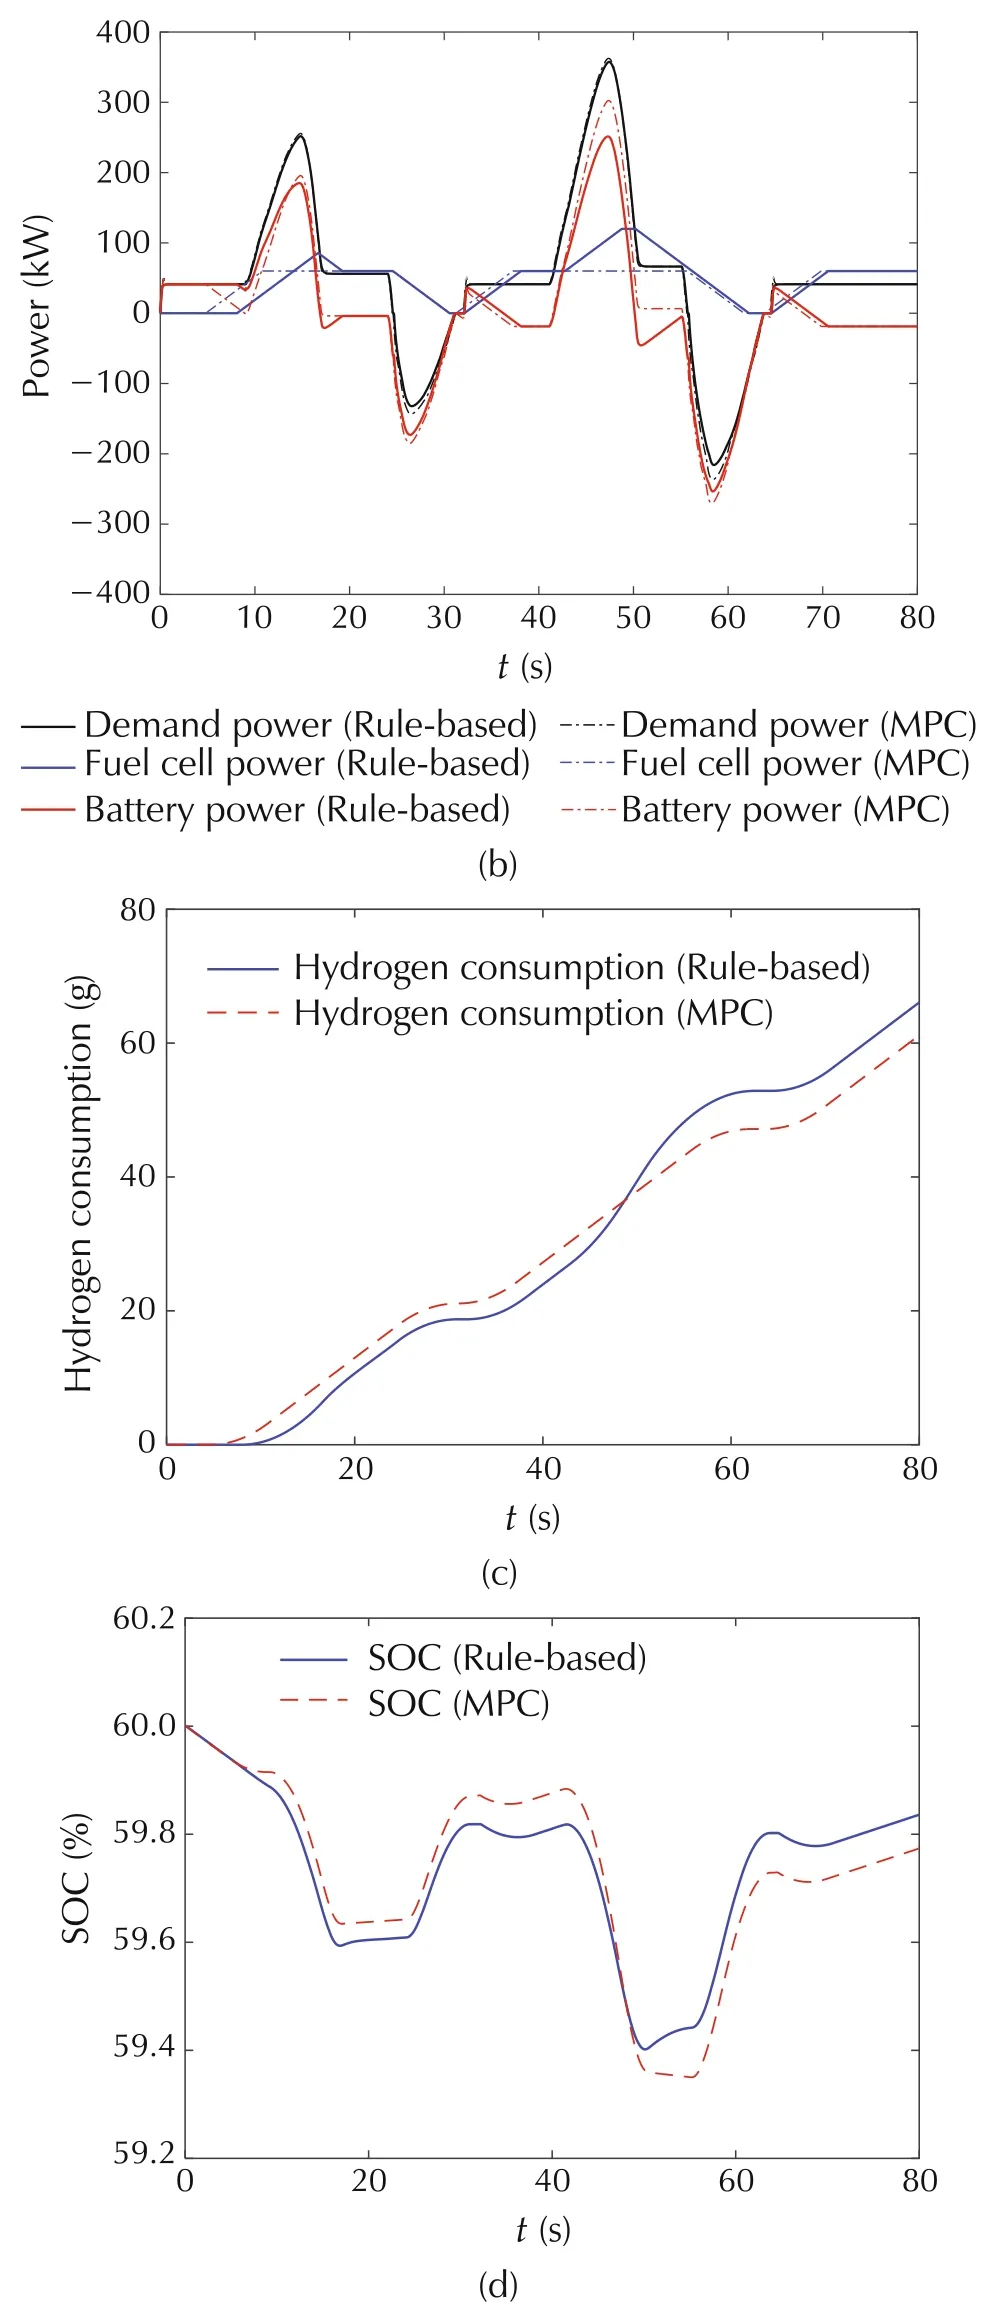
Fig.14 Simulation results of two ESMSs for the FCT(test scenario 1). (a) Velocity. (b) Power. (c) Hydrogen consumption.(d)SOC.
The simulation results of two ESMSs of FCT are shown in Table 3.Both strategies can maintain the SOC balance with a deviation less than 1%. Compared to the rulebased energy management strategy,the MPC based energy source optimization management strategy reduces the hydrogen consumption by 7.43% in the first test scenario and 11.92% in the second scenario, respectively.Please note that even in the same road scene,the differences of the traffic light state and time will lead to different energy saving effectiveness,but overall,the MPC-based ESMS can effectively improve the energy economy of the FCT.
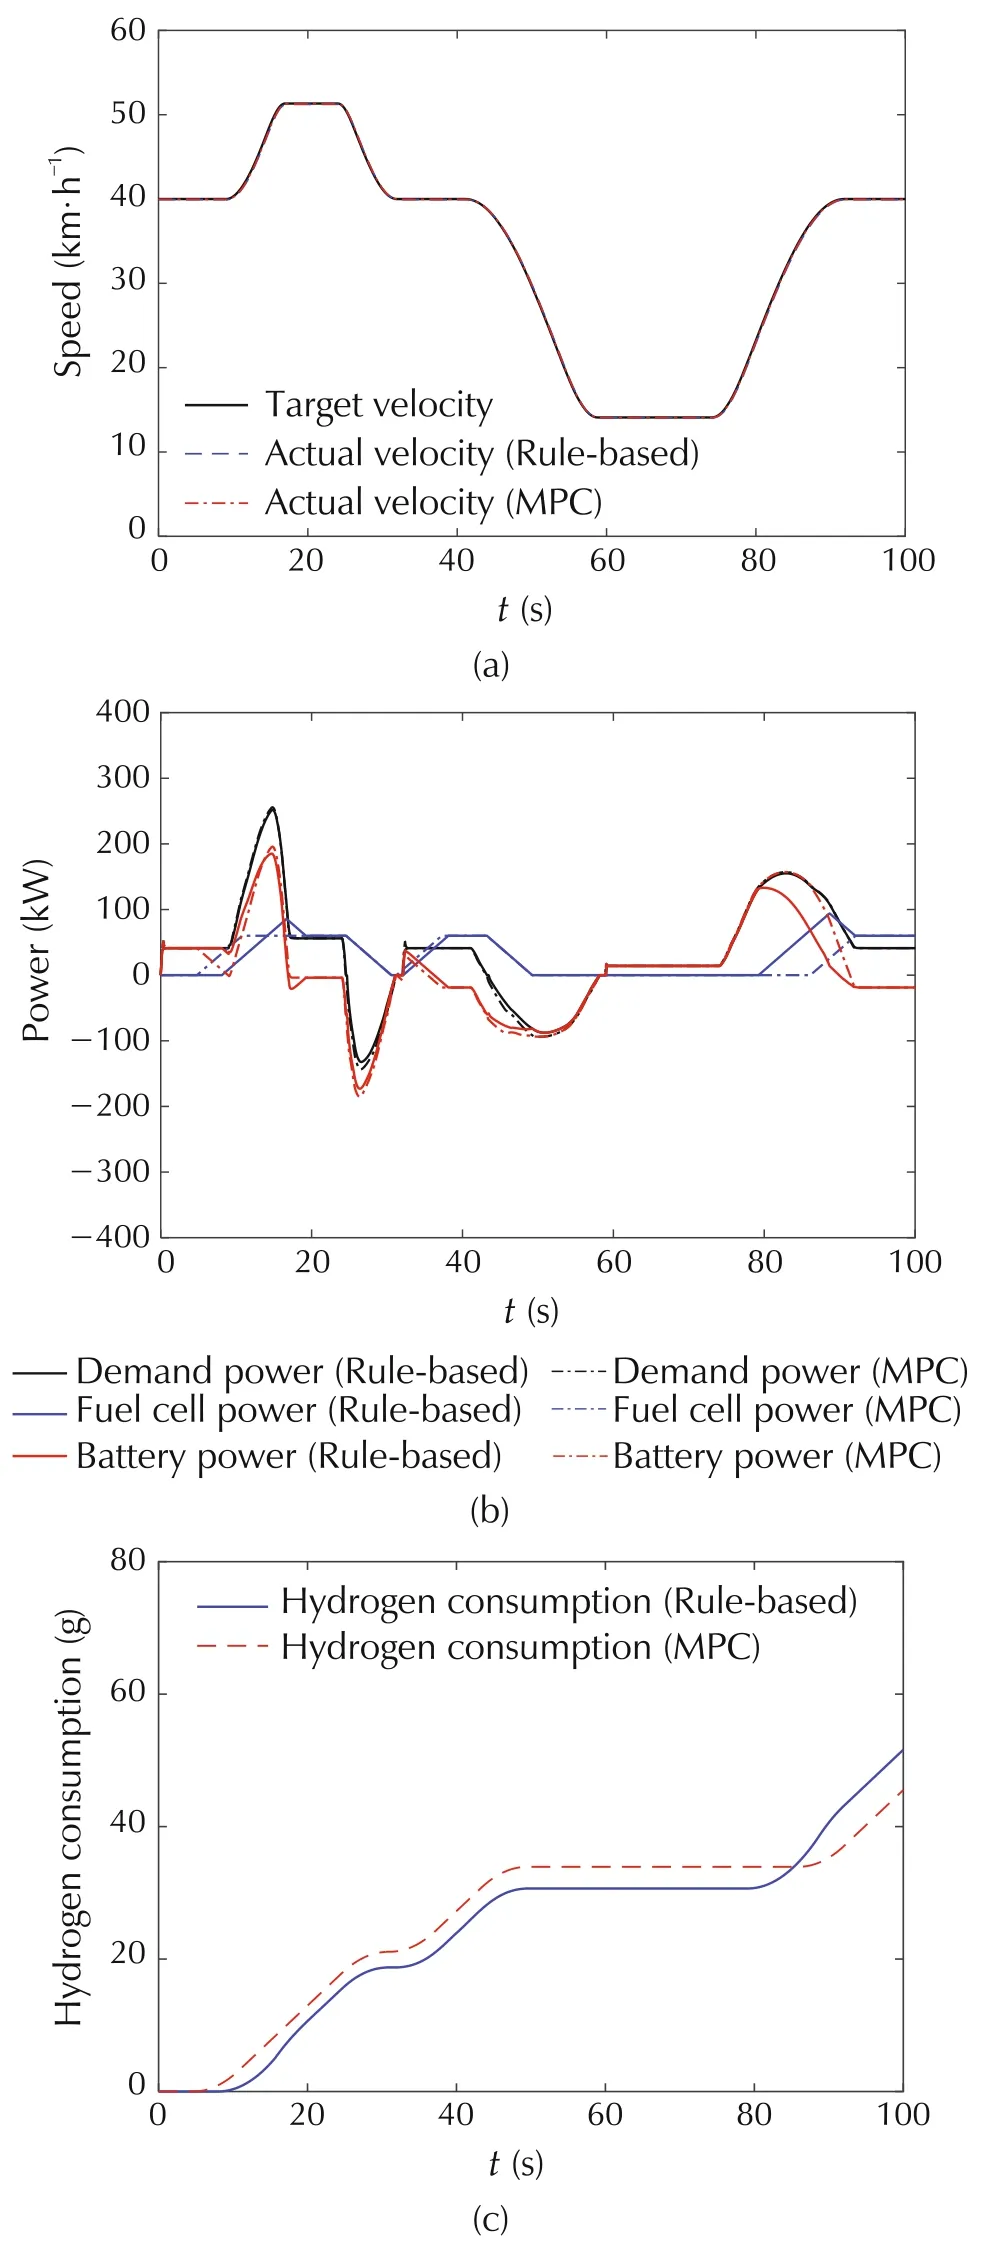
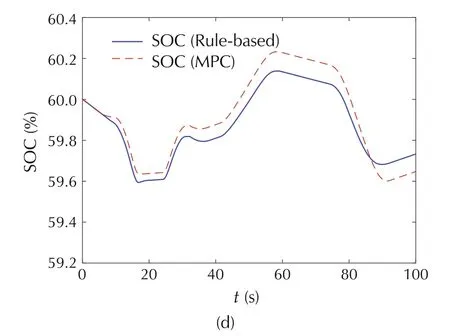
Fig.15 Simulation results of two ESMSs for the FCT(test scenario 2). (a) Velocity. (b) Power. (c) Hydrogen consumption.(d)SOC.

Table 3(a) The simulation results of the energy source management strategies(test scenario 1).

Table 3(b) The simulation results of the energy source management strategies(test scenario 2).
6 HiL test
The HiL simulation for system performance testing is carried out,in order to better simulate the actual vehicle operating conditions and environment, so as to more accurately test and evaluate the effectiveness and realtime performance of the eco-velocity planning algorithm and MPC-based energy source optimization strategy designed in the previous sections.
6.1 HiL test scheme
The HiL simulation test scheme of FCT is shown in Fig.16,where PC 1 and PC 2 represent the upper computer used for building the simulation model, generating code, calibration and measurement. Moreover, PC 1 is used for the establishment of the vehicle dynamics model and the driver model,and it also sends traffic light information to the vehicle,simulating the ITS system at the same time.PC 2 is used for the eco-velocity planning algorithm based on the traffic light information and the establishment of the energy source management strategy model. ControlDesk and Meca softwares are the observation calibration tools for MicroAutoBox and vehicle prototype controller RapidECU, respectively. The prototype controller used in the study is based on the core chip MPC5554, which has a main frequency of 80MHz.The HiL test platform is shown in Fig.17.
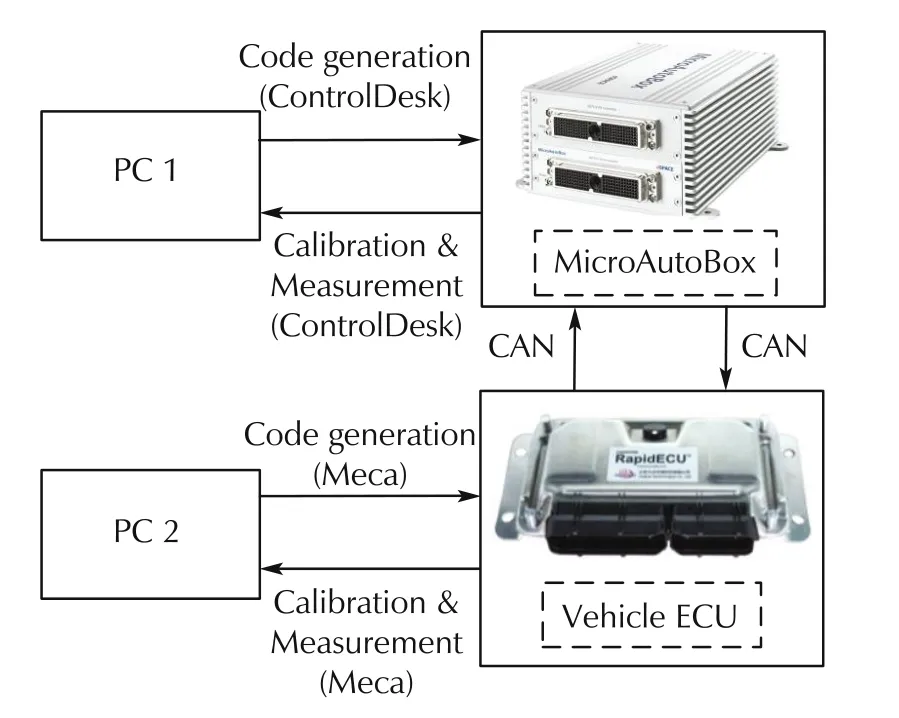
Fig.16 HiL simulation test scheme.
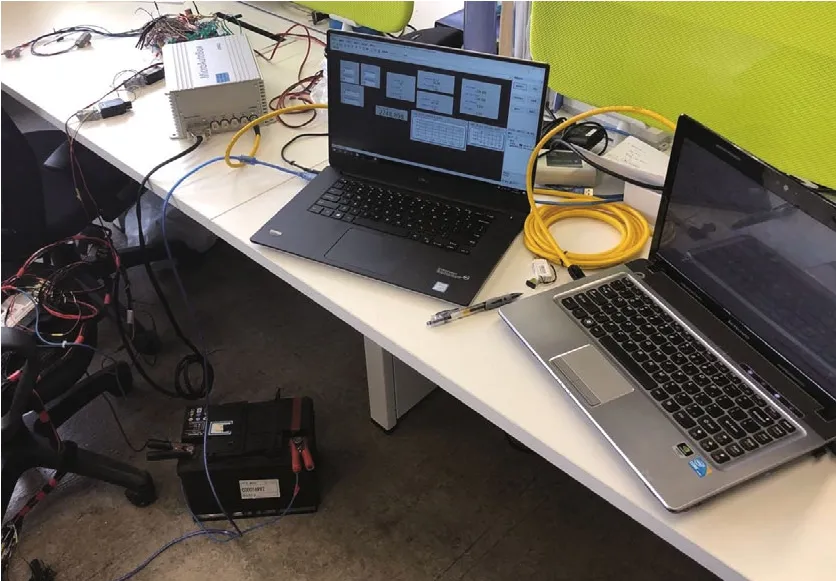
Fig.17 HiL simulation test platform.
6.2 HiL test results and analysis
Figs.18 and 19 show the comparison results of test scenario 1 between the offline simulation test and the HiL simulation test of the rule-based ESMS for FCT and the MPC based energy source optimization management strategy for FCT, respectively. It can be seen that the HiL test results are basically the same as the simulation results. However, the signal is affected by noise and other factors, so there are relatively more fluctuations in the HiL test results. The correctness of the established FCT driving system and control strategy model is further illustrated, and the real-time performance of the eco-velocity planning algorithm and the proposed MPC-based ESMS are verified by the HiL tests.
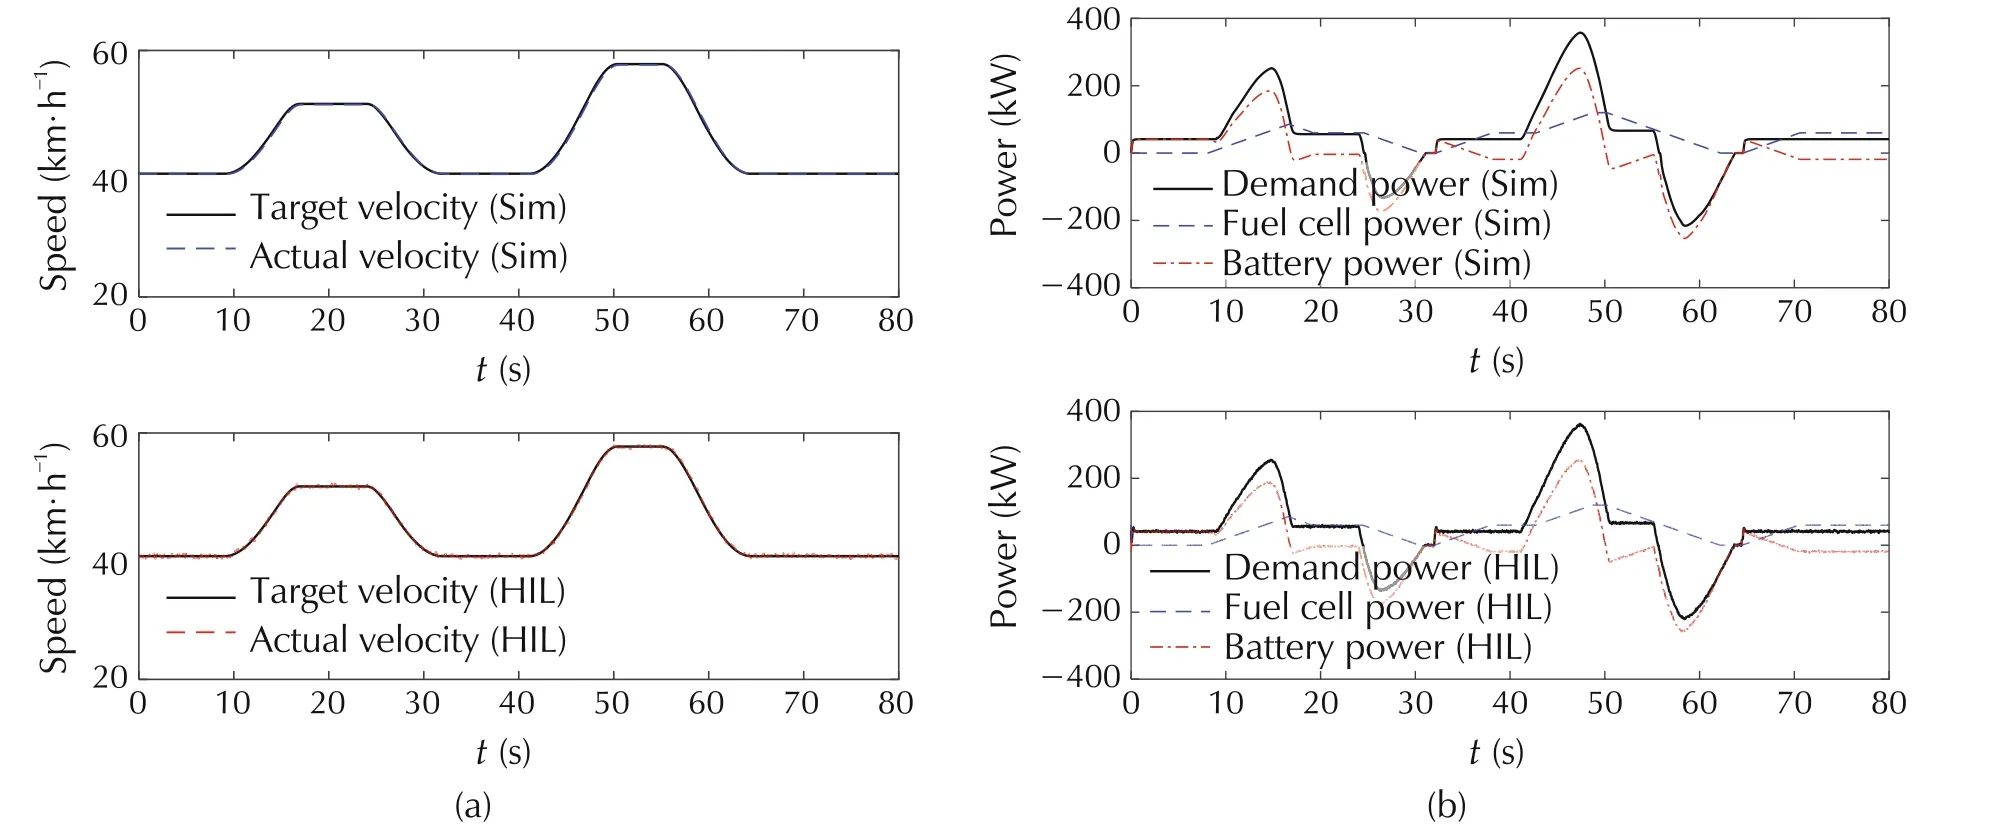
Fig.18 The HiL test results of the rule-based ESMS.
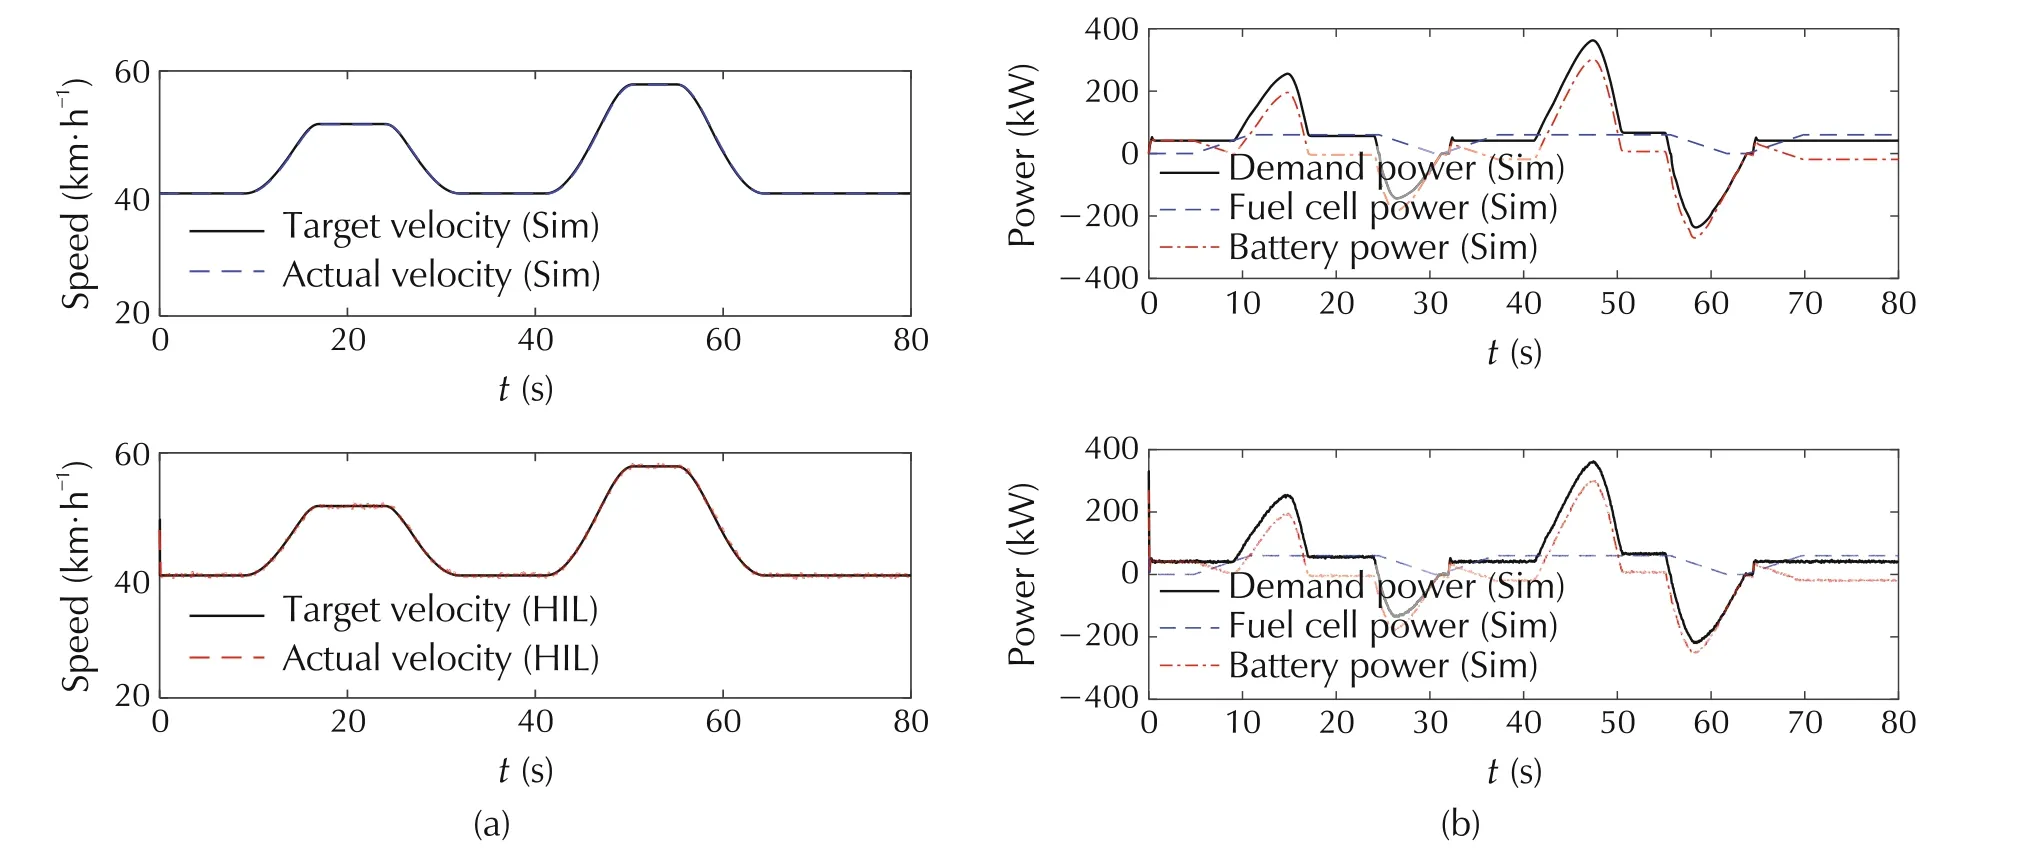
Fig.19 The HiL test results of the MPC based ESMS.
The HiL test results of the rule-based ESMS and the MPC-based optimization ESMS under the test scenario 1 are shown in Table 4. It can be seen that with the terminal SOC value maintained within 1%deviation,the total hydrogen consumption of the MPC based ESMS is reduced by 7.02%compared with the rule-based ESMS,which is basically the same with the result obtained by the offline simulation.Thus the effectiveness of the developed MPC strategy is further verified. It also shows that the strategies have reliable real-time performance and can be used for subsequent research development in the future.

Table 4 The HiL test results of the proposed two ESMSs(test scenario 1).
7 Conclusions
This paper has studied the hybrid energy source optimization distribution strategy for the FCT based on eco-velocity planning with the assistance of traffic light information. First, the FCT vehicle simulation model is established.And based on the information provided by the ITS system,the piecewise trigonometric function is used to plan the eco-velocity when the vehicle passes through the signalized intersections.In order to further improve the FCT energy economy, an MPC-based energy source optimization management strategy for FCT is proposed.The minimization of the equivalent hydrogen consumption in the prediction horizon is considered as the optimization goal. And then the Dijkstra algorithm is used to solve the optimal working point of the fuel cell power online. The off-line simulation of the proposed MPC-based FCT energy source optimization management strategy can reduce the total hydrogen consumption by 7.43%in the traffic light scenario,compared with the rule-based ESMS. Although the energy saving effect will be different in various traffic scenarios,in general,the proposed MPC-based energy source optimization management strategy can effectively improve the FCT energy economy. Finally, the HiL test of the energy source optimization management strategy of the FCT is carried out. And compared with the rulebased ESMS,the proposed MPC-based ESMS improves energy economy of the tested FCT by 7.02% under the same scenario, which is in good agreement with the simulation results.The HiL test further validates the effectiveness and real-time performance of the proposed energy source optimization distribution strategy for the FCT.
In general, the MPC-based energy source optimization management strategy for the FCT using the traffic light information proposed by this paper provides guidance for the improvement of the FCT energy economy in the future with the help of ITS. However, this paper simplifies the power of the fuel cell into several certain working points, which has limitations to some extent,and the ESMS for the FCT needs to be further explored in the future work.
杂志排行
Control Theory and Technology的其它文章
- Predictive car-following scheme for improving traffic flows on urban road networks
- Two-stage on-board optimization of merging velocity planning with energy management for HEVs
- A unified optimal planner for autonomous parking vehicle
- An MPC-based manoeuvre stability controller for full drive-by-wire vehicles
- Distributed active fault tolerant control design against actuator faults for multiple mobile robots
- Robust control for electric vehicle powertrains
