Sensitivity analysis of the vane length and passage width for a radial type swirler employed in a triple swirler configuration
2019-12-01FodVshhiShhnzRezeiRezAlidoostDfsriJeekeunLee
Fod Vshhi, Shhnz Rezei, Rez Alidoost Dfsri, Jeekeun Lee
a Fluid Engineering Laboratory, Department of Mechanical System Engineering, Graduate School of Chonbuk National University,Jeonju, South Korea
b Division of Mechanical System Engineering, Chonbuk National University, Jeonju, South Korea
Keywords:Triple swirler Swirler design Radial vane length Passage width Reynolds averaged Navier–Stokes
A B S T R A C T The design of axial or radial swirlers typically governs a number of geometrical parameters that are determined by the desired flow field. In the meantime, the number of unknown parameters increases with the number of concentrically mounted swirlers. The available literature is nonetheless limited, and designers are obligated to increase the number of initial assumptions. In this article, three kinds of triple swirlers are employed and simulations are performed to determine the effect of each parameter on the swirler performance. Based on the correlation provided, overlengthening the radial vane length could result in significant changes in the flow field from the jetlike pattern to a wide swirl-jet angle due to the Coanda effect. Passage width should also have the potential to alter the swirl-jet angle and velocity field at the exit of the swirler.
1 Introduction
The present work is motivated by issues we have encountered while developing a design methodology for triple swirlers. Swirlers play a significant role in governing combustion characteristics in industrial burners, aviation and terrestrial gas turbines, etc. Swirled-enhanced combustion, although often effective, suffers from instabilities, particularly when dealing with premixed combustion to achieve lower NOxemissions [1–4].Such instabilities may result in expensive structural damage to the turbine blades and may lead to operation failure [5, 6]. The twin annular premixed swirler (TAPS) by general electric (GE)offered a solution by narrowing down the margin of such instabilities with a central diffusion flame surrounded by an outer premixed flame [4, 7, 8], reducing the NOxemissions significantly [9, 10].
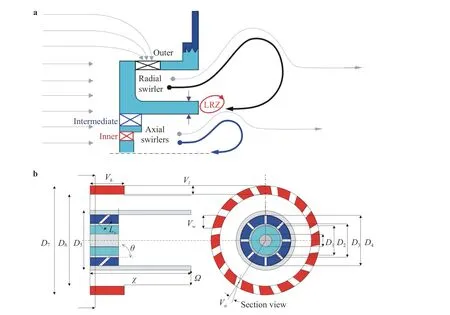
Fig. 1. Schematic of the triple swirler and location of main flow features. a Presentation of main flow features. b Schematic of triple swirler and definition of the geometrical parameters.
The procedure used to design the triple swirlers mostly followed the guidelines given in Refs. [11–18] and the TAPS recommendations in Refs. [19, 20]. However, the abundance of unknown geometrical parameters and their undefined contribution to the flow field prevents the designers from gaining control of the basic features of the swirling motion such as the swirl-jet angle, length and width of the inner, outer and lip recirculation zones (IRZ, ORZ, LRZ), etc. (see the schematics provided in Fig. 1). In particular, the multi-swirler interactions are often constrained by the dominance of the swirler with a higher inlet area and flow rate. However, providing a desired flow field requires attention to various geometrical parameters and their rotation direction related to one another [21–24]. All three previously designed triple swirlers consist of an inner and intermediate axial swirler surrounded by an outer radial swirler in which swirlers are counterswirled relative to one another. The inner and intermediate swirlers remain unchanged, as only the outer swirlers were designed to generate swirl number a of 0.5, 1, and 1.5 according to Eq. (2).
The swirl number is a non-dimensional characteristic number that is widely used to map the swirl flow states. It is defined as the ratio of axial flux of tangential to that of axial momentum

where Riand Roare the inner and outer radii and u and w represent the axial and tangential velocity components,respectively. The swirl number simplifies to geometrical swirl number for in the following manner for axial swirlers

where c is the ratio of the inner to outer diameter of the swirler,and θ is the vane angle [11, 25]. It is known that if the swirl number reaches a certain threshold (S n > 0.6), the positive pressure gradient dominates the flow field, and flow reversal occurs [11, 26–30]. Numerous correlations to characterize the swirl intensity have been proposed in the past few decades, with each one taking different geometrical parameters into account and considering separate aspects of the swirler performance[31]. For instance, for the radial swirlers it was proposed that the swirl number can be defined as

where ψ = 0.35 is the blockage factor [15, 17]. The definition of geometrical parameters is detailed via the schematic of a triple swirler presented in Fig. 1(b).
While the swirling flow field is mostly characterized by the geometric swirl number, there are still geometrical parameters that may influence the flow field but are not considered in the swirl definition. For instance, as previously reported [32] and elaborated on in the present manuscript, the swirl-jet is greatly influenced by the swirlers geometrical parameters, which are not necessarily related to the swirl intensity. Unfortunately, the criteria to set a value for such parameters are either not perused or not disclosed. For instance, it is not clear to what extent the location of the interaction points of the axial and radial swirlers ( χ in Fig. 1(b)) affects the flow field. Additionally, for the triple swirlers, a third recirculation zone, referred to as the LRZ between the axial and radial swirlers was identified [7, 8]. Although its effects are somewhat clear, no correlation could be found in the available literature for generating a desired LRZ size(see Fig. 2(a)). Thus, within the process of developing a design procedure, correlations are required to modify the geometrical parameters to achieve the desired flow state.
For each swirler, due to the lack of known variables, some of the parameters are assumed, while the rest are computed accordingly. The designs of the axial swirlers are fairly straightforward compared with those of radial swirlers. The abundance of unknown parameters within the radial swirler design brings complexity into predicting the flow behavior. The flow field of the designed swirlers was previously investigated in Ref. [32] and showed a nice representation of the swirling flow for case S1,while S3 failed to meet the criterion for the spreading angle due to the Coanda effect [33–35], leading to the attachment of the swirl-jet to the swirler surface and chamber bottom due to a reduction in the pressure difference between the fluid and surface.This behavior undermines the applicability of the swirler because of the amplification of the recirculation zone width and the resultant structural damage due to overheating the surface.Table 1 summarizes the dimensions of the designed swirlers S1,S2 and S3, indicating that to achieve a higher swirl intensity at the outer swirler, the radial vane geometry is altered, but no regulations are available to avoid the Coanda effect at the exit of the swirler.
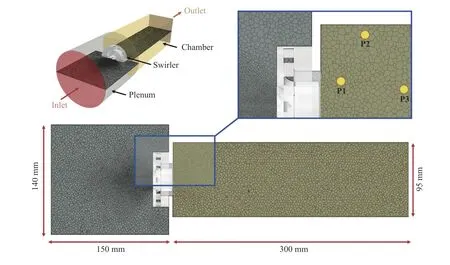
Fig. 2. Triple swirler simulation domain. Depiction of polyhedral grids and domain boundaries and and dimensions along with the location of probes (P1, P2, and P3) for data extraction.
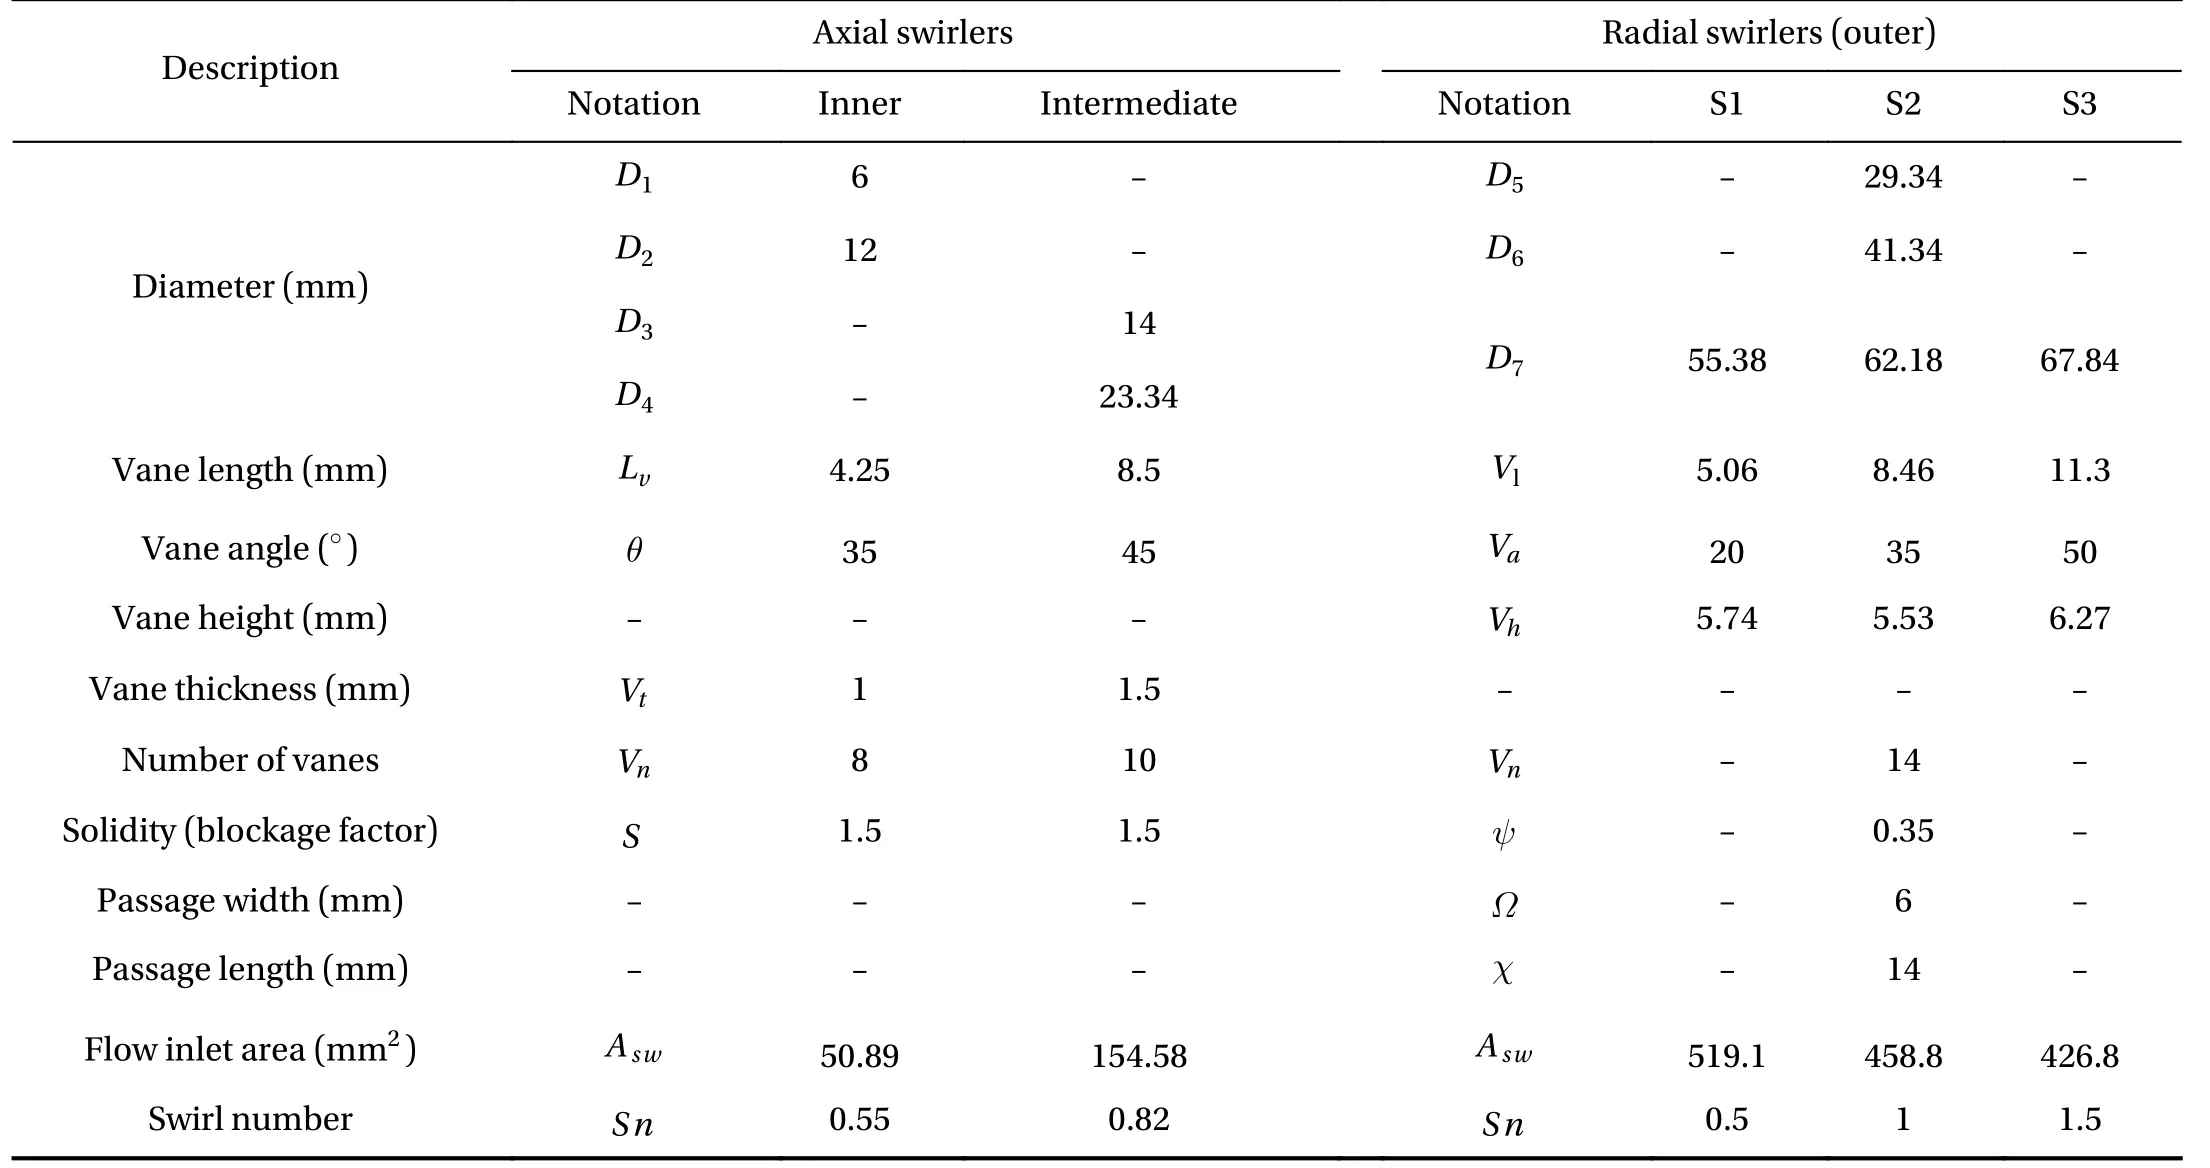
Table 1 Description of the geometrical parameters presented in Fig. 1 for swirlers S1, S2 and S3
The present manuscript intends to give insight into two important geometrical parameters, namely, the radial swirler vane length (Vl) and the passage width ( Ω), with an elaboration on their impact on the flow field. Additionally, guidelines are provided to prevent an occurrence of the Coanda effect while maintaining a desired swirl intensity. This was done through a series of computational fluid dynamic (CFD) simulations, which are proven to be grid-independent and carefully assessed against experimental data in the upcoming section. In the results and discussion sections, the flow fields ascertained from different geometries are compared, and correlations are provided to correct the initial design methodology accordingly and prevent the Coanda effect from occurring. Finally, concluding remarks are given, and the main findings are summarized.
2 Numerical analysis
To investigate several geometrical parameters, CFD was used as a tool to predict particular geometrical parameters affecting the triple swirler design, which are either expensive or time consuming to study experimentally. Three-dimensional (3D) steady Reynolds averaged Navier–Stokes simulations (RANS) were performed using commercial software STAR-CCM+ ver. 11.06 and implementing the finite volume method. The well-known realizable k-ε two-layer model was chosen to solve the Navier–Stokes equations. The RANS simulation has proven to be relatively accurate in predicting mean swirling flow features. This was previously assessed against a highly complex flow issued from a dual counter rotating swirler and dealing with general features such as the expansion angle of the swirling jet, good agreements with the experimental data was obtained [24]. The mass flow inlet and pressure outlets with zero-gauge pressure were used as boundary conditions with no-slip wall boundaries. Iso-thermal simulations used air as the working fluid with a density of 1.23 kg/m3.Air was assumed to be incompressible, and the effect of temperature on flow was not taken into account.
Three different polyhedral grids were constructed to assess the dependency of the solution on the grids. For all the grids, 5 prism layers stretched by a factor of 1.5 were used with a maximum thickness of 0.2 mm, resulting in y+< 5 for the entire region and all simulations. The density of the mesh around the vanes was increased by a factor of 1.2, and the growth factor was reduced to 0.8 for a smooth transition from smaller to larger cells.Table 2 summarizes the details of the constructed grids. As depicted in Fig. 2, the domain was extended to 300 mm after the swirler and 150 mm before the swirler to fully achieve the developed flow and reduce the related errors.
A method for assessing the grid convergence is to estimate the discretization error originating from solving partial differential equations on the grid points. These methods rely on the as-sumption that the exact solution is available, and then the grids are refined by adding an extra grid point between the original two grid points, splitting the cell distance h to h /2 [36–38].However, in practice, the exact solution is typically unknown and requires using methods such as Richardson extrapolation,generally known as the RE method, to estimate the error using three different quality grids refined by a factor of 2. While these methods are not applicable to the presented grids due to an unequal refinement factor, the American society of mechanical engineers (ASME), fluid engineering (FE) section introduced a general guideline to estimate the grid convergence index (GCI) for grids with unbalanced refinement factors. The method indicates that for a desired variable calculated on a single probe for different grids, the GCI can be defined according to

Table 2 Details of the constructed mesh for cases 1, 2, and 3 with fine, medium, and coarse meshes, respectively


where εij= ϕi−ϕjis the difference between the acquired value of the variable on two different grids, and r = hcoarse/hfine. The characteristic cell size for each 3D grid is then estimated as

where N and Z represent the total number of cells and each cell volume, respectively.
Choosing an axial velocity component as the evaluating parameter, Eq. (5) was numerically solved in MATLAB using the vpasolve command for the three different depicted probes in Fig. 2(b) (P1, P2 and P3). These points are chosen due to their importance in capturing the behavior of vital flow features, such as the formed shear layer, the wall stagnation point and the IRZ.The GCI for cases 3 to 2 were computed as 4.27%, 7.16%, and 3.17% for P1, P2 and P3, respectively, which were reduced to 2.83%, 3.54% and 1.04% for cases 2 to 1. Evidently, the discretization error for case 3 is relatively high, while both cases 1 and 2 show low error percentages. Additionally, the majority of errors rose from the flow impinging on the chamber walls, indicating the need for further refinement for more accurate results. Here,the differences between cases 1 and 2 were found to be negligible, as the solution was determined to be independent of the mesh. Therefore, case 2 was chosen for the current study.
Figure 3 compares the experimental data against the chosen mesh (case 2). The particle imaging velocimetry (PIV) experiment is extensively described in our previous works [21, 23–25]and here only the published data in Ref. [32] is used to validate the simulation results. The velocity components were normalized by the inlet velocity before the swirler at a 4% pressure drop and defined as

where Dc= 140 mm is the cylinder diameter behind the swirler and Q is the volume flow rate measured via flow meter. The coordinates are then normalized by the hydraulic diameter ( D)representing the maximum swirler exit diameter in the following manner

Due to the axial symmetric behavior of the flow, only opposite halves of the PIV and CFD domain are presented for comparison. The simulation slightly overestimates the peak of the axial and spanwise velocity components. Since no interpolation method was used to extract the data at the desired positions, the location of the lines for the experimental data and CFD slightly deviate by a maximum of ±0 .25 y/D, which in turn may cause natural differences between the experiment and the CFD data.Nevertheless, the general predictions are acceptable in terms of predicting the width of the swirling jet, the peak position and the intensity and location of the recirculation zone's eye.
3 Results and discussion
3.1 Effect of radial vane length

Fig. 3. Comparison of PIV and CFD results on the generated polyhedral grid. a Axial velocity and b radial velocity.
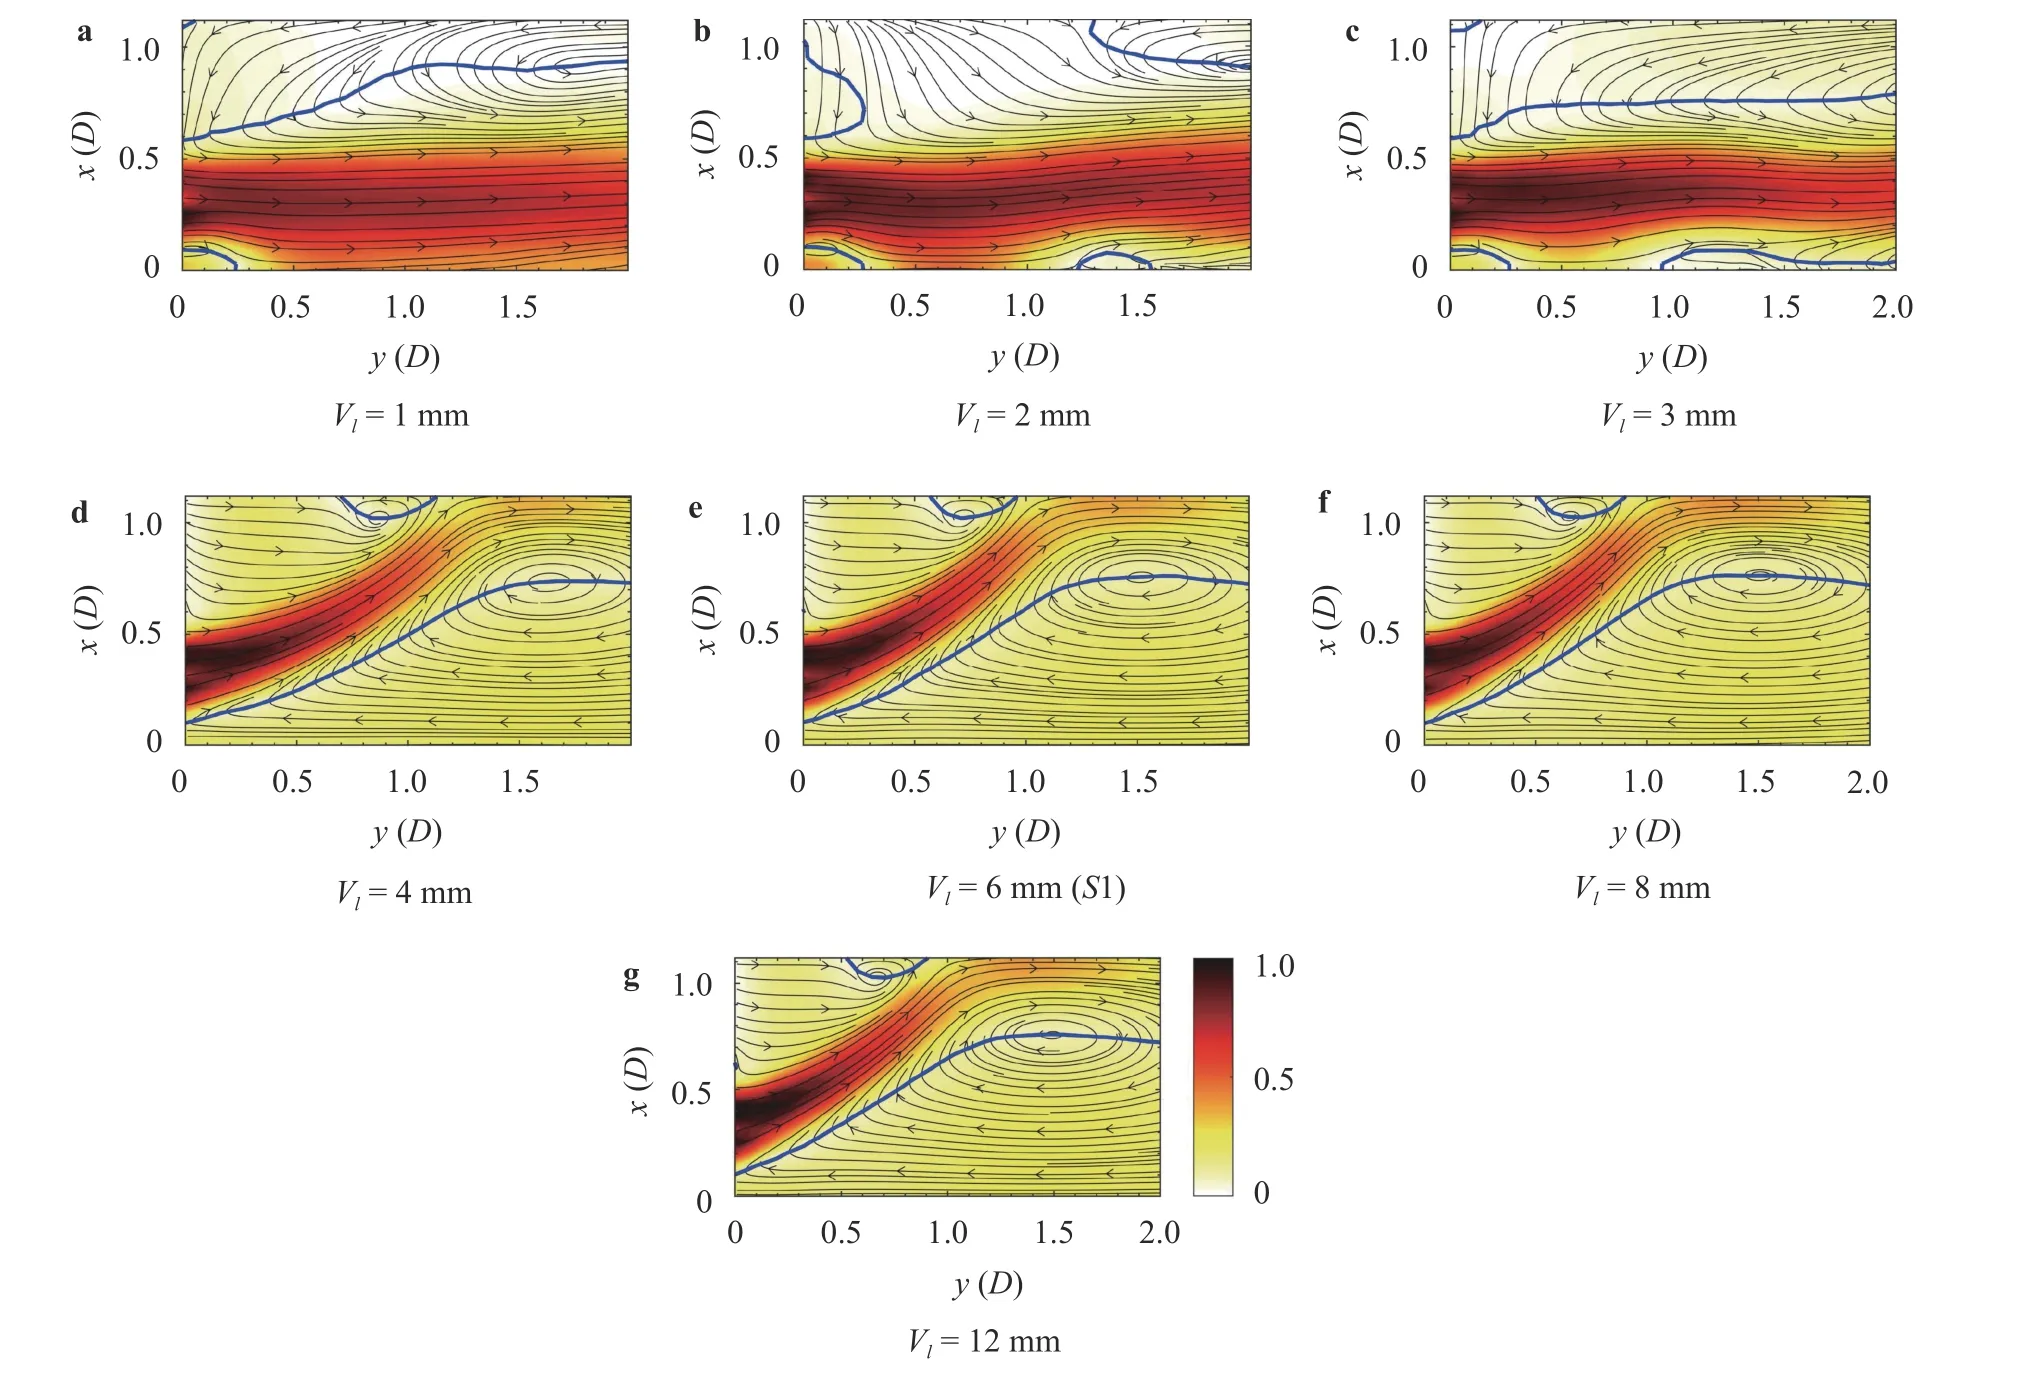
Fig. 4. Effect of radial vane length on the swirling flow field (S1 triple swirler). Contours are acquired from RANS simulations and represent the velocity magnitude normalized to with zero-axial velocity region and streamlines in solid blue and gray lines. Colorbar for all contours is shared in Fig. 4(g).
The geometric definition of Vlis presented in Fig. 1, while Figs. 4–6 illustrate the evolution of the swirl-jet and IRZ with an increase in the radial vane length for all the triple swirlers. All simulations are performed with the actual mass flow rate measured from an experiment according to a 4% pressure drop for all swirlers. The formed swirling jet undergoes a change from a jetlike pattern to a typical swirling flow and then attaches to the bottom of the chamber when a higher swirl is imposed at the radial swirler. While the jet-like pattern formed for all cases, the attachment to the chamber walls occurred only for S3. Figure 6 indicates that the attachment to the chamber bottom appears somewhere between 4 and 6 mm of the vane length for the S3 due to the Coanda effect [33–35]. In examining the early designs,a passage width of 6 mm was assumed, which evidently does not provide a desirable swirl-jet angle at the exit of the swirler. It is vital to understand the reason for such behavior and provide correlations for swirler designs.
To begin, Figs. 7–9 show the distribution of the axial, radial and tangential velocity profiles on a line located at y /D = 0.26.The profile of the axial velocity in Fig. 7 shows no change in the axial velocity peak but a shift in its location moving away from the swirler for S1 and S2. However, S3 shows an abrupt decrease with a sudden rise in the distance between the peak location for vane lengths greater than 4 mm. However, the radial tangential velocity profiles are greatly influenced by the change in radial vane length (see Figs. 8 and 9, respectively). The radial velocity increased monotonically for S1 and S2 with an abrupt increase after the jet-like stage; while for S3, it first increased and then showed a sudden decrease. Additionally, the peak location however, remains unchanged. The tangential velocity component remained almost constant for the S1 swirler and increased considerably for the S2 swirler; while for the S3 swirler, it first increased, had a sudden decline and then remained constant. The tangential velocity for the S3 swirler initially increases with an increase in the vane length due to a rise in length of the flow development inside the radial swirler and is followed by a relative decrease for the range from 4 to 6 mm, then it remains constant for radial vane lengths of 8 and 12 mm.
Figure 10 compares the normalized maximum of each velocity component for all swirlers. The maximum axial velocity initially decreased and then remained constant with an increase in vane length for the S2 and S3 swirlers. However, S1 shows signs of a minor initial increase followed by a decrease and then remains constant for vane lengths longer than 7 mm. The radial velocity undergoes a more significant disruption while modifying radial vane length. Not including S3, the other two swirlers experience a rise in radial velocity and then remain constant,while the third swirler first increased and then drastically decayed and remained constant. The tangential velocity component remains almost constant for the S1 swirler. However, S2 and S3 face an increase with an increase in the vane length up to Vl= 4mm. From this point on, the S2 remains constant and comparable to axial velocity while S3 is reduced and then remains constant.
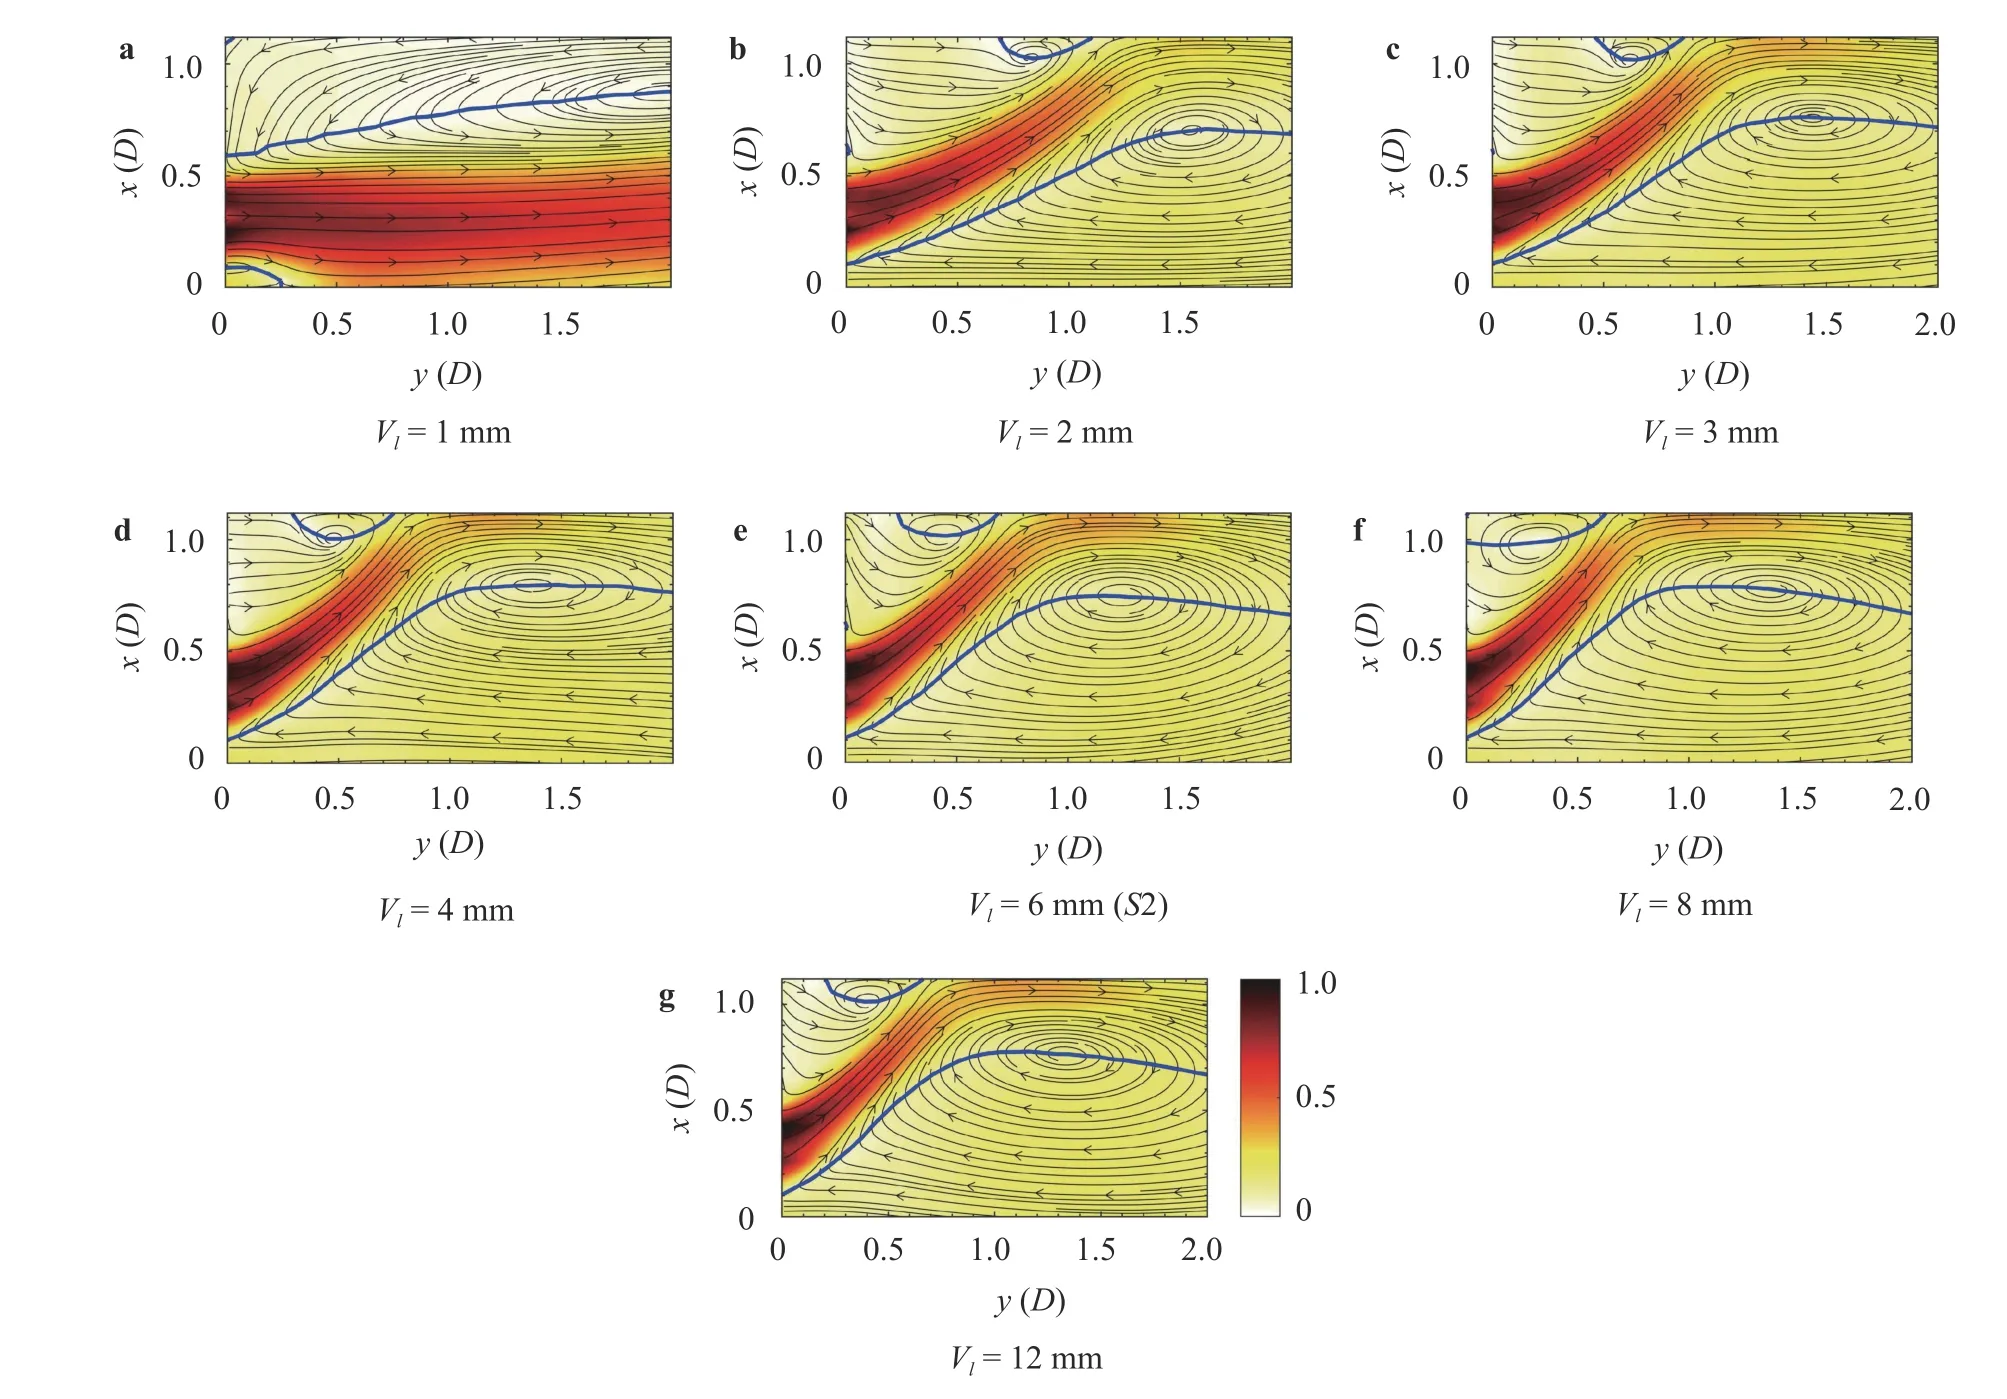
Fig. 5. Effect of radial vane length on the swirling flow field (S2 triple swirler). Contours are acquired from RANS simulations and represent the velocity magnitude normalized to with zero-axial velocity region and streamlines in solid blue and gray lines. Colorbar for all contours is shared in Fig. 5(g).
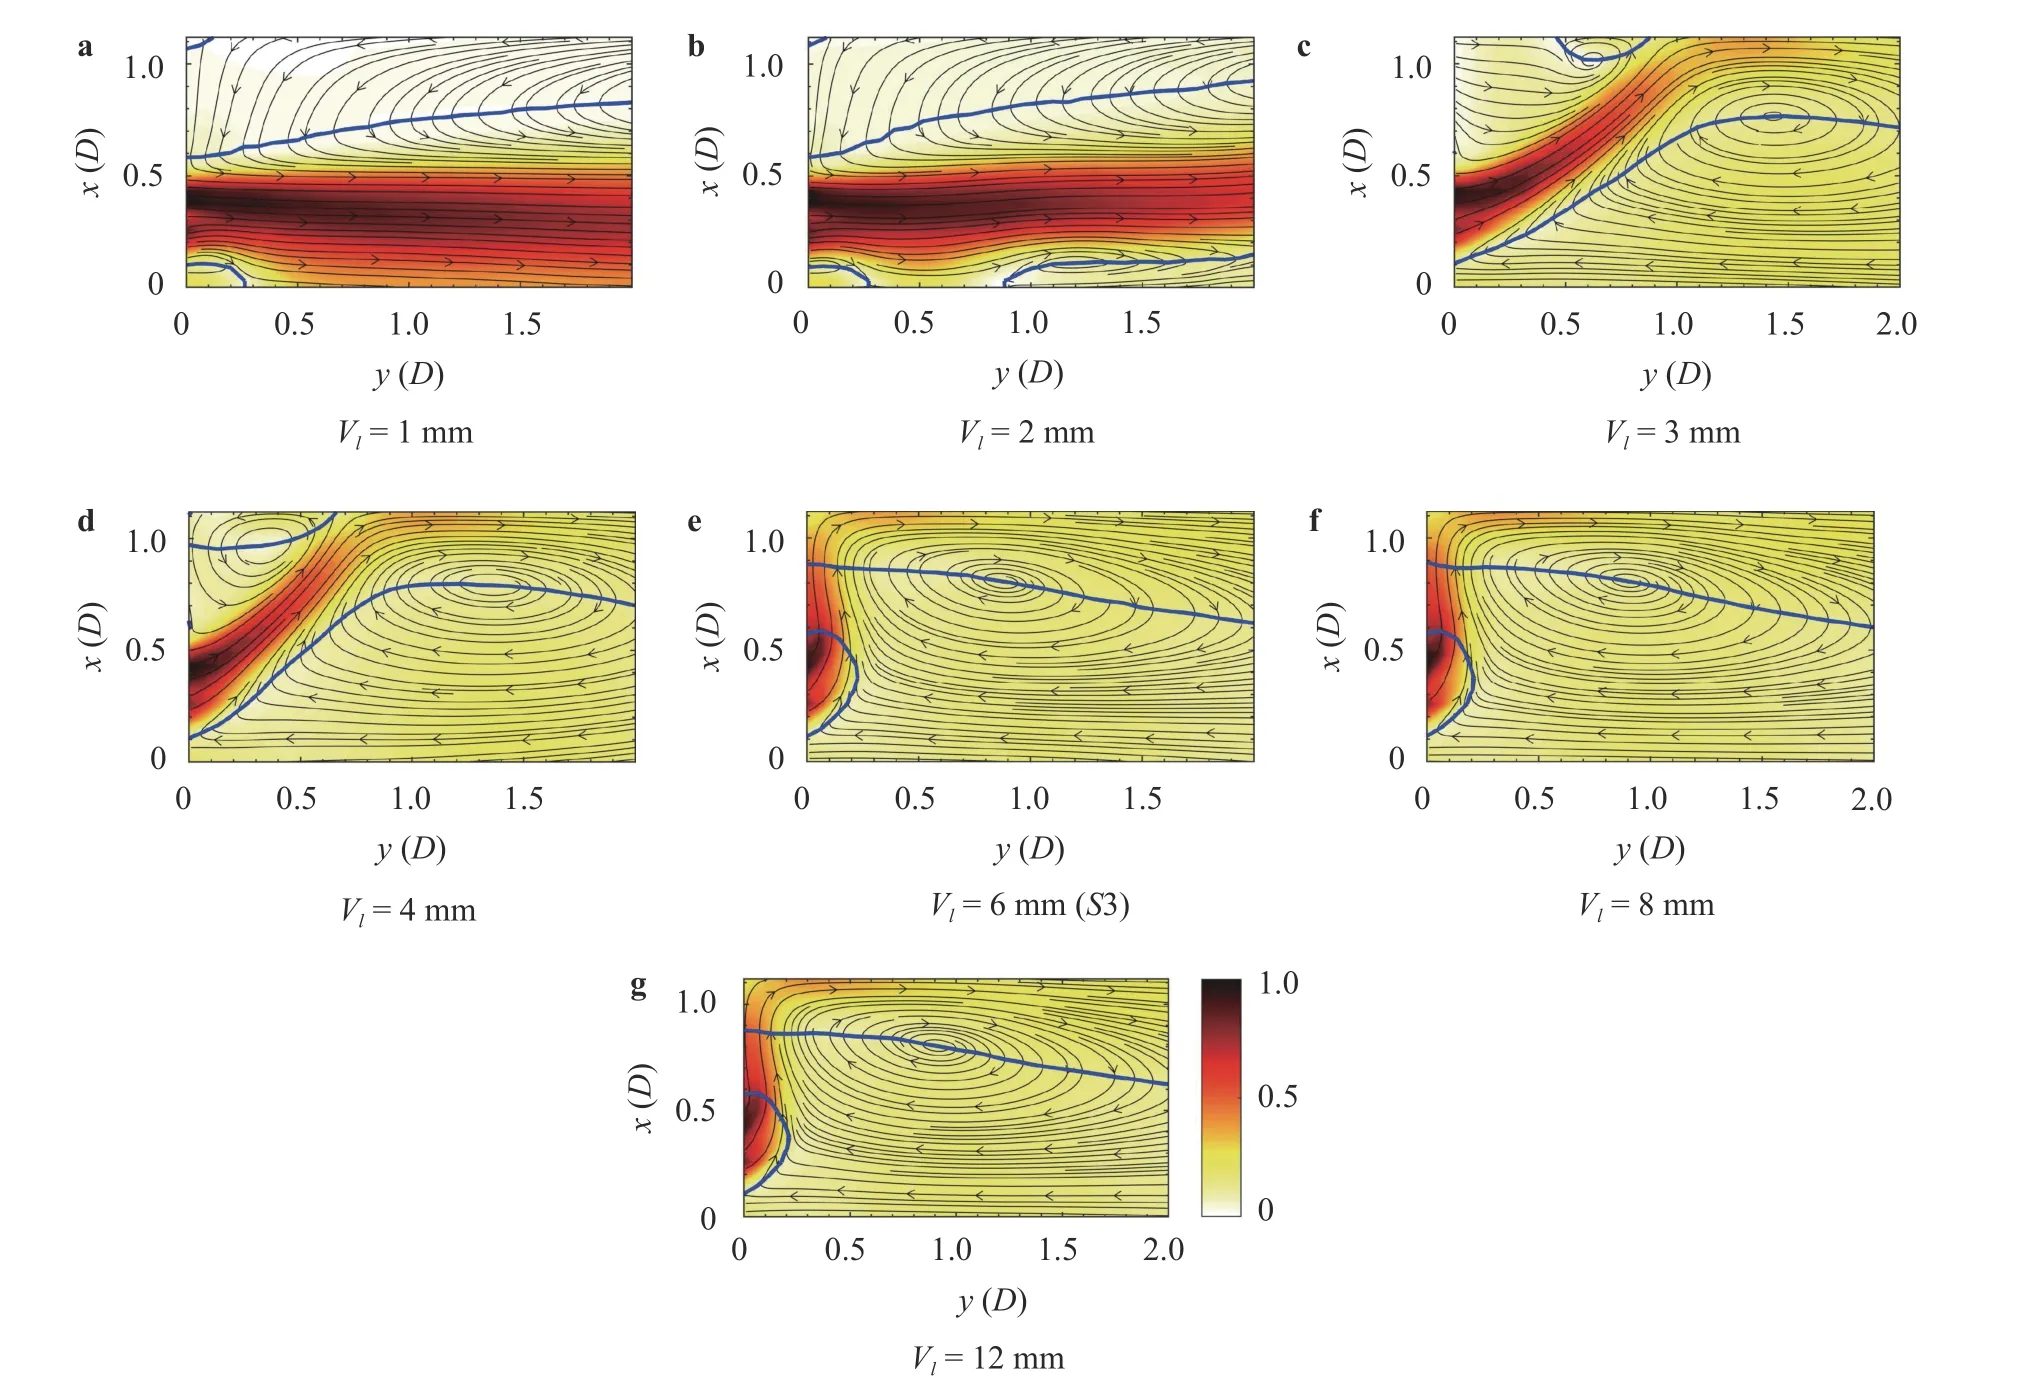
Fig. 6. Effect of radial vane length on the swirling flow field (S3 triple swirler). Contours are acquired from RANS simulations and represent the velocity magnitude normalized to with zero-axial velocity region and streamlines in solid blue and gray lines. Colorbar for all contours is shared in Fig. 6(g).
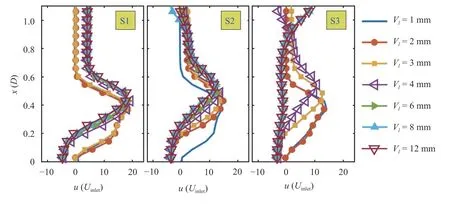
Fig. 7. Axial velocity profile on. Due to symmetry only half of the flow field is depicted.
As is evident in Fig. 11, all three velocity components undergo a change in their trend after a vane length of approximately 4 mm and then remain almost constant. This figure also reveals that the radial velocity component is affected to a higher degree than are the axial and tangential components. The axial, radial and tangential momentum for S1 and S2 are almost balanced after 4 mm of vane length, but a combination of radial and tangential components dominates the flow field in S3. The change in the behavior of the gradient of each component indicates the existence of a critical point for the vane length that defines the angle of the emerging swirling jet. Additionally, from Fig. 11(a)and (b) it is deduced that the influence of vane length on axial velocity development is minor. It is then safe to say that for each specific vane angle, a proper length is required to ensure that the flow gains its maximum momentum in either the radial or tangential direction and then fully develops in the most desired one with a minor energy loss. With minor fluctuations at a radial velocity for S1 and a monotonic decrease for S2, the third swirler suffered from a strong variation in the radial and tangential components as a result of the intense swirl imposed and improper vane length.
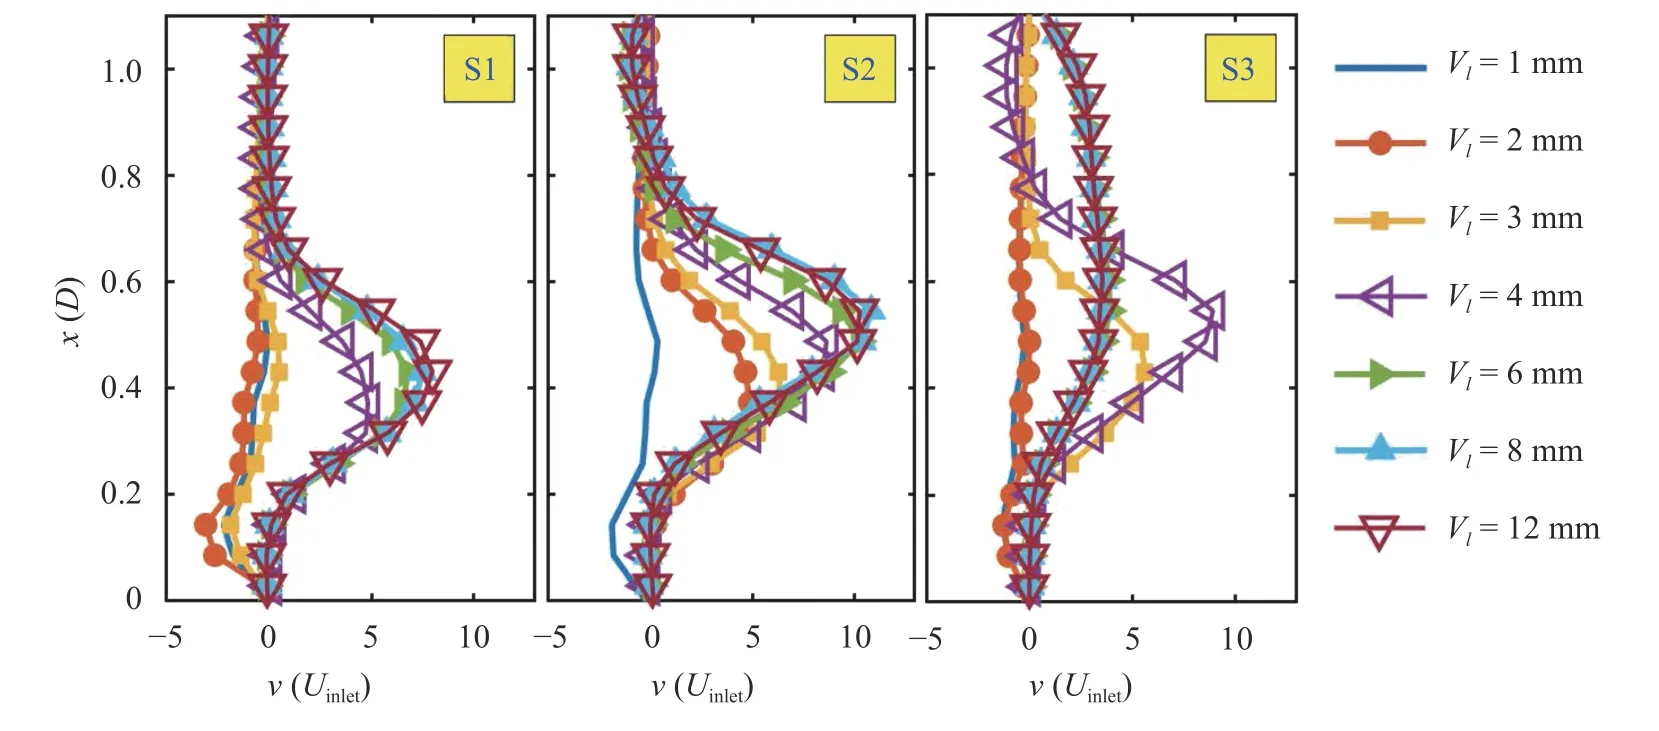
Fig. 8. Radial velocity profile on. Due to symmetry only half of the flow field is depicted.
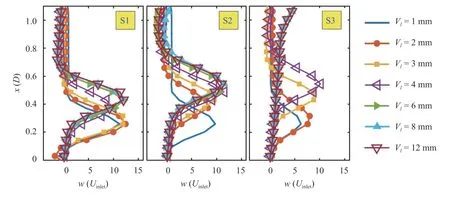
Fig. 9. Tangential velocity profile on. Due to symmetry only half of the flow field is depicted.

Fig. 10. Maximum normalized a axial, b radial, and c tangential velocity along the line.
3.2 Determination of radial vane length
It is appropriate to set the vane length so that a desirable swirl-jet angle is achieved, and Coanda effects such as the S3 swirlers are avoided. However, first, one needs to present a clear definition of the swirl-jet angle, and to do so, a precise determination of the wall stagnation point is required. The wall stagnation point can be estimated using a point with zero axial velocity.However, for a complex 3D flow such as swirling motion, such a definition may not take the importance of the swirl component into account. Thus, here, it is defined as the maximum correlation achieved between the three velocity components close to the chamber walls. The given definition represents a single point located on a line at x /D = 1.119, where all components have the peak correlation. The points are extracted along a straight line from the bottom of the chamber at y /D = 0, extended downstream.
Figure 12(a) represents the position of the line-probe on a representative correlation contour map for case S1, which previously given in Fig. 4(e). A lower boundary used to calculate the swirl-jet angle was considered at [y /D,x/D]= 0. Although such a definition may slightly overestimate (up to 15°) the swirl-jet angle, since in reality, the actual flow emerges at coordinates of approximately 0.25 x /D to 0.5 x /D, it provides a common origin point for all the simulated cases and reduces the number of factors included in the computation. The blue line shows the correlation profile along the dashed black line, and the red dot indicates the location of maximum correlation. Extracting the coordinates of the maximum correlation and the known chamber width one can interpret γ as follows

The variation of γ with an increase in the vane angle is depicted in Fig. 12(b). In the case of the smallest vane length, as discussed previously, the jet-like flow does not allow the flow to touch the chamber sides and irregular behavior was observed.After this point, the swirl-jet angle starts to increase for all swirlers where the growth rate is much faster for the intense swirler S3. This figure also demonstrates the narrow region where a triple swirler can provide a desired swirl-jet angle.
The gathered data for all swirlers can be summarized into a diagram covering the three main variables of Va, Lvand γ. By manually setting the cases showing jet-like behavior to zero and table look-up interpolation using MATLAB command interp2,the diagram is generated, and presented in Fig. 13. It is noteworthy that at this stage, a linear relation between the interpolated regions was assumed and the refinement factor for the interpolation was set to 5 to achieved more accurate result. The diagram allows us to correlate the vane angle and length in order to generate a swirling jet with the desired swirl-jet angle. Regions where flow may represent a jet-like pattern or when the swirling jet is attached to the chamber bottom can be clearly distinguished for low or high swirl-jet angles, respectively. The diagram indicates that, for instance, in order to achieve a swirl-jet expanding in 50 degrees at the exit of swirler while keeping the vane length as short as 4 mm, the radial vane angle (Va) should be designed to 36°. The diagram also indicates that for the same situation, the desired swirl-jet angle could not be achieved withmm, and the angle would be decreased. In contrast, if with respect to the design criteria, the vane angle should be as high as possible (here 50°) to reduce the outer swirler diameter in order to acquire a 45° swirl-jet angle, the vane length should be set tomm. One should notice the difference between γ and the actual shear layer angle. With regard to Fig. 12(a), the shear layer angle could be relatively less than the swirl-jet angle given via Eq. (9). Nevertheless, this diagram will be used later on to revise the earlier design procedure, but it is important to note that it is solely applicable to cases with a passage width of 6 mm.

Fig. 11. Gradient of a axial, b radial, and c velocity components along the line.
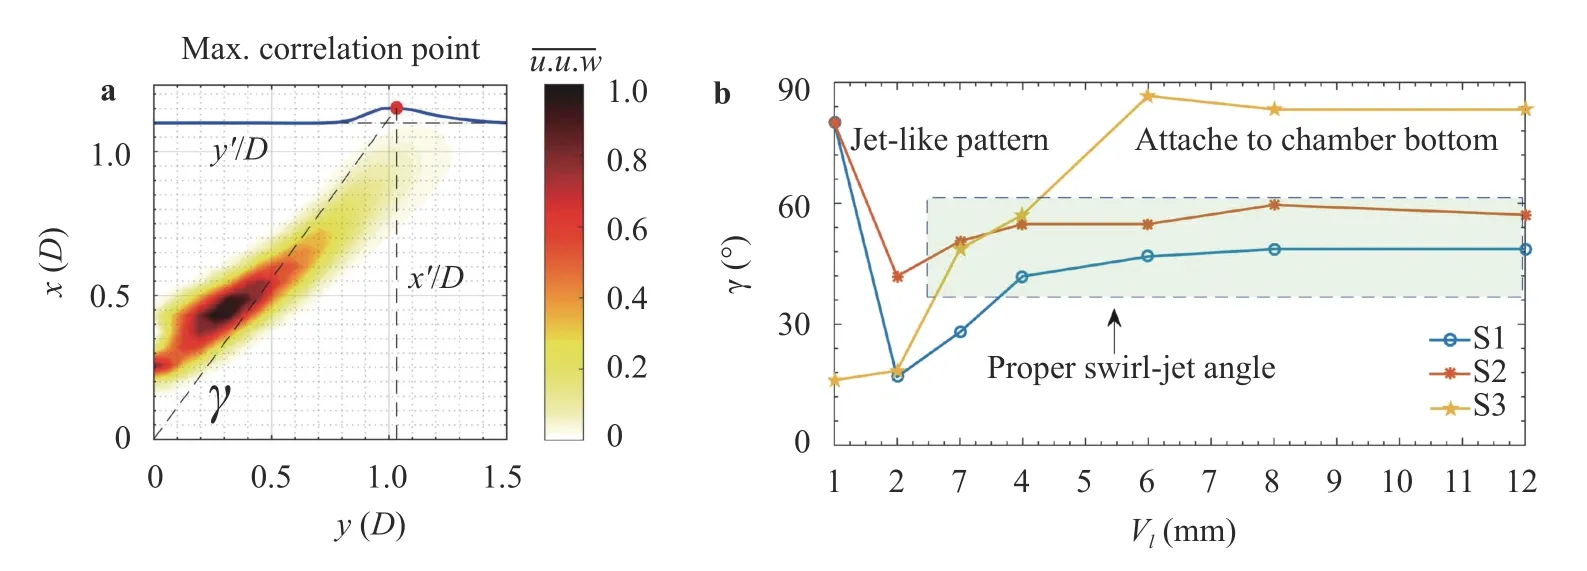
Fig. 12. Definition of and its relation to the radial swirler vane length. a Contour of maximum correlation and definition of and b variation of with radial vane length.
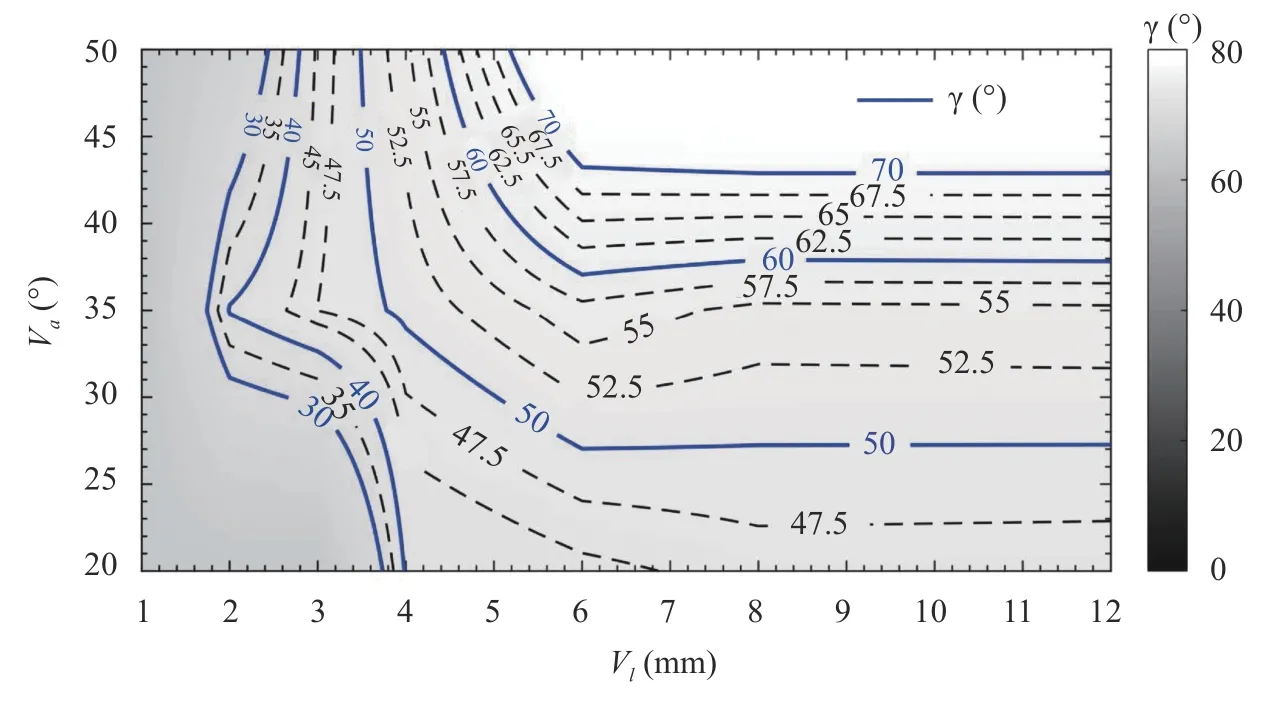
Fig. 13. Diagram of the vane angle verses vane length verses swirl-jet angle.
3.3 Effect of radial swirler passage width
The passage width varies from 2 to 10 mm with intervals of 2 mm, leading to a total of five simulations limited to a single swirler S1 in which the swirling jet angle is desirable. The partial contour views are presented in Fig. 14. The presented contours sufficiently highlight the importance of Ω on the flow field. By modifying the discharge coefficient of the swirler, the passage width defines the exit velocity and the development angle of the swirling jet. For low passage width values, a jet-like flow was formed. As Ω increases, the swirling jet diverges towards the chamber wall and remains almost constant for passage widths of 8 and 10 mm. This result proves that although swirler S3 suffered from unnecessarily lengthened radial vanes, the desired expansion angle can still be achieved by modifying the passage width within a certain critical range.
The profiles of the three velocity components aty/D = 0.26 are presented in Fig. 15. The axial velocity magnitude continuously decreased with an increase in Ω, and the peak location diverged (see Fig. 15(a)). In contrast, the depiction of the radial velocity in Fig. 15(b) suggests a significant increase, while the tangential velocity magnitude remained constant. Additionally,from the radial velocity profile, traces of two opposite rotating shear layers are visible throughout all cases. While different vane lengths affected the development of radial and tangential velocity components, interestingly, the passage width controls the axial and radial velocity components and has little influence on the swirl component. The most significant effect on the swirl component, demonstrated in Fig. 15(c), is giving rise to the role of the mixed flow of the inner and intermediate swirling motion with a decrease in the passage width. This evidently occurs due to the reduction in the discharged mass flow of the outer swirler by blocking the exit. It is noteworthy that passage width played an important role in determining the interaction ratio between the outer swirler with the two inner and intermediate ones. This finding is evident where with an increase in the passage width,the number of peaks on each side of the swirler increased from 1 at Ω = 2 mm to 2 for Ω ≥4 mm.
The behaviors of the peak points are investigated in Fig. 16.From Fig. 16(a), it can be seen that the decay in the peak of the axial velocity is more significant than the other two components.It reduced from a maximum of 20 to 6 for minimum and maximum simulated passage widths. Meanwhile, the maximum radial velocity increased relatively and the swirl component, with a minor increase up to Ω = 6 mm again reduced to its initial value at Ω = 10 mm. The gradient plot in Fig. 16(b), however, indicates that for different Ω, all three components vary as expected. The gradient of the axial velocity remained constant (–1.5) while the radial and tangential components decayed to approximately zero for Ω >6 mm.
A correlation contour map similar to that of radial vane length is constructed for the passage width parameter, and its contribution to the swirl-jet angle is quantitatively determined,as depicted in Fig. 17. While Ω <4 mm depicts regions with a jetlike flow pattern, the swirl-jet angle increased monotonically forΩ >4 mm from 5 0◦to approximately 6 5◦. This finding implies that the role of passage width in controlling the wall impinging point and the expansion angle is as important as the length of radial vanes. Altering either radial vane length or passage width provides control over determining the swirling jet emerging angle and defining the stagnation point on chamber walls.
4 Concluding remarks
A designed set of three kinds of previously investigated triple swirlers revealed the existence of the Coanda effect when the swirl intensity at the outer swirler increased. The results suggested the domination of the radial swirler on the flow field, mainly due to its portion of the inlet flow rate. The design process of the swirlers was mainly based on basic assumptions due to a lack of available known parameters, particularly for the radial swirler,which required an excessive number of assumptions. Experimental data suggested that the preliminary design process neglects important features, such as passage width, and does not provide an accurate estimation for the length of radial vanes.This finding was observed with the conducted experiments for high-intensity swirlers (S3), where an obtuse angled swirling jet was developed (close to 180°) that attached to the bottom of the chamber in a confined test and was parallel to the swirler exit surface in an unconfined experiment.
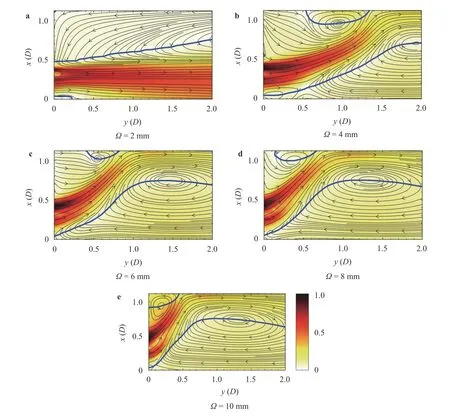
Fig. 14. Effect of radial swirler passage width on the swirling flow field. Contours are acquired from RANS simulations and represent the velocity magnitude normalized to. Colorbar for all contours is shared in Fig. 14(e). Solid blue and black lines show the enclosed region of negative axial velocity and streamlines, respectively.
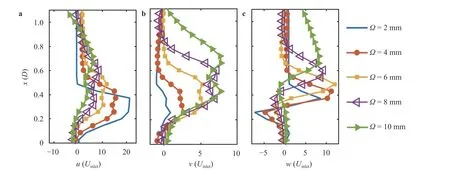
Fig. 15. Normalized velocity profiles on for different passage widths. a Axial velocity, b radial velocity and c tangential velocity. Due to symmetry only half of the flow field is depicted.

Fig. 16. Maximum peak of normalized velocity acquired along the line and its relative gradient between various simulated cases.a Peak of velocity components and b gradient of peaks with various.
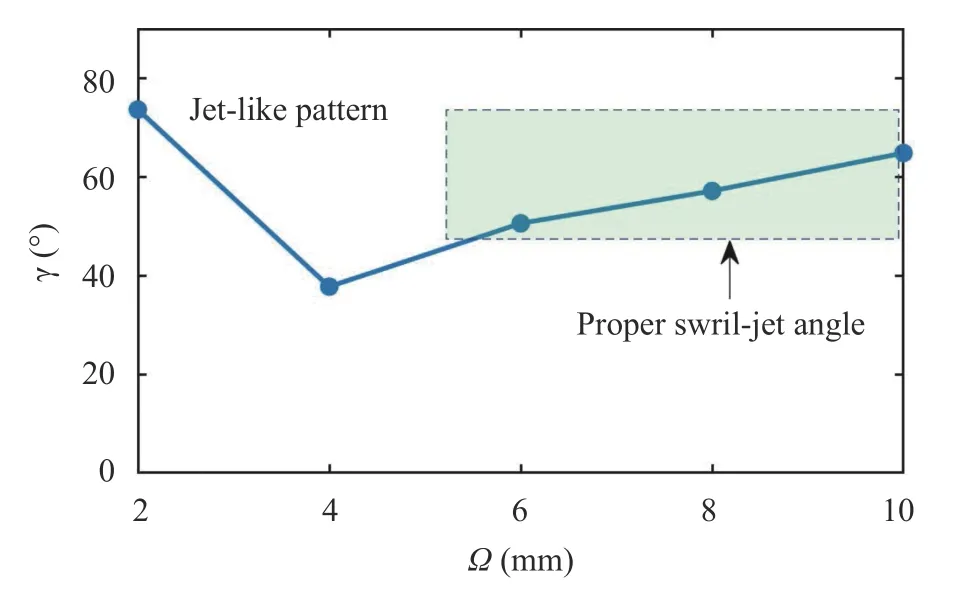
Fig. 17. Variation of with passage width.
To remedy the problem, a set of RANS simulations were conducted to investigate two important geometrical parameters: the length of radial vanes and the passage width. It was found that for a critical vane length, all three velocity components suffered from an abrupt change in their profiles the axial velocity decreased with an increase in radial and tangential velocity close to the exit of the swirler. The flow pattern for a vane length less than the critical value showed a jet-like behavior and attached to the chamber bottom for larger values. The results suggested a diagram with three variables of vane angle, vane length and swirling jet expansion angle, whereby knowing two parameters made the third one available. In terms of passage width, similar observations were made regarding the ability to control the flow expansion angle from jet-like to the point with a maximum accessible angle related to swirl intensity. It was concluded that whether a low or intense swirl is applied at the radial swirler, the Coanda effect could be avoided by controlling radial vane length or passage width, allowing for the control of swirl-jet radial expansion. The provided diagram is effectively able to control the resultant swirl-jet angle for the imposed swirl intensity. The modified radial vane length could then be used to revise the initial passage width.
5 Notes on future work
The data provided in the present manuscript is part of a project to develop design methodology for triple swirlers. The project aims to employ both experimental and simulation data to summarize the main cold-flow features and give insight into the importance of geometrical parameters, which have previously received minor attention. While the main flow field of swirlers S1, S2 and S3 are already published in Ref. [32], more experimental data are being considered for publication regarding the influence of the interaction point of the adjacent swirlers by modifying the passage length ( χ) (see Fig. 1). With regards to this, the design process employed for S1, S2 and S3 is then revised by the diagram provided in Fig. 13 and its relation to passage width. To date, the design methodology has been completed, and preliminary studies on the flow field showed satisfactory results in terms of the applicability of the data demonstrated within this manuscript. However, the scope of the current manuscript does not allow us to introduce the design and requires another publication revolving around the design of swirlers and related equations. As part of our future work, the initial design procedure, along with its essential revision using the provided data set, will be published so that a methodology to develop a triple swirler with a desired swirl-jet angle and flow distribution among swirlers are available. Within the design methodology the geometrical parameter, in particular, the radial vane length and passage width discussed here, are linked, and a design procedure for the radial swirlers to achieve a desired swirl-jet pattern is reported.
Acknowledgment
This research was supported by Korea Electric Power Corporation through Korea Electrical Engineering and Science Research Institute (Grant 18B-022).
杂志排行
Theoretical & Applied Mechanics Letters的其它文章
- Crack propagation simulation in brittle elastic materials by a phase field method
- Generalized canonical transformation for second-order Birkhoffian systems on time scales
- Modified slow-fast analysis method for slow-fast dynamical systems with two scales in frequency domain
- On time independent Schrödinger equations in quantum mechanics by the homotopy analysis method
- Creep relaxation in FGM rotating disc with nonlinear axisymmetric distribution of heterogeneity
- Dynamic response of clamped sandwich beams: analytical modeling
