Crack propagation simulation in brittle elastic materials by a phase field method
2019-12-01XingxueLuChengLiYingTieYulingHouChunzengZhng
Xingxue Lu, Cheng Li, Ying Tie, Yuling Hou, Chunzeng Zhng
a School of Mechanical Engineering, Zhengzhou University, Zhengzhou 450001, China
b Department of Civil Engineering, University of Siegen, D-57076 Siegen, Germany
Keywords:Brittle fracture Phase field method Crack propagation Finite element method
A B S T R A C T To overcome the difficulties of re-meshing and tracking the crack-tip in other computational methods for crack propagation simulations, the phase field method based on the minimum energy principle is introduced by defining a continuous phase field variable (x)∈[0,1] to characterize discontinuous cracks in brittle materials. This method can well describe the crack initiation and propagation without assuming the shape, size and orientation of the initial crack in advance. In this paper, a phase field method based on Miehe's approach [Miehe et al., Comp. Meth. App.Mech. Eng. (2010)] is applied to simulate different crack propagation problems in twodimensional (2D), isotropic and linear elastic materials. The numerical implementation of the phase field method is realized within the framework of the finite element method (FEM). The validity, accuracy and efficiency of the present method are verified by comparing the numerical results with other reference results in literature. Several numerical examples are presented to show the effects of the loading type (tension and shear), boundary conditions, and initial crack location and orientation on the crack propagation path and force-displacement curve. Furthermore, for a single edge-cracked bi-material specimen, the influences of the loading type and the crack location on the crack propagation trajectory and force-displacement curve are also investigated and discussed. It is demonstrated that the phase field method is an efficient tool for the numerical simulation of the crack propagation problems in brittle elastic materials, and the corresponding results may have an important relevance for predicting and preventing possible crack propagations in engineering applications.
1 Introduction
Fracture is a major failure mode in engineering materials and structures. However, fracture is usually a rather complex phenomenon and its adequate description is quite difficult in practice. Therefore, it is an important task to simulate and predict the initiation, growth and branching of possible cracks by computational models for practical engineering applications.
The classical theory of brittle fracture in elastic solids, that a crack propagates if the energy release rate reaches a critical value, was first proposed by Griffith [1] and Irwin [2]. Even though it provides a criterion for crack propagation, it fails to account for the crack nucleation, curvilinear crack paths, crack kinking or branching. In last decades, many numerical simulation methods were developed to model different crack propagation problems. However, each has its own advantages and drawbacks. The well-established classical finite element method(FEM) [3, 4] usually needs to adjust the mesh or re-meshing in the crack propagation simulation. On the other hand, the node splitting [5], interface (cohesive) element formulation [6–8], and discrete element model [9] are strongly mesh dependent. Moës et al. [10] introduced the extended FEM (X-FEM) to avoid the abovementioned problems by using a local enrichment in the shape functions of the FE formulation [11, 12]. A computational scheme based on the configurational forces was adopted for crack propagation simulation by Gürses and Miehe [13].Moreover, Francfort and Marigo [14] proposed a variational model of quasi-static crack evolution based on the energy minimization which can overcome the weaknesses of the original approach of Griffith. Some other related research works have been also done in the past [15–19]. Bourdin et al. [17, 20] studied the regularized setting of their framework in Γ−convergence based on the work on image segmentation of Mumford and Shah [21]. A regularized approximation of the brittle fracture by a scalar auxiliary variable was described in the phase field approaches [22–24], which assumes that a sharp crack is continuous in the solid. The variable connecting the unbroken and the broken states of the material is considered as a phase field. In recent years, the research related to the phase field formulation is receiving more and more attention. The main reason lies in the fact that in the phase field method, no additional ad-hoc criteria are required to simulate the crack initiation, propagation, kinking, branching and so on. Among many recent research works on this topic, we just mention a few of them, such as the quasistatic fracture [25–29], dynamic crack propagation [30–33], finite deformation [34, 35], multi-physics problems [36, 37], and so on[38–42]. Moreover, the phase field method has been also extended to simulate the crack growth problems in the anisotropic materials [43–45].
Although many research works on the phase field method have been reported in literature so far, few works have been yet devoted to a detailed study on the effects of the key factors such as the size, location and orientation of the initial crack, and the loading type (tensions and shear) on the crack propagation characteristics. The main purpose of this paper is to present an efficient and accurate phase field method for crack propagation simulation in two-dimensional (2D), isotropic and linear elastic materials, and to reveal the aforementioned essential effects.The corresponding results can be used to predict and avoid possible crack propagations in practical engineering applications,which is an important and indispensable issue for reliable design and optimization of advanced engineering materials and structures.
As previously mentioned, the continuous phase field variable ϕ is introduced to characterize the discontinuous cracks.So, we write the phase field, displacement field and mesh data at each loading step in the visualization toolkit (VTK) file format for plots to be viewed by using ParaView, which is an open-source,multi-platform data analysis and visualization software. We can optionally check and analyze the data and conveniently follow the process of the crack initiation and growth. It avoids the output of the graphical results which cannot be further analyzed.Besides, the present phase field code is implemented in MATLAB. We use the colon function to create a vector of indices to select rows, columns, or elements of arrays, especially select the number of the elements, and then multiply the arrays. In this way, a higher computational efficiency can also be obtained on the computers which cannot perform a parallel computing.
The remainder of this paper is structured as follows. In the next section, the key idea and the theoretical background of the phase field method based on Miehe's approach [22] are briefly reviewed. Section 3 describes the numerical implementation.The validation of the implemented phase field method is first presented in Sect. 4. Then, some representative numerical examples are given and discussed to reveal the influences of the loading type (tension and shear), and the size, location and orientation of an initial crack on the crack propagation path and the force-displacement curve, respectively. Moreover, the effects of the loading type, and the location of an initial crack in a bi-material plate on the crack propagation characteristics are also studied. Finally, Sect. 5 gives some conclusions.
2 Description of the phase field method
2.1 Phase field approximation of the crack topology
Let us consider a homogeneous, isotropic and linear elastic domain Ω ⊂R2with a crack Γ and the boundary ∂ Ω as depicted in Fig. 1. In a regularized framework, the crack geometry is a"smeared" representation defined by an auxiliary field variable ϕ(x) ∈[0,1], x ∈Ω, which is denoted as the crack phase field as illustrated in Fig. 1(b). The un-cracked and fully cracked states of the considered domain are characterized by ϕ = 0 and ϕ = 1, respectively.
According to Griffith's theory [1], an existing crack will propagate when the energy release rate G associated with the crack extension exceeds a critical value equal to the material fracture toughness Gc. However, the Griffith's theory has a shortcoming which cannot accommodate the crack nucleation or predict the branching of fracture. The variational approach to fracture mechanics proposed by Francfort and Marigo [14] introduces the following energy functional for the cracked body

where Ed(u,Γ) is the elastic energy stored in the cracked body,Es(Γ)represents the energy required to create the new crack according to the Griffith theory, ψ is the elastic energy density function, ε is the strain tensor, u is the displacement vector, Gcis the critical energy release rate, and H1is the Hausdorff surface measure giving the crack length. With the assumption of small deformation, the strain tensor is related to the displacement vector by
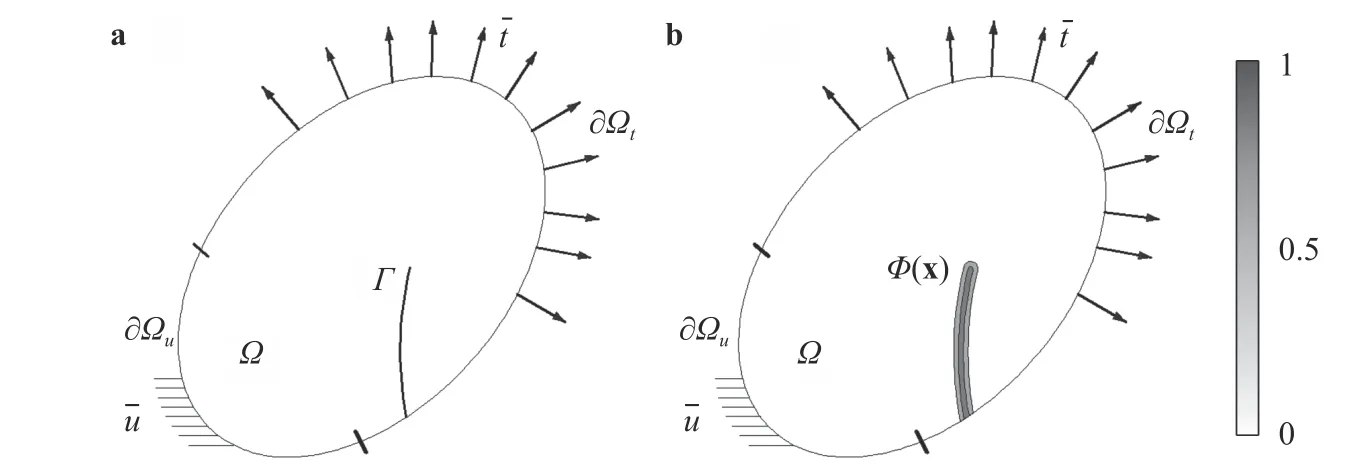
Fig. 1. 2D sharp and diffusive crack topology: a sharp crack model, b regularized representation of a crack by phase field approximation.
To consider the crack phase field, the energy functional Eq.(1) can be expressed as the following functional

where γ(ϕ,∇ϕ) denotes the crack density function per unit volume, l is a regularization parameter describing the width of the smeared crack and recovers for l →0 the sharp crack topology. It should be noted here that the regularization parameter l in the conventional phase field model may significantly affect the crack propagation path and the corresponding peak-load if it is not appropriately chosen.Frequently, two ways are suggested to determine l, either by considering it as a pure numerical parameter of the regularized model of the brittle fracture or as a real material parameter of a gradient damage model [19]. More detailed descriptions on how to choose an adequate value of l can be found in Refs. [19, 26, 31,42, 46]. Moreover, the element size h may also have significant influences on the numerical convergence of the mechanical responses. Miehe et al. [23] suggested that the conditionh ≤l/2 has to be fulfilled. In this aspect, the length-scale insensitive phase field model developed by Wu [28], Wu and Nguyen [42]should be particularly mentioned.
2.2 Strain energy degradation in the cracked solid
For a homogeneous, isotropic and linear elastic solid without damage, the elastic energy density function can be written as

where λ and µ are the Lamé constants. Since the elastic energy is released only in tension but not in compression, the degradation of the elastic energy due to fracturing can be described by

with g (ϕ)=(1−ϕ)2as given in Refs. [22–24], k ≪1 is a small positive parameter used to maintain the well-posedness of the system for the fully cracked state ϕ = 1. The strain field is decomposed into positive and negative parts in order to account for the stress degradation only in tension, i.e.,

with the superscripts " ±" describing the tension and compression modes. Based on the spectral decomposition of the strain tensorwe obtain

where εiare the eigenvalues and niare the corresponding eigenvectors of ε. The bracket operators in Eqs. (5) and (7) are defined byTwo projection tensors are defined for the derivative of Eq. (6) with respect to the total strains as

where I is the identity matrix. The fourth-order tensors in Eq. (8)project the total strains onto their positive and negative parts, i.e.andFor more details one can refer to the Refs. [22, 24, 47, 48]. So the total potential energy function Eq. (2)can be rewritten as

2.3 Variational formulation and phase field evolution equation
As shown in Fig. 1, the exterior boundary of the considered domain can be decomposed into two parts ∂Ωuand ∂Ωt,∂Ω = ∂Ωu∪∂Ωt. The Dirichlet- and Neumann-type boundary conditions are applied. The first variation of the external work,δWext, can be written as

where b and t are the body force vector and boundary traction vector on the surfaces ∂ Ω, respectively. For the first variation of the internal work or elastic strain energy, δ Wint, we have

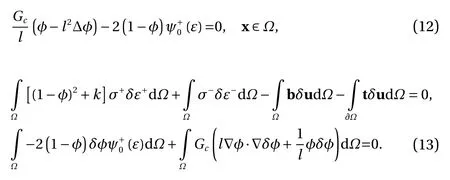
Equation (12) is the phase field evolution equation which implies that the phase field variable ϕ is a function of
3 Numerical implementation
The coupled system of equations given in Eq. (13) can be solved numerically in a classical finite element framework. The displacement field and the phase field in 2D cases are approximated by

where uuand ϕϕare the vectors consisting of the nodal displacement and phase field values, respectively, Nuand Nϕare the shape functions associated with the nodes. The strain field and the gradient of the phase field can be obtained as

in which Buand Bϕcontain the derivatives of the shape functions. Then, Eq. (13) can be written as ergy function H is defined here as described in the work of Miehe et al. [22].

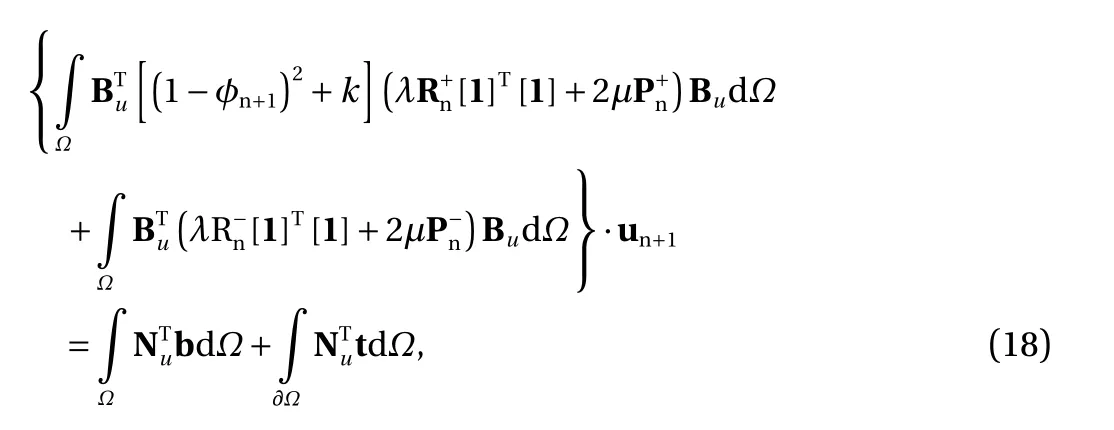
The staggered algorithm [22, 24] is used to solve Eq. (16). In order to guarantee the irreversible evolution of the phase field which corresponds to the crack healing, a local history strain en-
In each step, we first solve the phase field equation

and then the momentum equation
The phase field model based on Miehe's approach has been implemented in MATLAB. For the calculations of the strains,stresses and strain energy, we did not adopt the parallel calculation because of the available computer configuration. We used the colon function in MATLAB to create a vector of indices to select rows, columns, or elements of arrays, especially select the number of elements, and then multiplied the arrays. For instance, the following MATLAB commands were used to calculate the strains in each element at the Gaussian points:
for i =1:ncompon
for j =1:ndof
strain(:, igaus, i) = strain(:, igaus, i) +B_u(:, i, j).*displa(:, j);
end
end
Here, "ncompon" is the number of the strain components,"ndof" is the number of the degree of freedom in each element,the colon ":" denotes the number of the element, "igaus" is the number of the Gaussian point, "B_u" is the matrix of the derivatives of the shape functions in Eq. (15), and "displa" is the nodal displacement vector in each element. In this manner, a high computational efficiency can also be achieved on the computers which cannot perform a parallel computing.
For the data post-processing, the phase field, displacement field and mesh data at each loading step are written in the VTK file format according to the format requirements, which can be viewed by using ParaView. The open-source, multi-platform data analysis and visualization software ParaView is easy to learn and master. Using the "Hover points on" icon, we can optionally check the data at each node. The animation view, color maps for pseudo-coloring datasets and crack pattern can be achieved by using the "Animation View", "Choose Preset" and "Save Screenshot Options" icons, respectively. In this way, a convenient and efficient data post-processing can be realized.
The values of the phase field variable are obtained based on the element nodes, thus the mesh is refined in the area where the crack is expected to extend. The linear triangular and quadrilateral elements are used in this work. However, the disadvantage of the low computational accuracy of the triangular elements can be improved by the local mesh refinement. Moreover,the triangular elements are more suitable to simulate the crack propagation of inclined cracks and require lower computational cost than the quadrilateral elements. As the staggered algorithm is extremely robust, the present phase field method is a convenient and efficient numerical tool for the simulation of the crack propagation problems.
4 Numerical examples
4.1 Model verification
In the first numerical example, the main purpose is to validate the phase field modeling as described in the previous sections. We consider a square plate with a horizontal rectangular notch as a crack. In order to capture the crack trajectory properly, the mesh is refined in the area where the crack is expected to extend. Following Ref. [23], the maximum element size in this refined zone is chosen as one half of the length scale parameter l . The minimum element size is h ≈0.001 mm in the critical zone. The width of the notch is also taken as one half of the length scale parameter l.
If not explicitly stated otherwise, the following numerical examples are assumed to be in plane strain, homogeneous, isotropic and linear elastic with the material parameters:λ=121.15 kN/mm2, µ =80.77 kN/mm2, Gc=2.7×10⁻³kN/mm, and the length scale parameter is chosen as l = 0.0075 mm [22-24].The geometry and the boundary conditions of the considered problem are depicted in Fig. 2. For the tension load as shown in Fig. 2(a), the displacement on the lower boundary (y=0) of the specimen along the y-direction is fixed, while a uniform displacement load on the upper boundary is increased continuously. The displacements along the x-direction on both upper and lower boundaries are free. However, the node (x=0, y=0) is fixed to prevent the rigid body motion. The boundary conditions for the shear deformation as depicted Fig. 2(b) are given as follows: the bottom side of the plate is fixed and the top side is subjected to a uniform displacement load ∆ u along the x-direction,while the displacement along the y-direction is fixed. Besides,the vertical displacements of the left side (x=0) and right side(x=1) are set to zero.
In the tension loading case, a loading increment∆u = 10−5mm is applied for 500 steps, then the uniform loading increment is changed to ∆ u = 10−6mm for the rest steps of the simulation. In the shear loading case, the displacement loading increment ∆ u = 10−5mm is applied for 1500 steps.
As shown in Figs. 3–5, the crack patterns and force-displacement curves predicted by the present phase field method are in excellent agreement with the results in Ref. [22]. By a closer look at the crack pattern it can be seen that the present phase field method can provide a higher resolution. The force-displacement curves computed by both methods show a slight difference when the force reaches the peak value, which is presumably caused by using different meshing in the calculations.
Then, we use the same specimen to simulate the crack propagation problems with different shear loading angles α between the positive x-axis and the loading direction as shown in Fig. 6(a). The angle β between the tangent line of the crackpath at the crack-tip and the positive horizontal direction is defined as the propagation direction of the crack. The results are illustrated in Fig. 6, which show good agreement with the results of Molnár et al. [27] and Bourdin et al. [17].
4.2 Single edge-cracked specimen with different lengths of the initial crack
In this subsection, the influence of the initial crack-length on the crack propagation is studied. The geometry of the specimen with different lengths (L=0.3 mm, 0.4 mm, 0.5 mm, 0.6 mm, and 0.7 mm, respectively) of the initial crack parallel to the x-axis is shown in Fig. 7. The vertical coordinate of the initial crack is constant as y=0.5 mm. The same material parameters, length scale parameter and boundary conditions as described in the Sect. 4.1 are used.
4.2.1 Pure tension loading
In the tension loading case, the loading increment∆u = 10−5mmis applied for 500 steps, then it is changed to∆u = 10−6mmfor the rest steps of the simulation. Figure 8(a) and 8(b) show the crack patterns and force-displacement curves. In all considered cases, the crack propagates nearly along the horizontal direction. The peak force and displacement decrease when the length of the initial crack increases. However, the respective peak forces have almost the same displacement value.
4.2.2 Pure shear loading
In this case, the displacement loading increment∆u =10−5mmis applied for 2000 steps. The geometry and the applied displacement loading are depicted in Fig. 7(b). Figure 9(a)and 9(b) illustrate the crack patterns and force-displacement curves, respectively. Here, we can observe the curved crack paths initiating with almost the same propagation direction β.
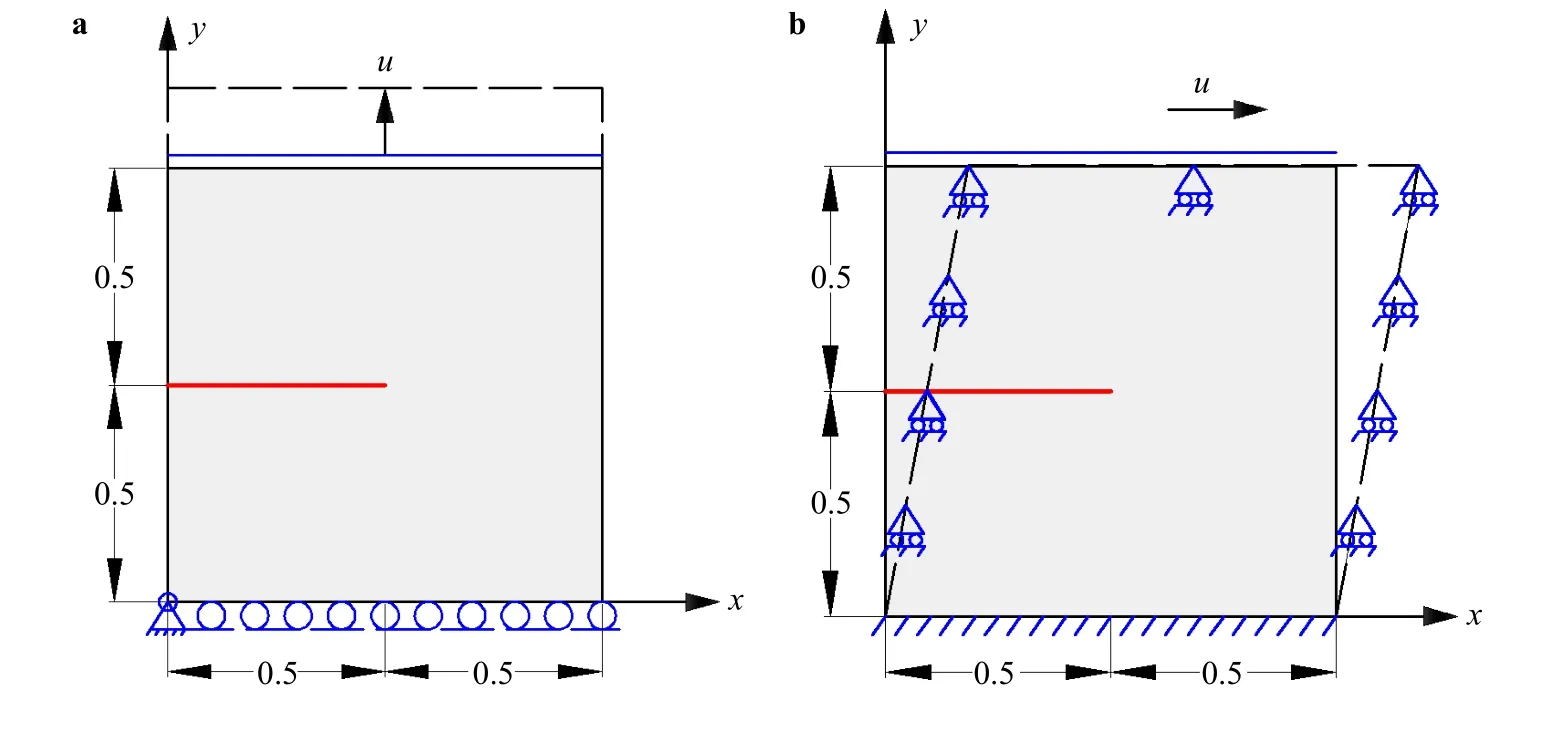
Fig. 2. Schematic of a single edge-cracked specimen: a pure tension loading, b pure shear loading.
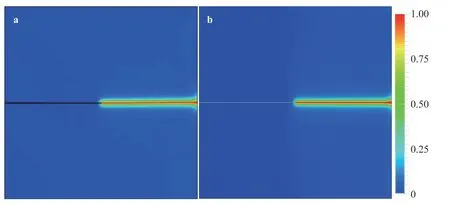
Fig. 3. Pure tension loading: a crack pattern of the phase field simulation in Ref. [22], b crack pattern of the phase field simulation in this paper.
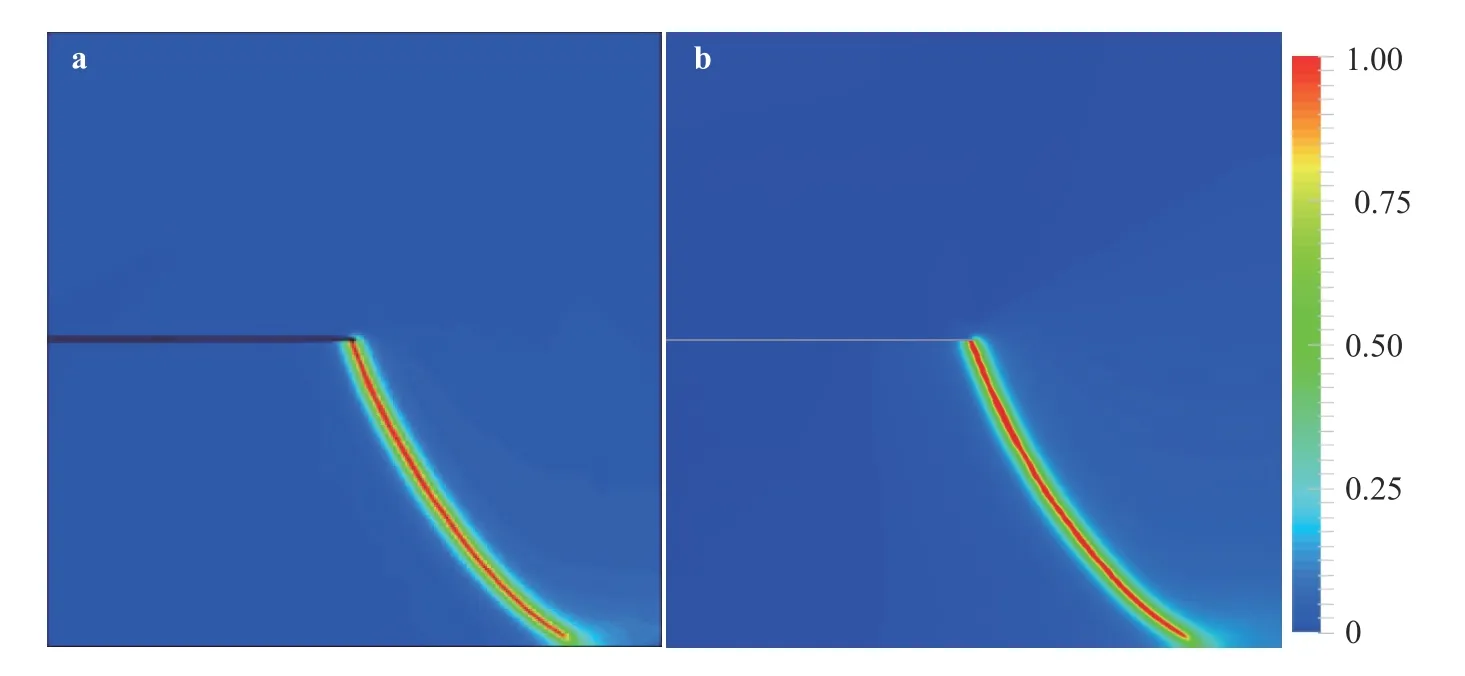
Fig. 4. Pure shear loading: a crack pattern of the phase field simulation in Ref. [22], b crack pattern of the phase field simulation in this paper.
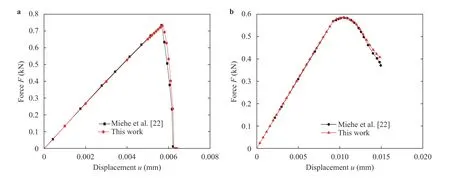
Fig. 5. Force-displacement curves compared with the results in Ref. [22]. a Pure tension loading, b pure shear loading.
The force decreases first and then increases after the first peak value. For each curve in Fig. 9(b), the first circle-mark indicates that the crack has been initiated and started to propagate, and the second circle-mark designates that the crack has been extended to the bottom or right side of the specimen. Moreover, as the length of the initial crack increases, the peak force gradually changes from large to small.
4.3 Single edge-cracked specimen with different locations of the initial crack
In this subsection, the influence of the initial crack location on the crack propagation is studied. The geometry of the edgecracked specimen with different y-coordinates (y=0.2 mm,0.3 mm, 0.4 mm, 0.5 mm, 0.6 mm, 0.7 mm, and 0.8 mm, respectively) of the initial crack parallel to the x-axis is shown in Fig. 7.The length of the initial crack is taken as L = 0.2 mm.
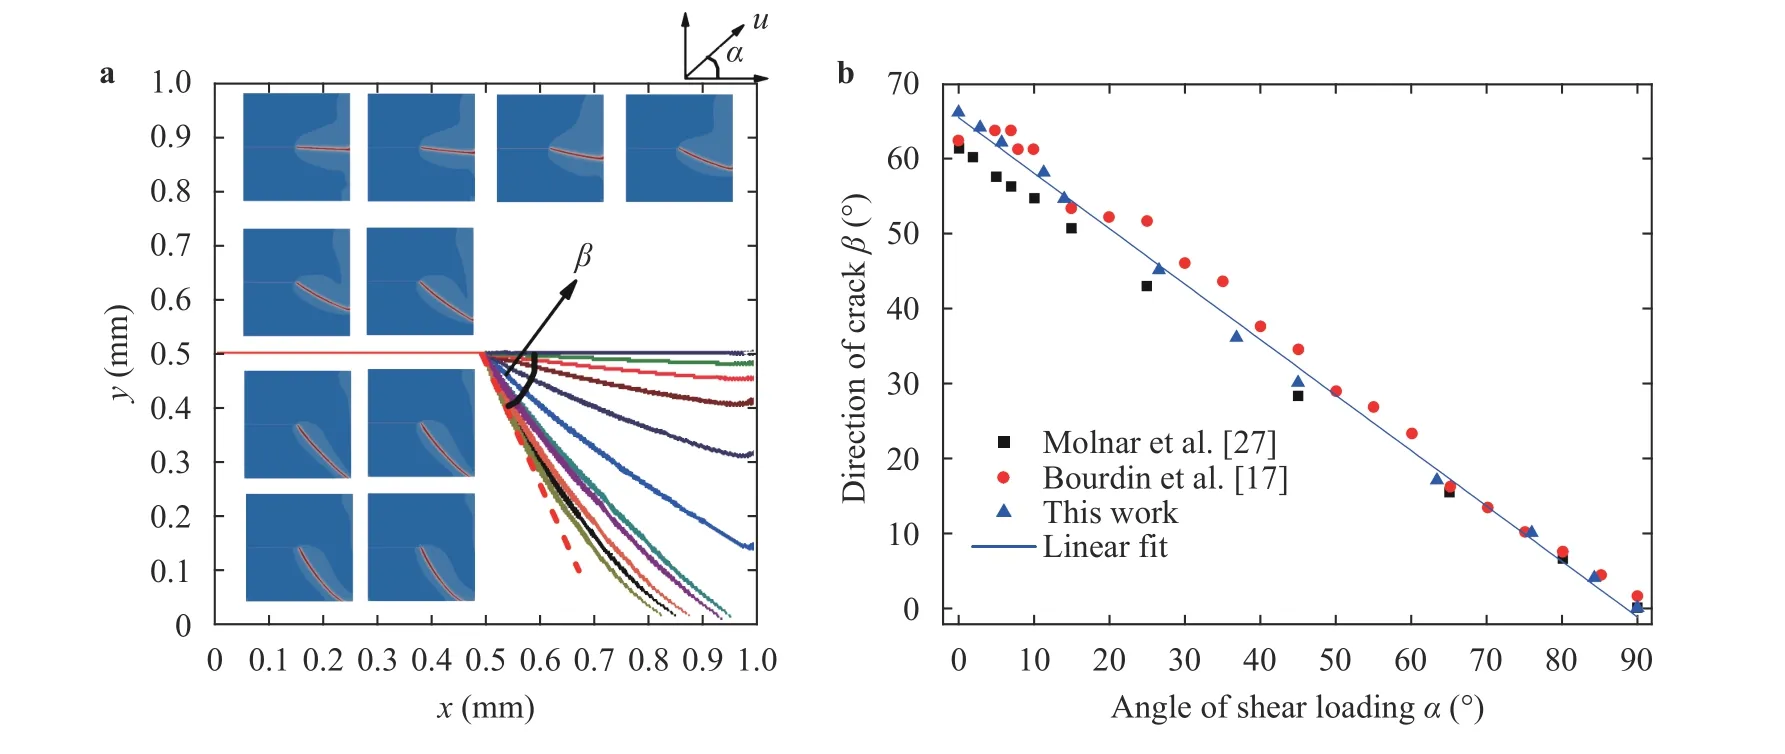
Fig. 6. a Crack patterns with different angles of shear loading α, b propagation direction of the crack β versus the angle of shear loading α.
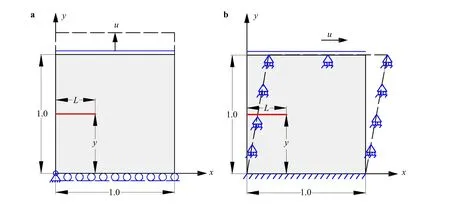
Fig. 7. Schematic of a single edge-cracked specimen with different lengths of the initial crack. a Pure tension loading, b pure shear loading.
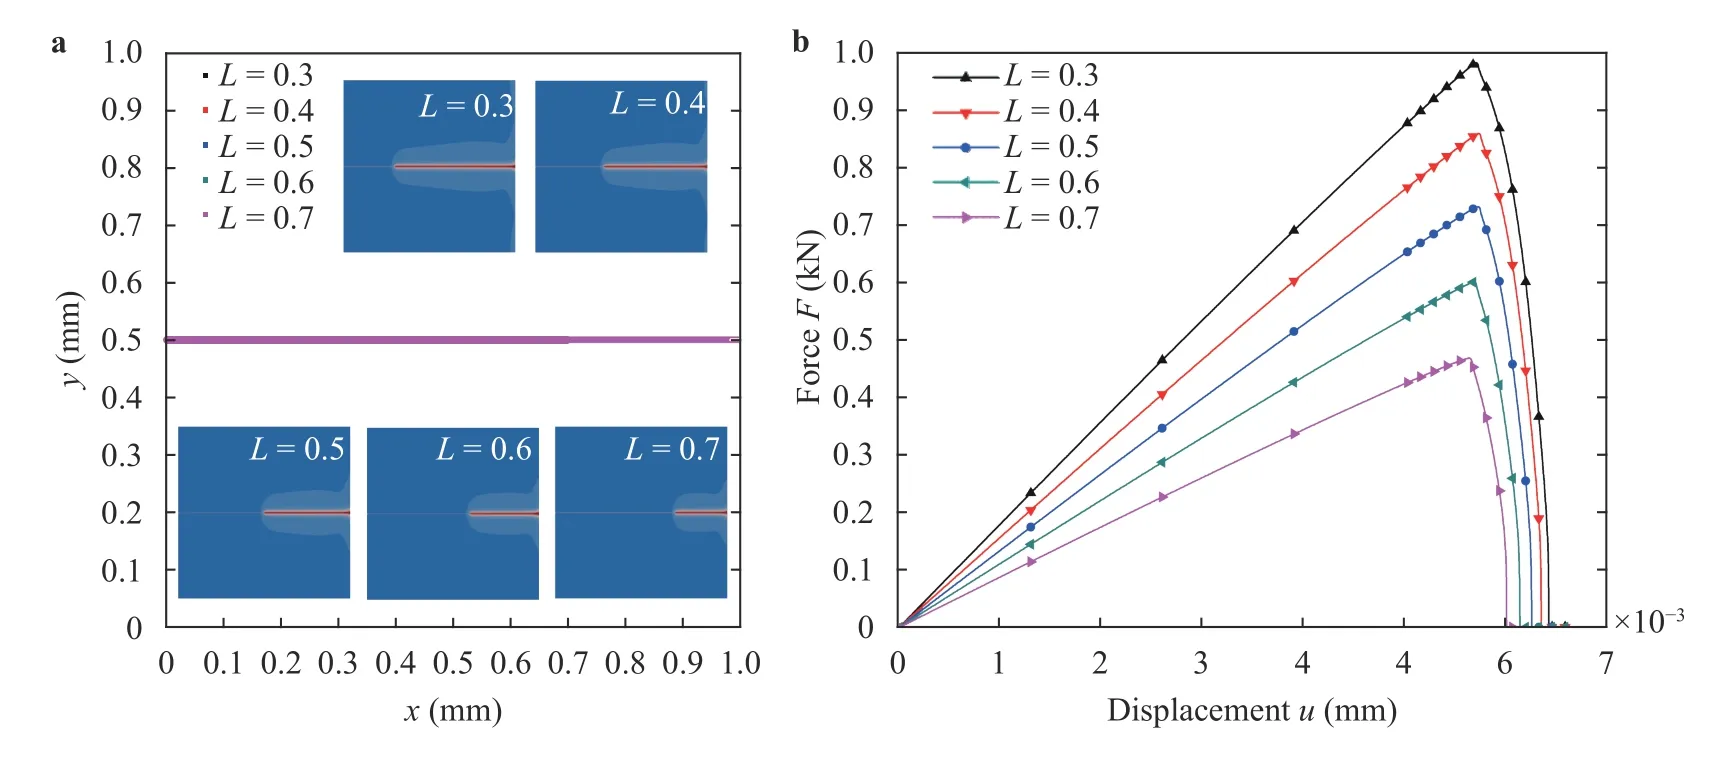
Fig. 8. Single edge-cracked specimen with different lengths of the initial crack under pure tension loading. a Crack patterns of the phase field simulation, b force-displacement curves.
4.3.1 Pure tension loading
Figure 10(a) and 10(b) show the crack patterns and force-dis-
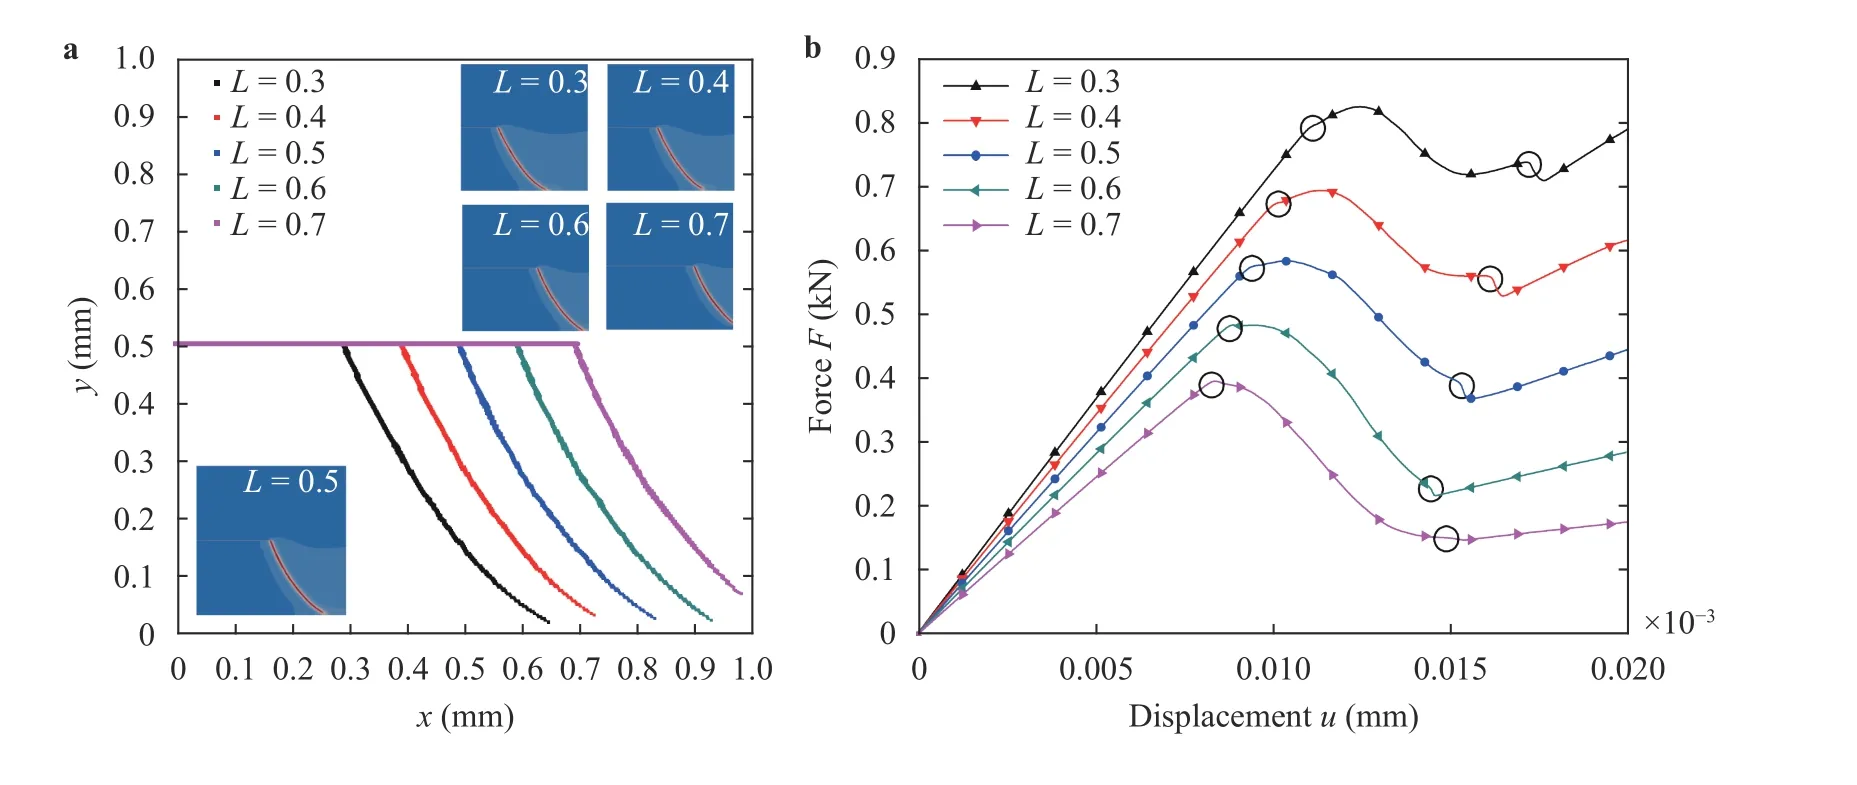
Fig. 9. Single edge-cracked specimen with different lengths of the initial crack under pure shear loading. a Crack patterns of the phase field simulation, b force-displacement curves.
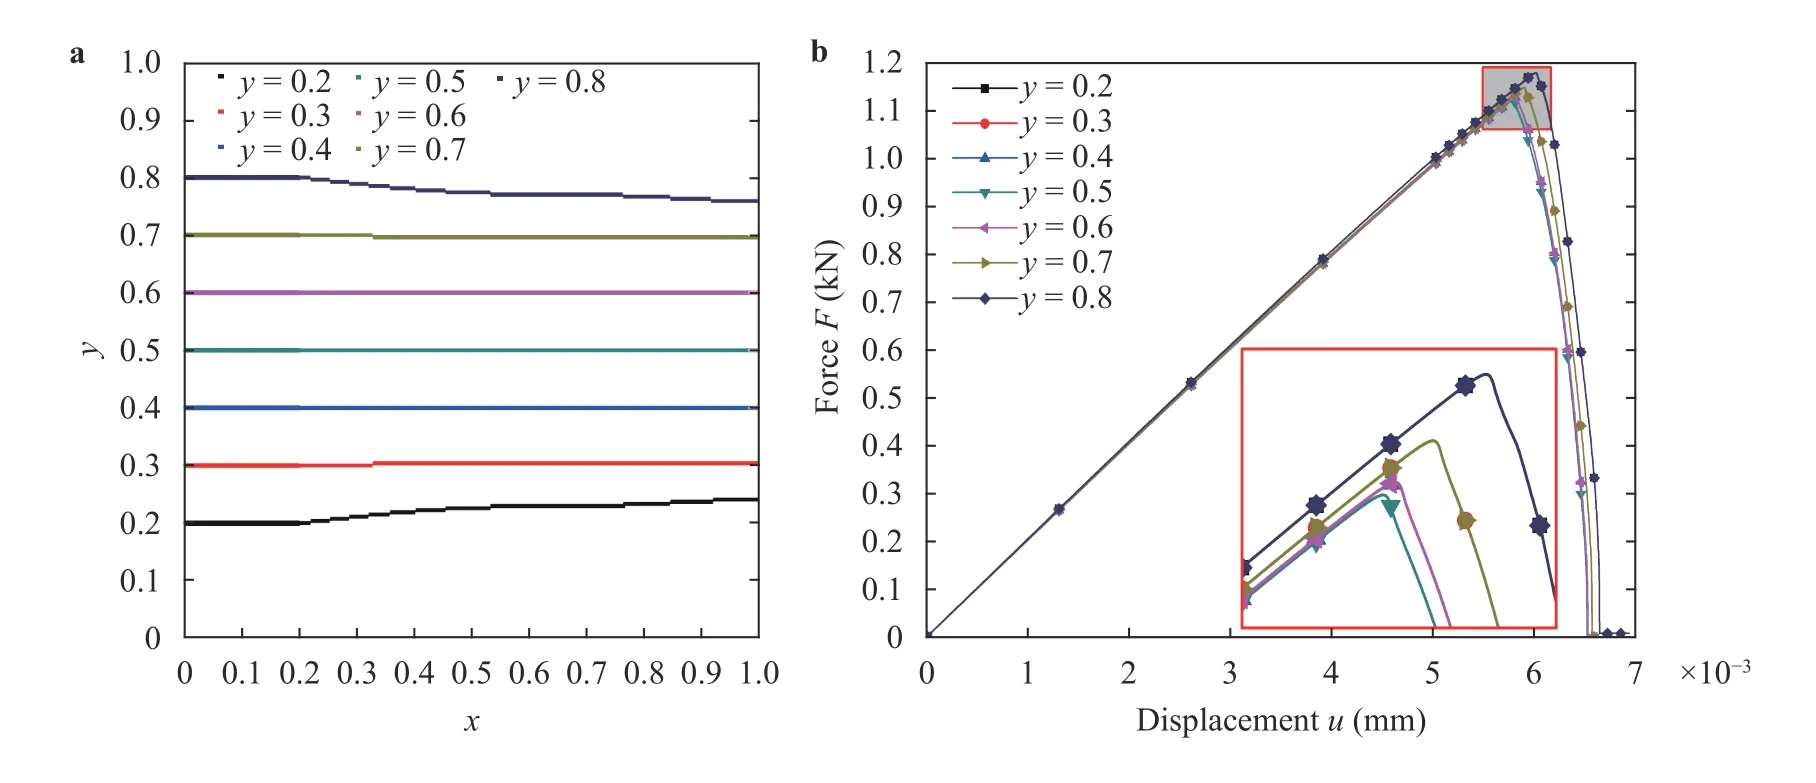
Fig. 10. Single edge-cracked specimen with different y-coordinates of the initial crack under pure tension loading. a Crack patterns of the phase field simulation, b force-displacement curves.
placement curves. We can see a symmetrical propagation tendency of the cracks towards the axis of symmetry (y=0.5) when the initial cracks are symmetric with respect to the symmetry axis,and they have almost the same force-displacement curve. The farther the initial crack away from the symmetry axis, the larger the peak force is.
4.3.2 Pure shear loading
For the pure shear loading case, the displacement loading increment ∆ u = 10−5mm is also applied for 2000 steps. The crack patterns and force-displacement curves are illustrated in Fig.11(a) and 11(b), respectively. The propagation tendencies of the cracks are very similar when a pure shear loading is applied. The force-displacement curves in Fig. 11(b) have nearly the same first peak value and the same corresponding displacement as in the case when the initial cracks are symmetric with respect to the axis of symmetry (y=0.5). An initial crack farther away from the symmetry axis shows a larger first peak force, which is similar to the tension loading case. The force decreases first and then increases after the first peak value. As the distance of the initial crack to the bottom side (y=0) increases, the force becomes lager gradually. The reason is that the initial crack closer to the bottom side has a shorter crack trajectory. When the crack is closer to the bottom side, the constraint of the left bottom side below the crack decreases gradually, but it keeps the same constraint at the right bottom side. These conditions will make the specimen can bear a larger force.
4.4 Single edge-cracked specimen with different inclination angles of the initial crack
This subsection investigates the propagation of an inclined crack in the same square plate as considered in the previous examples. The geometry of the plate and the inclination angles of the initial crack ( θ=15°, 30°, 45°, 60°, and 75°, respectively) are shown in Fig. 12. The crack-length is taken as L=0.2 mm.
4.4.1 Pure tension loading
For the pure tension loading as depicted in Fig. 12(a), the crack patterns and the force-displacement curves are given in Fig. 13(a) and 13(b), respectively. The smaller the inclination angle of the initial crack, the smaller the corresponding peak force. But in all considered cases, the cracks propagate nearly toward the horizontal direction parallel to the top and bottom boundaries of the specimen.
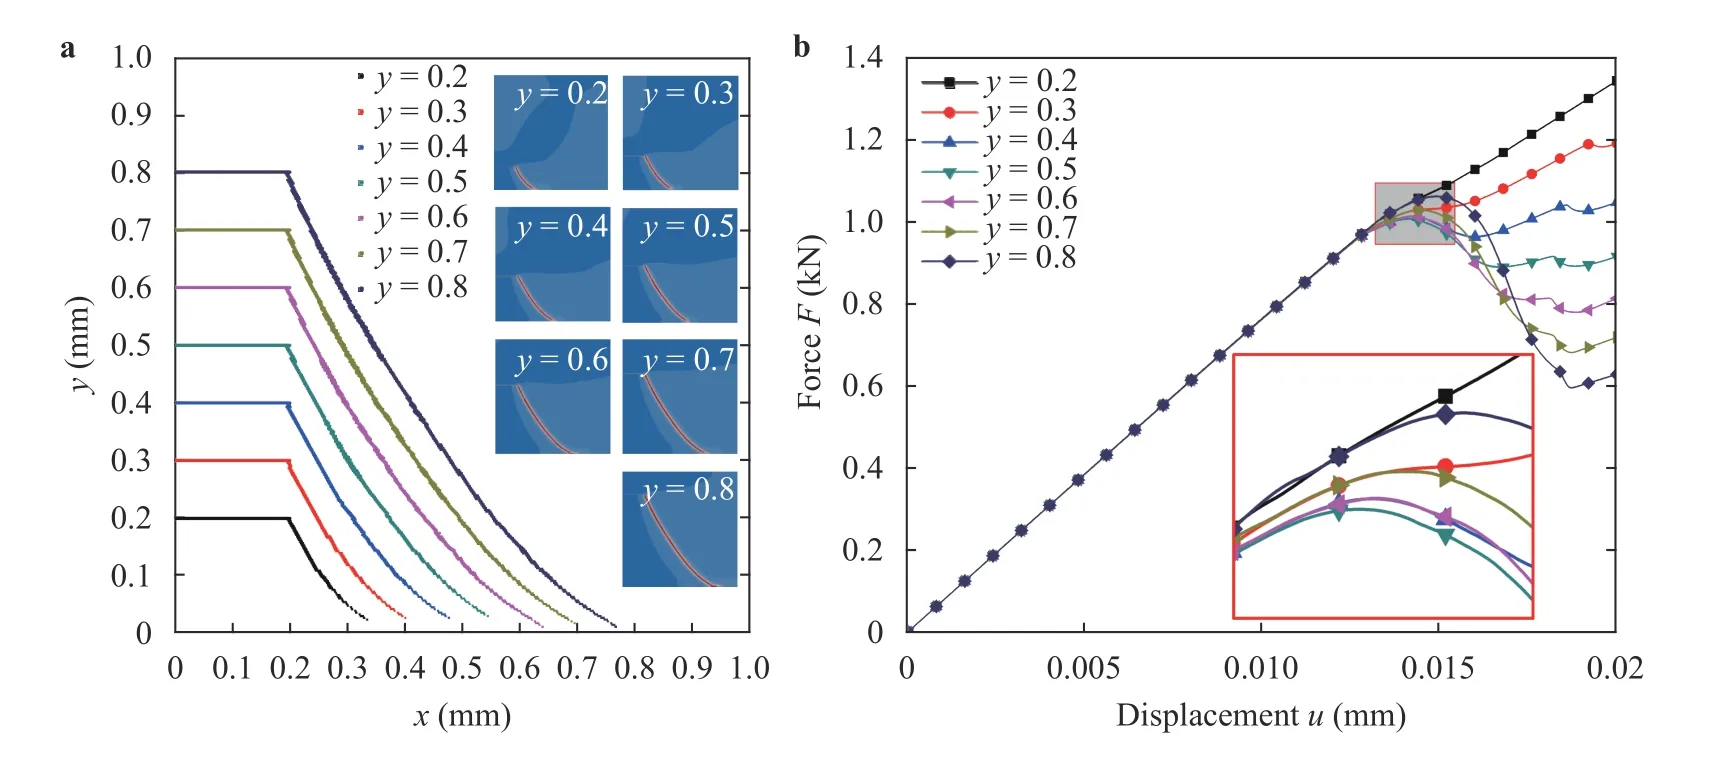
Fig. 11. Single edge-cracked specimen with different y-coordinates of the initial crack under pure shear loading. a Crack patterns of the phase field simulation, b force-displacement curves.
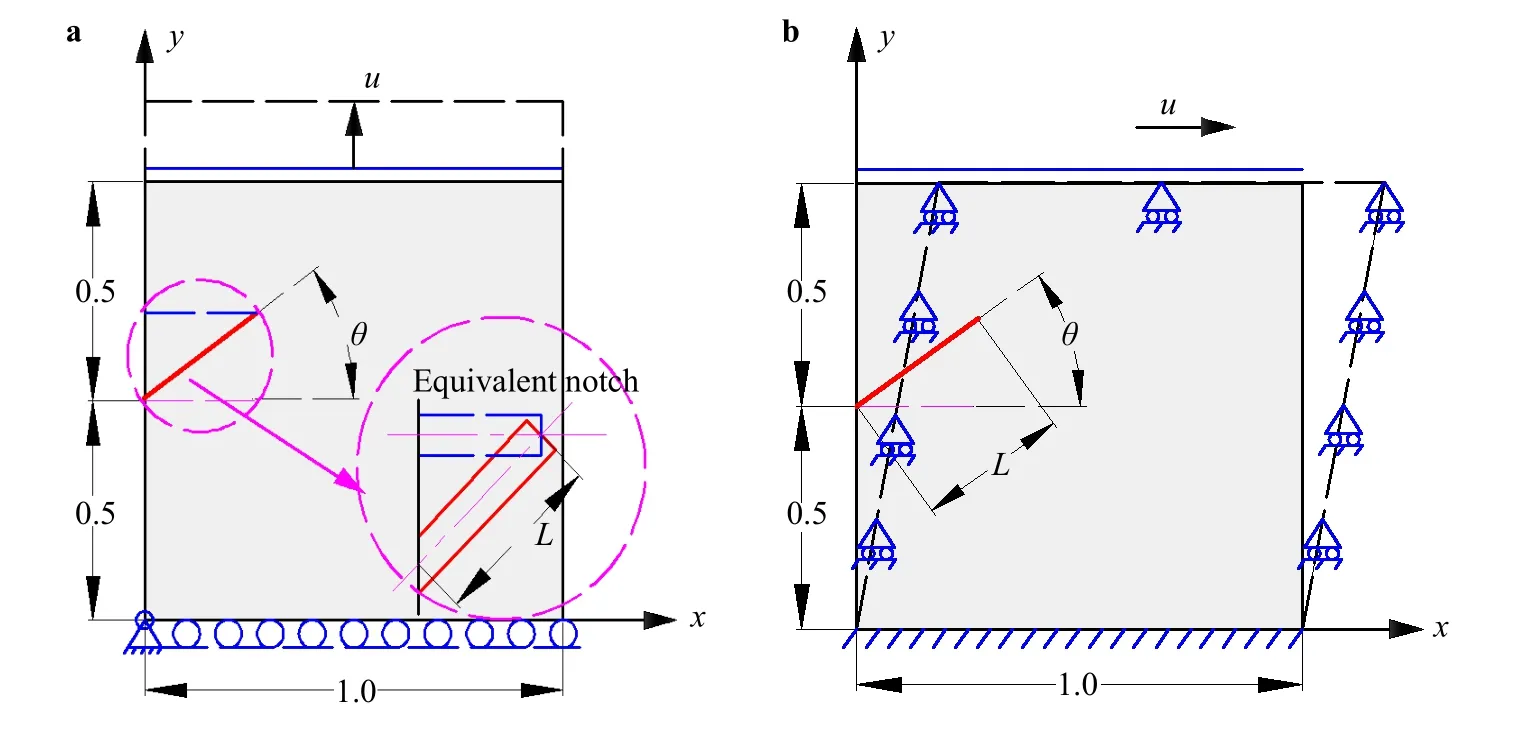
Fig. 12. Schematic of the single edge-cracked specimen with different inclination angles of the initial crack. a Pure tension loading, b pure shear loading.
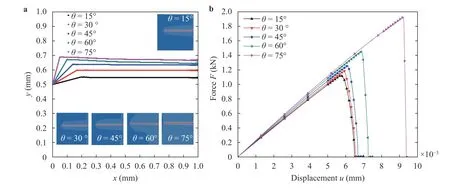
Fig. 13. Single edge-cracked specimen with different inclination angles of the initial crack under pure tension loading. a Crack patterns of the phase field simulation, b force-displacement curves.
We also consider an equivalent horizontal crack, which is the projection of the inclined crack on the horizontal axis as shown in Fig. 12(a). The processes of the crack propagation for different inclination angles (θ = 15◦, 30°, 45°, 60° and 75°, respectively)of the initial crack and the corresponding equivalent horizontal crack are simulated, respectively. Figure 14(a) and 14(b) show that the inclined crack has a very similar crack propagation pattern and force-displacement curve as the corresponding equivalent horizontal crack. But as the inclination angle of the initial crack increases, the inclined crack shows a larger peak force. The crack propagation patterns of the equivalent cracks are always slightly above that of the corresponding inclined cracks. In fact,the tip of the equivalent horizontal cracks (notches) is always slightly above the tip of the initial inclined cracks (notches) as illustrated in Fig. 12(a).
4.4.2 Pure shear loading
After the tension loading case we consider the shear loading case as illustrated in Fig. 12(b). In Fig. 15(a), the simulated crack patterns are depicted. The crack propagates from the right-upper tip of the initial crack when the angle is less than 45°. The starting point of the crack propagation is in the lower-middle part of the inclined crack for 45°. However, the starting point of the crack growth changes to the left mouth of the inclined crack when the angle is larger than 45°. Besides, all the inclined initial cracks show the same force-displacement curves at the beginning, as shown in Fig. 15(b). With the increase of the displacement loading ∆ u, the force gradually increases. It is noted here that when the displacement loading ∆ u reaches a certain level,the force suddenly drops. When the inclination angle of the initial crack is 45°, the maximum peak force appears.
4.5 Single edge-cracked bi-material specimen with different y-coordinates of the initial crack
Next, single edge-cracked bi-material specimens made of two different materials with different y-coordinates (y=0.10 mm,0.20 mm, 0.25 mm, 0.30 mm, 0.40 mm, and 0.48 mm, respectively) of the initial crack in the material B are studied. The length of the initial crack is given by L=0.2 mm. We assume that the interface is perfectly bonded. The geometry and the applied displacement loading are depicted in Fig. 16. The upper material has better material properties (Ea= 210 GPa, νa= 0.3,Gca= 2.7×10⁻³kN/mm), while the lower material has poor ma-terial properties (Eb= 21 GPa, νb= 0.3, Gcb= 2.7×10⁻⁴kN/mm),and the length-scale parameter is also taken as l = 0.075 mm.
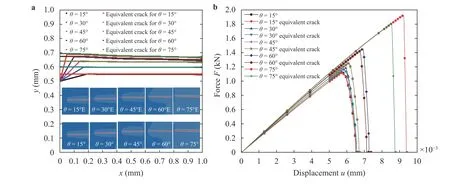
Fig. 14. Single edge-cracked specimen with different inclination angles of the initial crack and the equivalent horizontal crack under pure tension loading. a Crack patterns of the phase field simulation, b force-displacement curves.
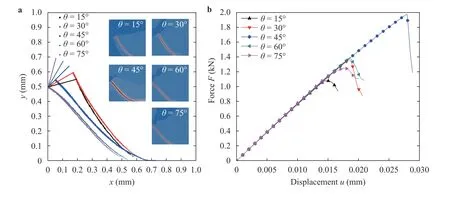
Fig. 15. Single edge-cracked specimen with different inclination angles of the initial crack under pure shear loading. a Crack patterns of the phase field simulation, b force-displacement curves.
4.5.1 Pure tension loading
The displacement loading increment is taken as∆u = 10−5mm for the first 350 steps, and then ∆ u = 10−6mm for the following simulation. Figure 17(a) and 17(b) illustrate the simulated crack patterns and force-displacement curves for different y-coordinates of the initial crack. As we can see in Fig.17(a), the crack far away from the interface propagates towards the interface, while the crack close to the interface extends away from the interface. However, for some special crack locations the crack propagates horizontally. The peak force gradually increases when the initial crack is farther away from the interface,as shown in Fig. 17(b). Compared to the crack propagation in a single material specimen as illustrated in Fig. 10, different phenomena regarding the crack growth path and the force-displacement curve can be observed in Fig. 17. These differences are caused by the interface and different material properties.
4.5.2 Pure shear loading
In this case, the displacement loading increment∆u = 10−5mm is applied for 1500 steps. Figure 18(a) shows the simulated crack patterns for different y-coordinates of the initial crack. They have almost the same propagation direction β as shown in Fig. 11(a) for the crack propagation in a single material specimen. The force-displacement curves are depicted in Fig.18(b). The slope of each curve decreases first and then increases,but the slope change for the initial crack closer to the bottom side (y=0) is not obvious. The global trends of the force-displacement curves are very similar to that of the crack propagation in a single material specimen as shown in Fig. 11(b): the closer is the initial crack to the bottom side, the larger the ultimate force will be.
5 Conclusions
In this paper, a phase field method based on Miehe's approach is applied for the crack propagation simulation in 2D brittle elastic materials. The method can be used to simulate the crack initiation, propagation, kinking, branching and so on. The simulation results are in good agreement with the reference results [22]. Several numerical examples are presented and discussed to show the effects of different geometrical and material parameters on the crack propagation paths and force-displacement curves. The following conclusions can be drawn from the present investigation.
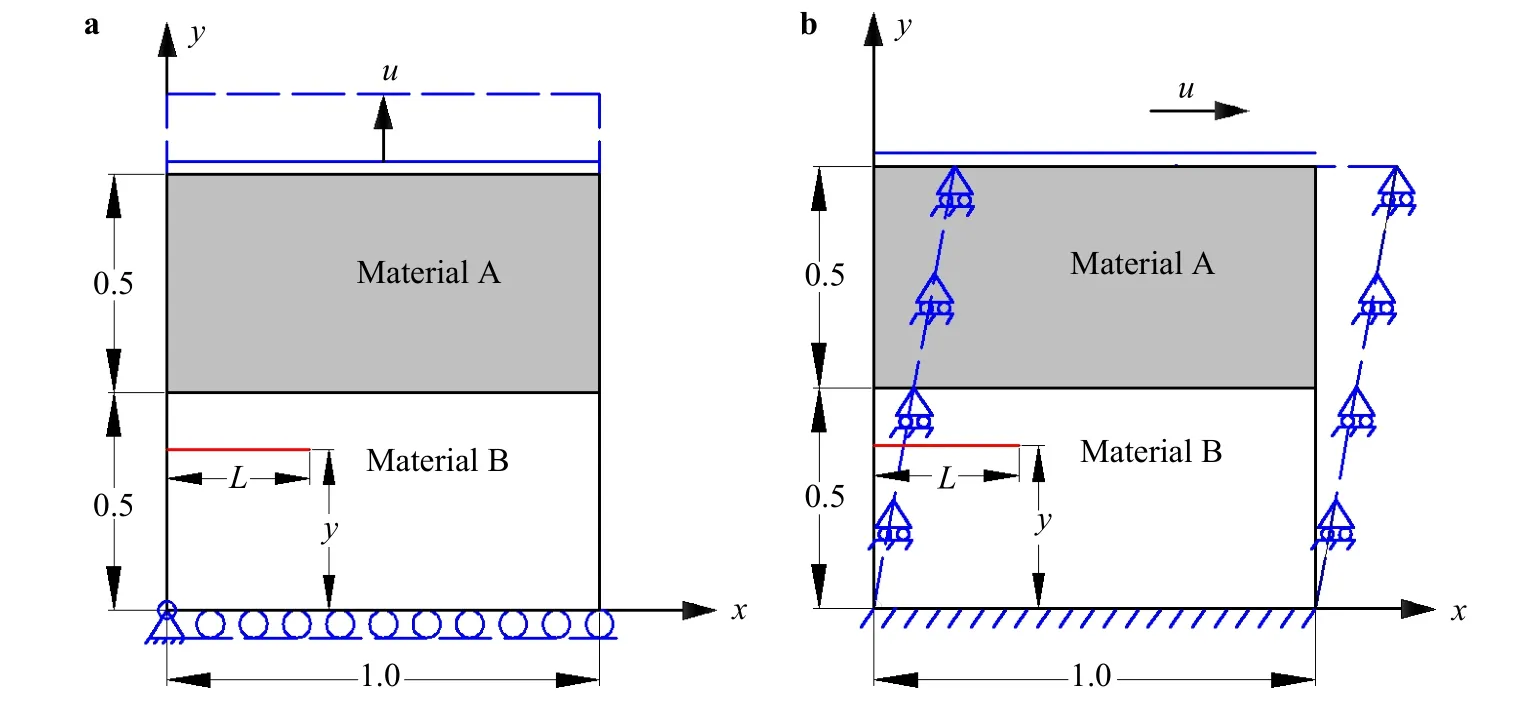
Fig. 16. Schematic of the single edge-cracked bi-material specimen with different y-coordinates of the initial crack. a Pure tension loading,b pure shear loading.
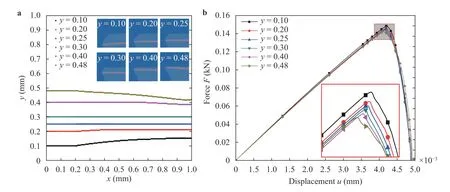
Fig. 17. Single edge-cracked bi-material specimen with different y-coordinates of the initial crack under pure tension loading. a Crack patterns of the phase field simulation, b force-displacement curves.
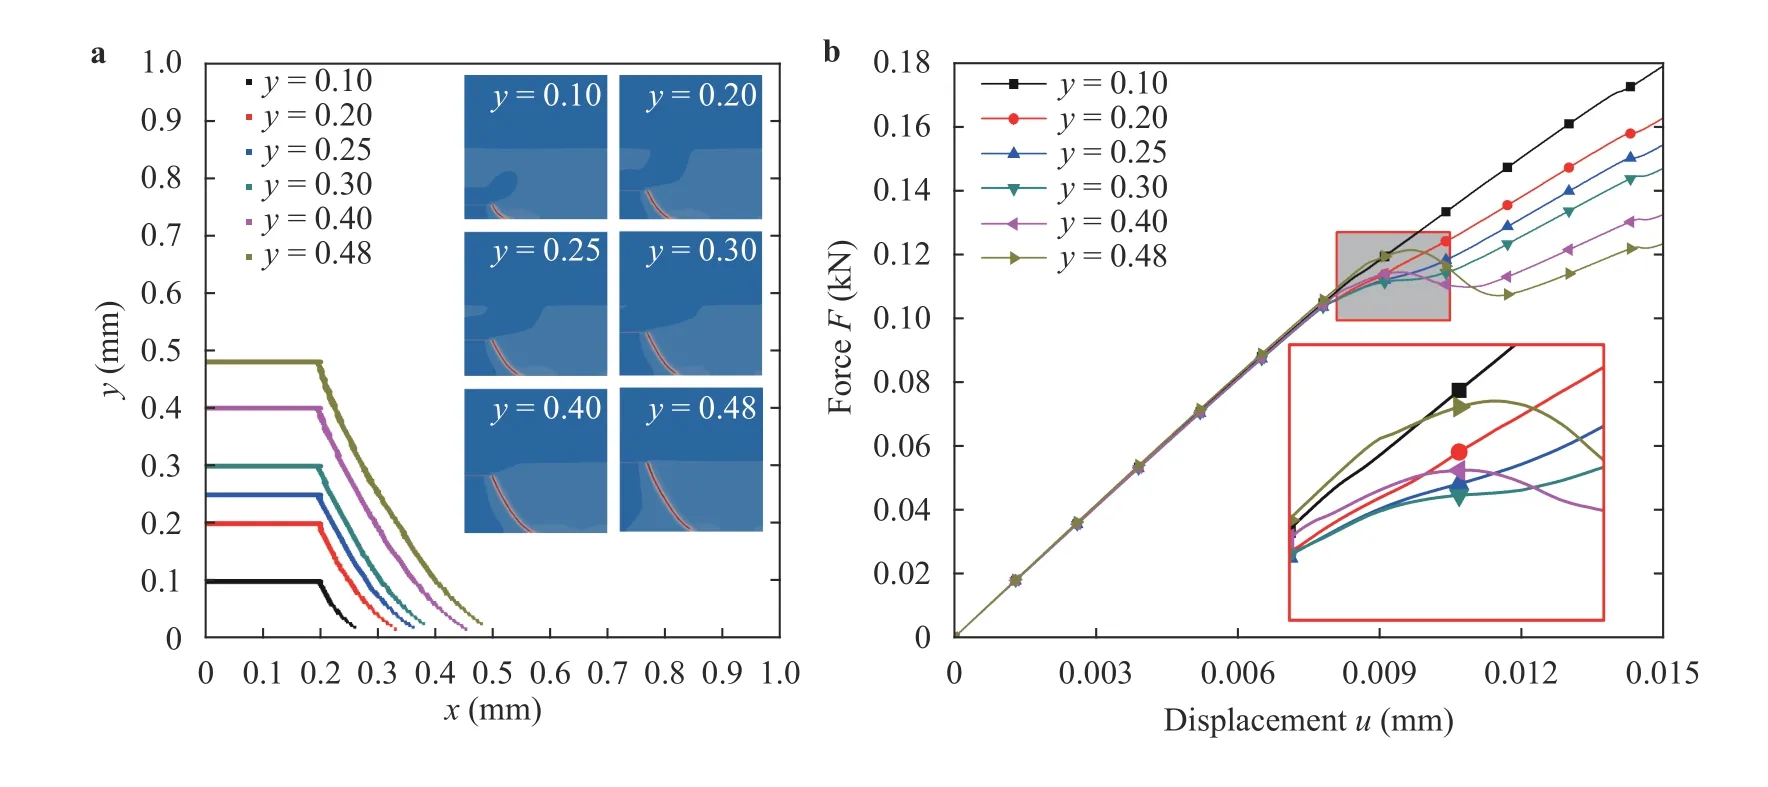
Fig. 18. Single edge-cracked bi-material specimen with different y-coordinates of the initial crack under pure shear loading. a Crack patterns of the phase field simulation, b force-displacement curves.
(1) In the pure tension loading case, initial horizontal cracks of different lengths located on the horizontal symmetry-axis(y=0.5) of the specimen propagate straightforward in the horizontal direction, and the peak force and maximum displacement decrease when the length of the initial crack increases. The horizontal cracks located symmetrically with respect to the symmetry-axis show a propagation tendency toward the symmetryaxis, and they exhibit almost the same force-displacement curves for the same initial crack-length. Moreover, the farther is the initial crack away from the symmetry-axis, the larger the peak force is. For inclined cracks of the same length, as the crack inclination angle increases, the peak force increases. They have almost the same crack trajectory and force-displacement curves as their equivalent horizontal cracks. But when the angle is over 45°, the peak force for the equivalent crack is smaller than that for the original inclined crack.
(2) When the pure shear loading is applied, initial horizontal cracks of different lengths located on the horizontal symmetryaxis (y=0.5) of the specimen have the same propagation trend.The horizontal cracks with different y-coordinates also have a similar propagation trend, and the peak forces are the same if the cracks are located symmetrically with respect to the symmetry-axis. The ultimate force is larger for the crack closer to the bottom boundary. On the other hand, the crack propagation tendencies as well as the force-displacement curves are different for the inclined cracks with different inclination angles. The peak force is maximum and minimum at 45° and 0°, respectively.The crack propagates from the tip of the initial crack when the inclination angle is less than 45°. However, when the angle is larger than 45°, the crack propagates from the mouth of the initial crack. While the starting point of the crack propagation is in the middle part of the initial crack for 45°.
(3) For the bi-material plate containing a horizontal crack with different y-coordinates under a tension loading, an initial crack far away from the interface propagates towards the interface, while a crack close to the interface extends away from the interface. For some special crack locations, the crack propagates horizontally. However, an axis of symmetry for the crack paths does not exist. For the shear loading case, the results are quite similar to that for an initial crack in a single material specimen.
The results presented in this paper can be used to estimate or prevent possible crack propagations in brittle elastic materials,which are significant in practical engineering applications. As the phase field model based on Miehe's approach is somehow sensitive to the length-scale (regularization parameter l and element-size h), the length-scale insensitive phase field model developed by Wu [28, 42] should be implemented in our future work.
Acknowledgments
This work was supported by the National Natural Science Foundation of China (Grant U1833116). The authors would like to express their sincere thanks to Professor Jian-Ying Wu (South China University of Technology, Guangzhou, China), Dr.Tianxue Ma and Mr. Zhen Yan (University of Siegen, Siegen,Germany) for the helpful discussions in the course of this study.The first author is also grateful to the financial support by the China Scholarship Council (CSC) for the joint PhD scholarship at the Chair of Structural Mechanics, Department of Civil Engineering, University of Siegen, Germany.
杂志排行
Theoretical & Applied Mechanics Letters的其它文章
- Generalized canonical transformation for second-order Birkhoffian systems on time scales
- Modified slow-fast analysis method for slow-fast dynamical systems with two scales in frequency domain
- Sensitivity analysis of the vane length and passage width for a radial type swirler employed in a triple swirler configuration
- On time independent Schrödinger equations in quantum mechanics by the homotopy analysis method
- Creep relaxation in FGM rotating disc with nonlinear axisymmetric distribution of heterogeneity
- Dynamic response of clamped sandwich beams: analytical modeling
