Optimal finite-dimensional spectral densities for the identification of continuous-time MIMO systems
2019-07-26MITHUNShravanMOHANBharathBHIKKAJI
I.M.MITHUN,Shravan MOHAN,Bharath BHIKKAJI
Department of Electrical Engineering,Indian Institute of Technology,Madras,Chennai 600036,India
Received 2 February 2018;revised 23 February 2019;accepted 25 February 2019
Abstract This paper presents a method for designing inputs to identify linear continuous-time multiple-input multiple-output(MIMO)systems.The goal here is to design a T-optimal band-limited spectrum satisfying certain input/output power constraints.The input power spectral density matrix is parametrized as the productis a matrix polynomial.This parametrization transforms the T-optimal cost function and the constraints into a quadratically constrained quadratic program(QCQP).The QCQP turns out to be a non-convex semidefinite program with a rank one constraint.A convex relaxation of the problem is first solved.A rank one solution is constructed from the solution to the relaxed problem.This relaxation admits no gap between its solution and the original non-convex QCQP problem.The constructed rank one solution leads to a spectrum that is optimal.The proposed input design methodology is experimentally validated on a cantilever beam bonded with piezoelectric plates for sensing and actuation.Subspace identification algorithm is used to estimate the system from the input-output data.
Keywords:System identification,optimal input design,fisher information matrix,quadratically constrained quadratic program
1 Introduction
System identification is an experimental approach to model the dynamics of a system[1-3].An experiment is performed on the system by applying inputs and recording the corresponding outputs.The recorded input-output data is then used to fit a model for the system.In many cases,a given system can be modeled from first principles[4,5].However,the derivation of these models can involve assumptions that are idealizations,thus making the models differ from the dynamics of the fabricated system to a certain degree[4,6,7].Moreover,bonding or attaching sensors and actuators will add extra dynamics making them differ from the ideal[8,9].
Even if the assumptions made are within acceptable limits,the models derived have to be validated experimentally[10-13].Thus designing inputs that enable identification(i.e.,inputs leading to outputs that have maximum system information)while satisfying input-output power constraints is inevitable[14,15].This paper presents a scheme to design inputs for a MIMO system that maximizes the trace of the fisher information matrix(FIM)under both input and output power constraints.It is worth emphasizing that the paper deals only with input design,and algorithms for system identification are not of interest here.
1.1 Notations
A list of basic notations used in this paper are given in Table 1.
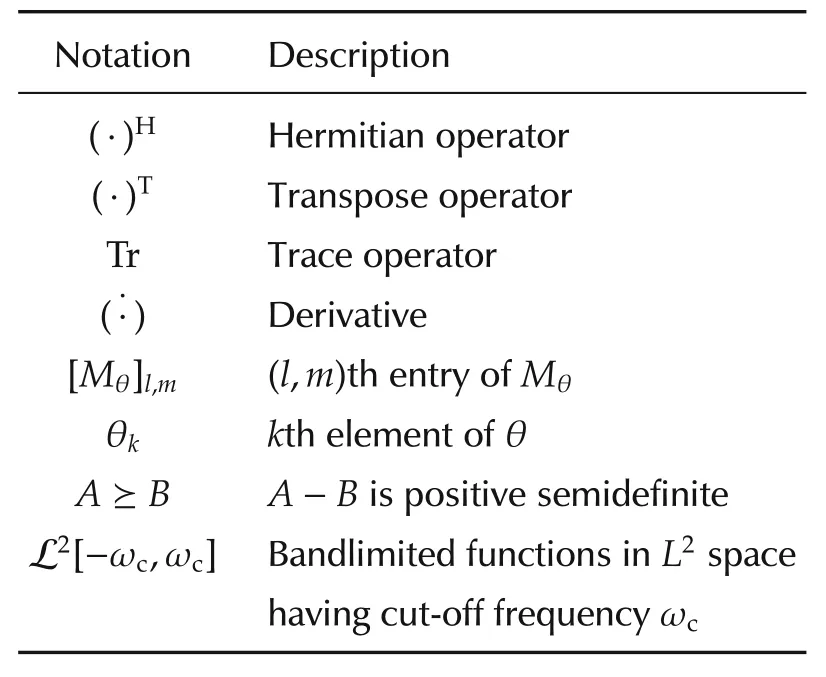
Table 1 Notations.
1.2 Problem statement
In this paper,a continuous time r-input p-output system of the form

as shown in Fig.1 is considered.

Fig.1 I/O diagram.
In the output error(OE)model(1)

and

denote the input,output and noise signals respectively,with ei(t)∈N(0,1).The p×r transfer function

where

with mij≤nij,links the input u(t)to the output y(t)and

where

are the parameters of G(s,θ),to be identified from the input/output data.Note that θ is taken to be a q×1 vector,where

For the systems of the form(1),the FIM,[Mθ]l,mis given by[16-18]

where

and
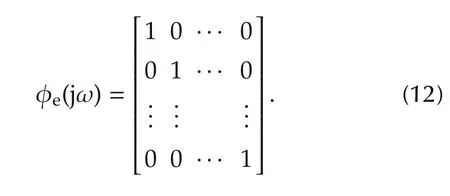
Note that[Mθ]l,mdenotes the(l,m)th entry of Mθ.Here θkdenotes the kth element of θ,φu(jω)is the multiinput power spectral density matrix with φjj(jω)being the power spectral density of the jth input and φij(jω)being the cross power spectral density between the ith and the jth inputs.The noise power spectral density is denoted by φe(jω)while Tr(·)and(·)Hdenote the trace and Hermitian operators respectively.Substituting for φe(jω),the FIM becomes

The goal in optimal input design is to choose a positive input power spectrum φu(jω)belonging to a compact set D such that the cost function J(Mθ)is maximized,where J is concave in Mθ[19-23].
In this paper,J is chosen to be the trace of Mθreferred to as the T-optimal cost function[24-26].The set D is taken to be the set of all matrices with elements being square integrable and band-limited with a cut-off ωc.Mathematically stated

and

In this work without loss of generality,ωcis assumed to be one.
Other commonly used optimality criteria existing in the literature include A-optimality which minimizes the trace of the inverse of the FIM[24,27,28],Doptimality which maximizes the determinant of the FIM[22,23,28-30]and E-optimality which minimizes the maximum eigenvalue of the inverse of the FIM[31,32].
Theorem 1It can be shown that

where

Refer to the appendix for the proof.
The above theorem helps in calculating the cost function,J(Mθ).
The input and the output power constraints are given by

and

respectively.In(18)and(19),the constants Kuand Kydenote the bounds on the input and the output power,respectively.
Since an output error model(1)is assumed,the output power constraint(19)becomes

which simplifies to

Note from(18),D can be updated to

The goal here is to find a positive spectrum φu(jω)∈D,satisfying both input and output power constraints and minimizing the T-optimal cost function(14),i.e.,
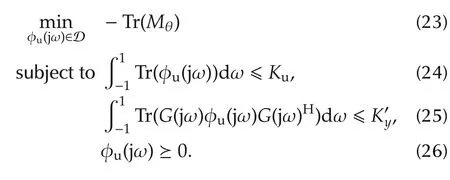
Solving the optimization(23)-(26)leads to the Toptimal power spectrum φu(jω).A real-valued input signal u(t)is then generated from the optimal spectrum φu(jω).This optimal input u(t)is applied to the system to be identified,and the corresponding output is recorded.The system can then be identified from the input-output data using algorithms such as subspace identification.
1.3 Motivation and bottlenecks
The main bottleneck in input design is the requirement that θ0be known to calculate the FIM(10),and hence for solving the optimization problem(23)-(26).It is common to most papers/work done in input design[2,3,16-18,33-35]to assume that the parameters be known.In practice,however,most systems are usually designed using software tools(such as Coventor,Autodesk,Spice,etc.)and later fabricated in a workshop,a good account of this can be found in[36].There is always bound to be a discrepancy between the designed system and the fabricated system.The parameters provided by the design software are often taken as a reasonable estimate of θ0.While the models for the designed system are provided by the software tool used,the model for the fabricated system has to be identified.Application of optimal inputs results in more accurate system estimates.
Typically most identification practitioners prefer using sinusoidal inputs as they are mathematically simple[22,23,37].Multisine inputs are given by

where βk,ωkand ψkare the amplitudes,frequencies and phases of the sinusoids respectively.The corresponding power spectrum and FIM are given by

and

respectively.The optimal input amplitudes,βks are obtained by solving the optimization problem
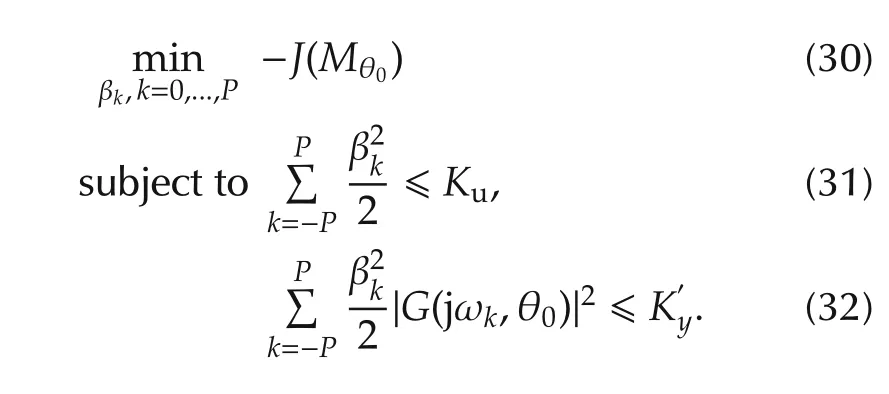
There are certain drawbacks associated with using this methodology.
1)If the frequencies ωks are predetermined(or fixed to certain values),then the optimization(30)-(32)is convex ins for a concave J,thus leading to a unique solution.More details can be found in[23,37].Therein once βks are determined,the input u(t)can be generated by choosing ψks as uniform random phases in[-π,π].If both frequencies and amplitudes are variables,then the optimization problem(30)-(32)is non-convex and mathematically not tractable as ωks can take any finite set of values.
2)Sinusoidal inputs cannot be used in many scenarios.Sinusoids exciting the resonances could set-off high amplitude oscillations in resonant structures[6,7,36].
3)Sinusoids put all their energy at one particular frequency.The spectrum obtained using an initial estimate()and that from the true parameters(θ0)would be having significant differences even ifand θ0are reasonably close to each other.
The current state-of-the-art for determining φu(ω)was presented in[18,20].Therein,by solving a convex optimization problem,using Fourier basis and Kalman-Yakubovich-Popov(KYP)lemma[38,39],the optimal power spectrum was obtained.In other words,the input power spectrum was parameterized by

where ckare m ×m symmetric matrices with real entries for all k.Note for a continuous-time SISO systemwill be scalars.A finite dimensional approximation of the power spectrum given by

where N is a positive integer was considered.Instead of using the full spectrum,the authors use the positive real part of the spectrum,i.e.,

where

Here the positivity of the input power spectral density is enforced using the KYP Lemma.Let(A ,B,C,D)be a controllable realization of.Then there exists a symmetric Q such that
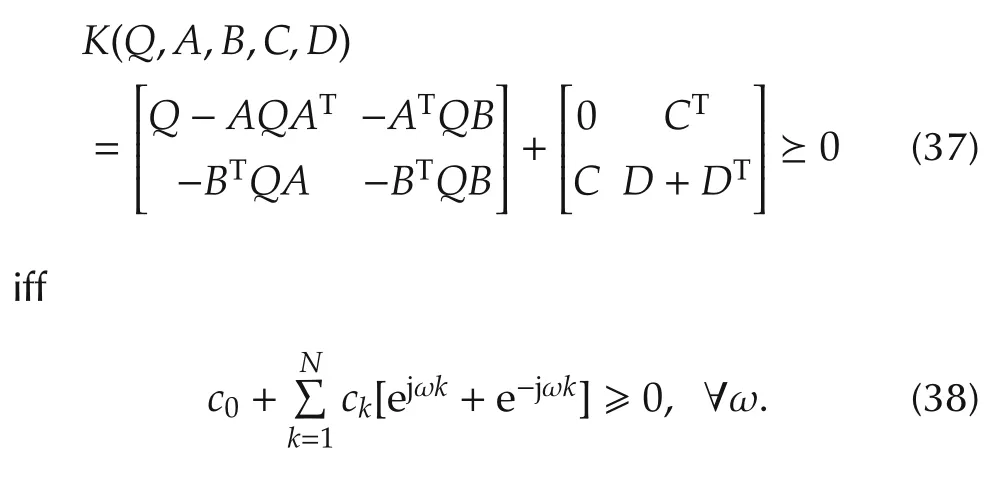
A controllable realization can be obtained by choosing
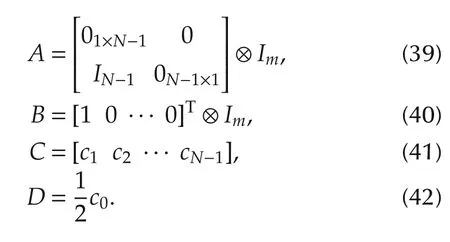
This results in(37)being convex in{c0,...,cN}.
It is worth noting that using the parameterization(36),the T-optimal input design problem can be formulated as
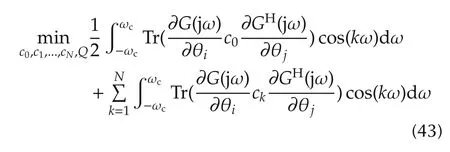
subject to
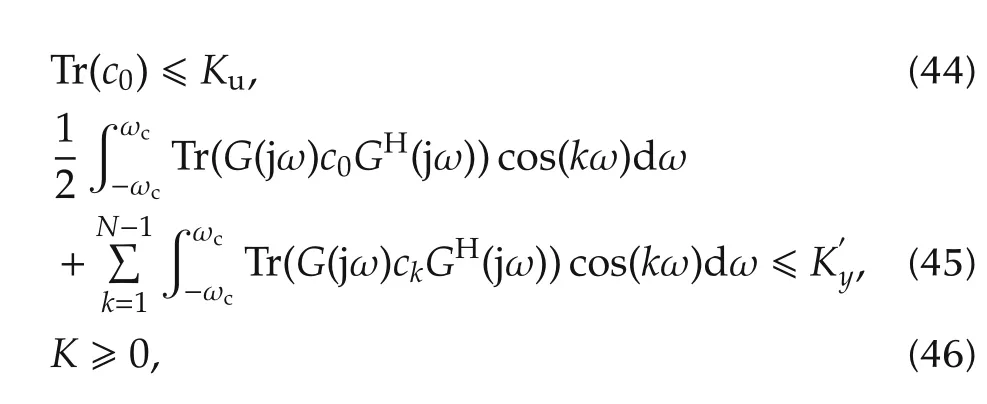
where K is as defined in(37).
A closed loop identification was considered in[21].An arbitrary signal was applied to obtain an initial estimate θNof the plant parameters.A controller,C(θN)was designed using this estimate.An uncertainty ellipsoid with center θNand axes characterized by the inverse of the positive definite covariance matrix P(θN),was defined.It is further shown that P-1(θN)was affinely dependent on the input power spectrum and hence affinely dependent on the covariance matrices(with parametrization as given in(33)).The covariance matrices,matrix Q(due to KYP lemma)and the spectrum were determined by minimizing the sum of the total input and the output power under the constraint that the worst case performance of the controller over all the plants in the uncertainty region is below a certain threshold.
The current work is an extension of the work presented in[28].As in here,the inputs and the outputs were power constrained.The spectrum was bandlimited and parametrized as the product φu(jω) =.Maximization of a general concave functional(which includes D-optimal,T-optimal and Aoptimal)was considered for optimality.A lower bound and an upper bound for the optimal solution were obtained through relaxations.The lower bound was obtained through a bilinear formulation and the upper bound through a convex relaxation.Even though the lower and upper bounds together are good indicators of the optimal,they are still suboptimal.This paper provides an optimal solution when the cost functional is T-optimal.
There were other frameworks which have been used to formulate the input design problem.In[40],the L-optimal cost function min Tr(WM-1)with weighting matrix depending on the prior parameter estimates was minimized.The inputs{u(1),...,u(N)},were constrained to be in a prescribed set and the corresponding outputs [y(1),...,y(N)]being in an another given set with a probability μ.This non-convex optimization was solved using an iterative design procedure.In[41],a simulation case study was presented to evaluate the advantages and disadvantages of various input excitation strategies in terms of the accuracy of the estimated parameters,prediction errors,process gains,and relative gain arrays.Generating an input signal with a desired auto-correlation under input and output amplitude constraints was considered in[42].As this time domain input design problem turned out to be non-convex,a relaxed problem was solved therein.In[43],a closed form expression for the optimal input spectrum was derived for solving a model predictive control problem.The optimal input was designed to minimize the sum of the squares of the prediction error(simulation error).The optimal spectrum was realized by PRBS signals or filtered white noises.In[44],input design for identification of grey box models by optimizing a Bayesian criterion under input power constraint was considered.The optimal input was realized by a multisine input as in(28).
1.4 Structure and contributions of this paper
In this paper,the input power spectral density matrix is decomposed aswhere H(jω)is a matrix polynomial,refer to Section 2 for details on this parametrization.Note,this parametrization directly enforces the positivity of the spectra.Parametrization in terms of the polynomial matrix H(jω)converts the T-optimal cost function(14)with the input and output power constraints(24)and(25)into a quadratically constrained quadratic program(QCQP)problem with a rank one constraint.The rank one constraint in the QCQP problem is relaxed which results in a convex problem that can be solved in polynomial time.The optimal solution to the relaxed problem could have a rank more than one.A rank one approximation of the full rank solution is then determined.This rank one approximation turns out to be optimal for the original QCQP problem.The matrix polynomial,H(jω)is constructed from the optimal solution(rank one approximation).Using H(jω),the input signal u(t)which corresponds to the optimal power spectral density matrix φu(jω)is generated.A polynomial basis is used here for the sake of brevity which can be replaced by any other choice of basis functions on D.
In summary,the main contributions of this paper are:
1)Most literature in MIMO input design have so far considered only discrete time systems[17,19-22].In this work,inputs are designed for the identification of continuous time systems.Identifying a discrete time system and transforming it into a continuous time system has many disadvantages.Some of them are[45,46].
a)At high sampling rates,the transformation from discrete to continuous could be very sensitive to parameter variations.
b)Discretization of continuous-time models may result in non-minimum phase plants.
c)A higher number of parameters could be present in the transformed discrete model due to the extra zeros introduced.
2)The proposed formulation is agnostic to the choice of basis;unlike the state-of-the-art,it need not be proper stable rational functions of ejω.
3)The proposed method subsumes the state of the art.This can be noted by setting

Refer to Section 4.3 for further details.
4)Note that compared to the proposed method which requires determining H0,H1,...,Hm,the state-of-the-art requires identifying additional variables because of the r×r matrix Q,where r is the number of inputs.Hence the dimension of the search space is increased by r2in the state-of-the-art method.
5)In many situations the input u(t)is restricted to take values from a finite set,i.e.,they have to switch between a set of discrete levels[47-49].Such inputs arise in the administration of drugs(typically a fixed volume),rewards(either a positive reward or no reward)for certain social behavior or application of pulse inputs.Standard binary signals such as PRBS cannot be used as there is a required minimum time gap between the application of two pulses.In such cases,inputs can be parameterized as

where

The time delay τ is either the minimum possible or required delay between the switchings.In this scenario,it might be more appropriate to use a basis defined by sinc functions which can be realized in the framework presented in this paper.
6)The sub-optimal solution in[28]has been extended to a T-optimal solution.
The paper is organized as follows.Section 2 is concerned with the parametrization of FIM and the constraints in terms of H(jω).Section 3 presents the formulation and solving of the optimization problem.Section 4 presents the results of experiments conducted on a cantilever beam system bonded with piezoelectric plates,along with a comparison of the proposed method with the state-of-the-art method.The paper concludes in Section 5 with a discussion.
2 Parametrization
Consider a positive semidefinite matrix φu(jω)(i.e.,(jω)=φu(jω)and φu(jω)≥0,∀ω≥0)belonging to D.Such a φu(jω)has a spectral decomposition[50-52]

The spectral factor H(jω)can be approximated by an r×r matrix of polynomials in ωof degree m,given by

where

Here(·)Tdenotes the transpose operator.Note that the polynomial basis given in this paper can be replaced by any choice of band-limited basis in L2(the space of square-summable sequences).
The power spectral density is a continuous function.By Weierstrass theorem,every continuous function f defined on a closed and bounded interval[a,b]can be uniformly approximated by a polynomial function,to any degree of accuracy[53,54].Mathematically stated,for any given є>0 there exists a polynomial p on[a,b]such that

This ensures that as m →∞,the polynomial basis in(52)will converge to the true power spectral density.
Note that each Hiis an r×r matrix.Replacing H(jω)by Hm(jω)leads to an approximate power spectral density

Using(55)in(24),the input power constraint thus becomes

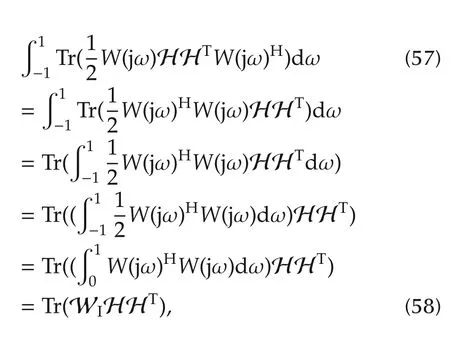
Consider the LHS of(56).Since Tr(AB)=Tr(BA)for any two matrices of compatible dimensions,
where

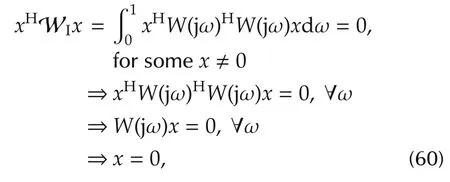
Theorem 2WIis an r(m+1)×r(m+1)positive definite matrix[28].
ProofIf WIis positive semidefinite,then
which is a contradiction. □
Since WIis an r(m+1)×r(m +1)positive definite matrix,it can be factorized asbeing an r(m+1)×r(m+1)matrix.Using this in(58)leads to

It is known that for any k×n matrix A=[aij],


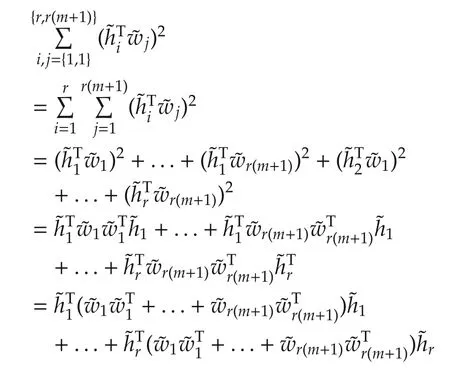
where
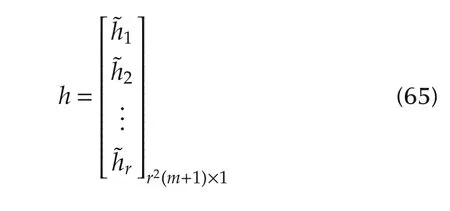
and
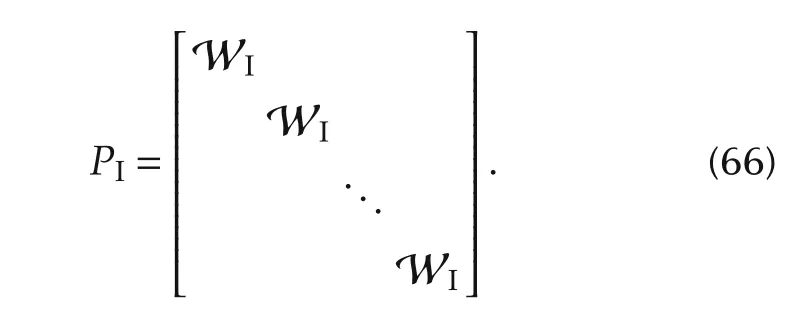
Since WIis a positive definite matrix,PIwill also be a positive definite matrix of order r2(m+1)×r2(m+1).
As before,using(55)in(25),the output power simplifies to

Setting
and as in(60),it can be shown that WGis also positive definite.Hence,it can be factorized aswithbeing an r(m+1)×r(m+1)matrix.
Note,the LHS of(67)simplifies to
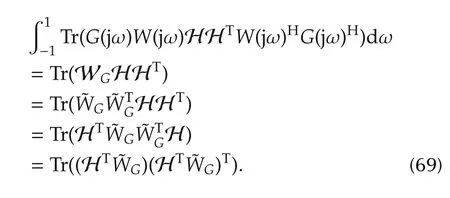
From(69),it is clear that LHS of(67)will be a quadratic and positive polynomial in H and can be rewritten as hTPOh,similar to(64),where
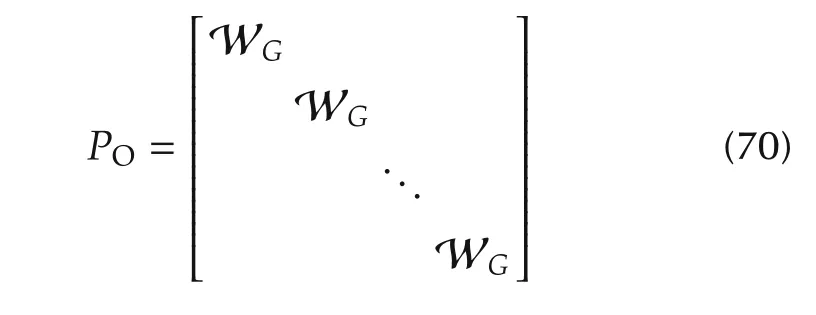
is a positive definite matrix of order r2(m+1)×r2(m+1).
In a similar fashion,the cost function-Tr(Mθ)in(14)can be rewritten as hTPCh,where PCis a negative definite matrix.
3 Optimization
In this section,the optimization problem

is solved to determine an optimal h,where PC,PIand POare as defined in Section 2.This problem belongs to the class of optimization problems called QCQP.Since PCis not a positive semidefinite matrix,the cost function is not convex,and the problem cannot be solved directly.In the following,a semidefinite relaxation of(71)-(73)is considered.A solution to the original problem is constructed using the solution to the semidefinite relaxation.This construction procedure is taken from[55].
Note that

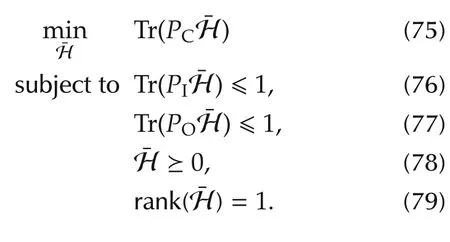
However,the rank constraint(79)is not a convex constraint.By removing the rank constraint,the above optimization problem is relaxed to
The dual of the relaxed problem(80)-(83)is

This relaxed optimization problem leads to a positive semidefinite matrixwhich may have a rank above one.In the following,a procedure for construction of rank one approximation ofis considered for the cases where
▪Both the power constraints are tight.
▪One of the power constraints is tight.
The construction procedure for both cases is taken from[55]and is rewritten here for brevity and completeness.
Lemma 1Let S be an arbitrary symmetric matrix.Let H be a positive semidefinite matrix with rank q.Suppose that Tr(SH)≤0.Then there exists a decomposition

ProofRefer to[55]for a constructive proof. □
3.1 Both the power constraints are tight
Setting S=PI-POand H=*and using Lemma 1,a decomposition of the form

where

▪As the input power constraint,(81)is tight,
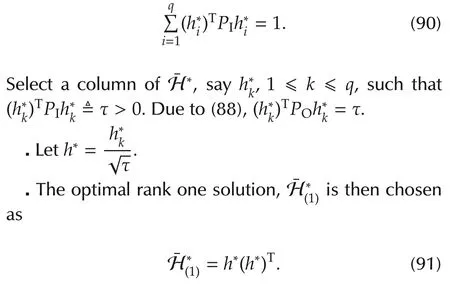
Note that

Since

it can be seen that

and thus

It is also worth noting that

and hence the primal-dual complementarity conditions are satisfied.This shows that the SDP relaxation admits no gap with the true optimal value.
3.2 One of the power constraints is tight
Consider the case where one of the power constraints(say,output power constraint(82))is non-binding.Let

denote a quadratic polynomial in h and

denote the matrix representation for fI(·).Let hobe an arbitrary row vector of appropriate dimension such that
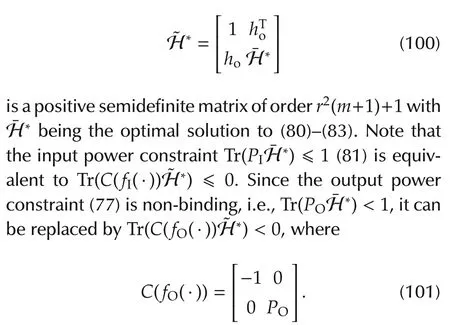
Let

where c is any scalar.Since
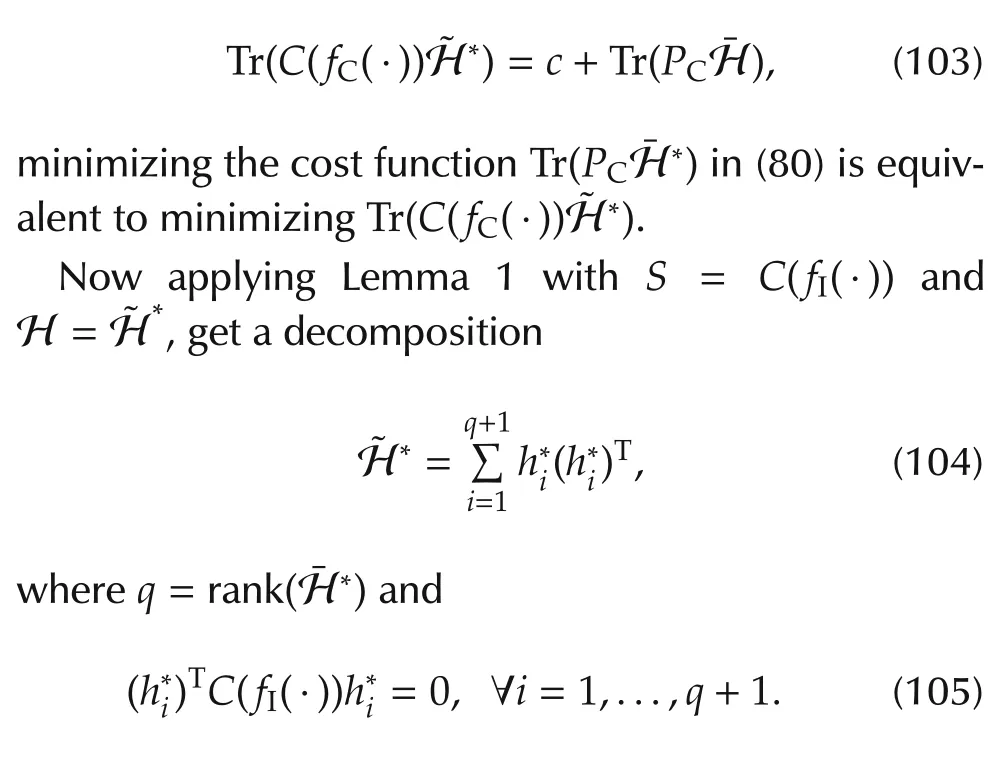
Set

Note that


and

Now,the rank one approximation foris given by

From(100)and(111),the rank one approximation foris given by

where

Since the output power constraint is non-binding,the corresponding dual optimal solution,=0.
Note,as before

This shows that SDP relaxation admits no gap with the true optimal value.For more details on the construction of rank one solution,refer to[55].
where Hij(jω)is a polynomial of degree m.Determination of the input signal u(t)from the spectral density matrix,φu(jω)(or,equivalently from H(jω))is presented in Appendix B of[28].
4 Experimental results
An experimental setup with a cantilever beam representing a resonant system that is susceptible to high amplitude oscillations is considered,refer to Figs.3 and 2.This experimental setup fabricated in-house is similar to ones used in that of[8]and[56].

Fig.3 Experimental setup:an aluminum beam clamped rigidly at one end and let free at the other end.
A cantilever beam clamped rigidly at one end and let free at the other end is considered,refer to Figs.3 and 2.This beam is bonded with six piezoelectric patches,three of them bonded in the front and three on the other side in a collocated fashion.Here,only the first and the third collocated patches are used.The frontal patches are used for actuation while the ones in the back are used for sensing.Table 4 shows the dimensions of the beam and the piezoelectric patches.
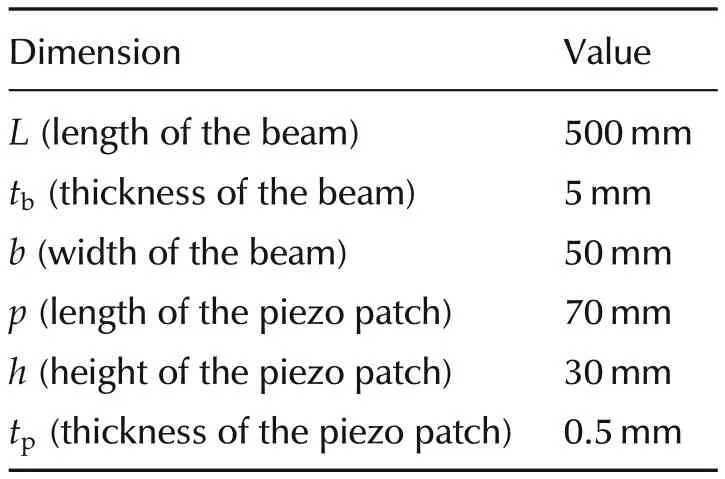
Table 2 Dimensions of the cantilever beam system.
Let u1(t)and u2(t)denote the inputs applied to the first and third piezoelectric patches respectively,y1(t)and y2(t)denote the outputs in the collocated patches.This leads to a 2×2 input-output system,

where Y1(jω),Y2(jω),U1(jω) and U2(jω) are Fourier transforms of y1(t),y2(t),u1(t)and u2(t),respectively.
In the experiments presented here an HP 35670A Dynamic Signal Analyzer,see Fig.2,is used.This Signal Analyzer has one output and two input ports.It acts as a signal generator through the output port and analyzes the signals(FFT,correlation,etc.)presented at the input ports.More importantly,it can generate a frequency response function relating inputs to outputs.
Experiments were conducted for identifying the cantilever-beam system using the proposed method and using the state-of-the-art method which uses the Fourier basis.
A sine-sweep in the frequency range 200-400 Hz,with an amplitude of 2 V is applied to first identify the system.This sine-sweep is applied to the first and third patches using HP 35670A Dynamic Signal Analyzer.The outputs generated at the collocated output patches were also presented to the Signal Analyzer.A model is estimated using the frequency domain subspace identification method[57].The estimated model,Ginit(s)is given by

Note that there are q=20 parameters in the estimated model Ginit(s).
4.1 Design of optimal power spectrum
The matrix polynomial H(jω)has been considered as a 5th order polynomial by setting m=5.The value of m was chosen as a trade-off between computational complexity and the quality of approximation.Using MATLAB’s CVX toolbox[58],the T-optimal cost function,(80)is minimized under the constraints(81)-(83),and a positive semidefinite matrix,is obtained.Note that,for findingG(jω)is differentiated w.r.t.20 parameters and the parameters of Ginitwere substituted in place of those parameters.Using Lemma 1 and the procedure mentioned in Section 3,a rank one approximation for(and thus h*)is determined.The optimal power spectral density matrix φu(jω)is determined using(65)and(51)-(53).
The diagonal elements of φu(jω)(φ11(jω)and φ22(jω))give the power spectrum for u1(t)and u2(t)respectively.The optimal input spectra are shown in Fig.4.
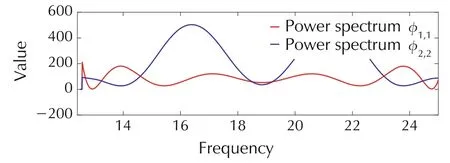
Fig.4 Optimal input power spectrum.
From the matrix polynomial H(jω),the single sided frequency functions, U1(jω) and U2(jω) were constructed using(121)and(122).By setting U1(-jω)=(jω),U2(-jω) =(jω)and U1(j0) = (U1(j0)+(j0))/2,they were extended to double sided functions.The optimal inputs,u1(t)and u2(t)were then calculated by taking IFFT of U1(jω)and U2(jω)and are shown in Figs.5 and 6.

where Φ1(ω)and Φ2(ω)denote random variables for each ω≥0 that are iid and uniformly distributed in the interval[-π,π].
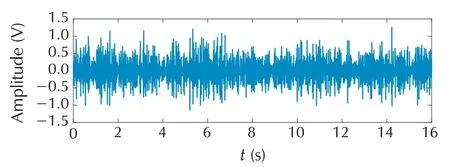
Fig.5 Optimal input 1.
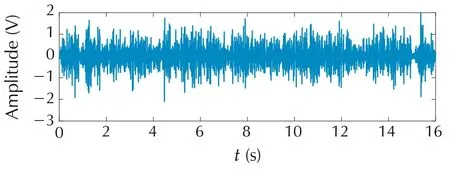
Fig.6 Optimal input 2.
4.2 Identification of the system
The designed optimal inputs,u1(t)and u2(t)are applied to the cantilever system,and the corresponding outputs,y1(t)and y2(t)are recorded.Using subspace identification algorithm,the continuous time system identified is given by

4.3 Comparison with State-of-the-art Method
Magnitude plot of actual and true system using the proposed method for different m is shown in Figs.7-11.The corresponding plots for the state of the art which uses Fourier basis is shown in Figs.12-16.For the proposed method,m refers to the degree of the spectral factor,H(jω).Thus 2m is the degree of the matrix polynomial for parametrizing the input power spectrum,whereas for the state-of-the-art method,2m refers to the number of Fourier basis used to approximate the input power spectrum.
The convergence is faster for the proposed method as can be seen from comparing the magnitude plots of the proposed and the state-of-the-art method.
For analytically comparing the performance of both methods,Mean Absolute Percentage Error(MAPE)is used,and the results are given in Table 2.
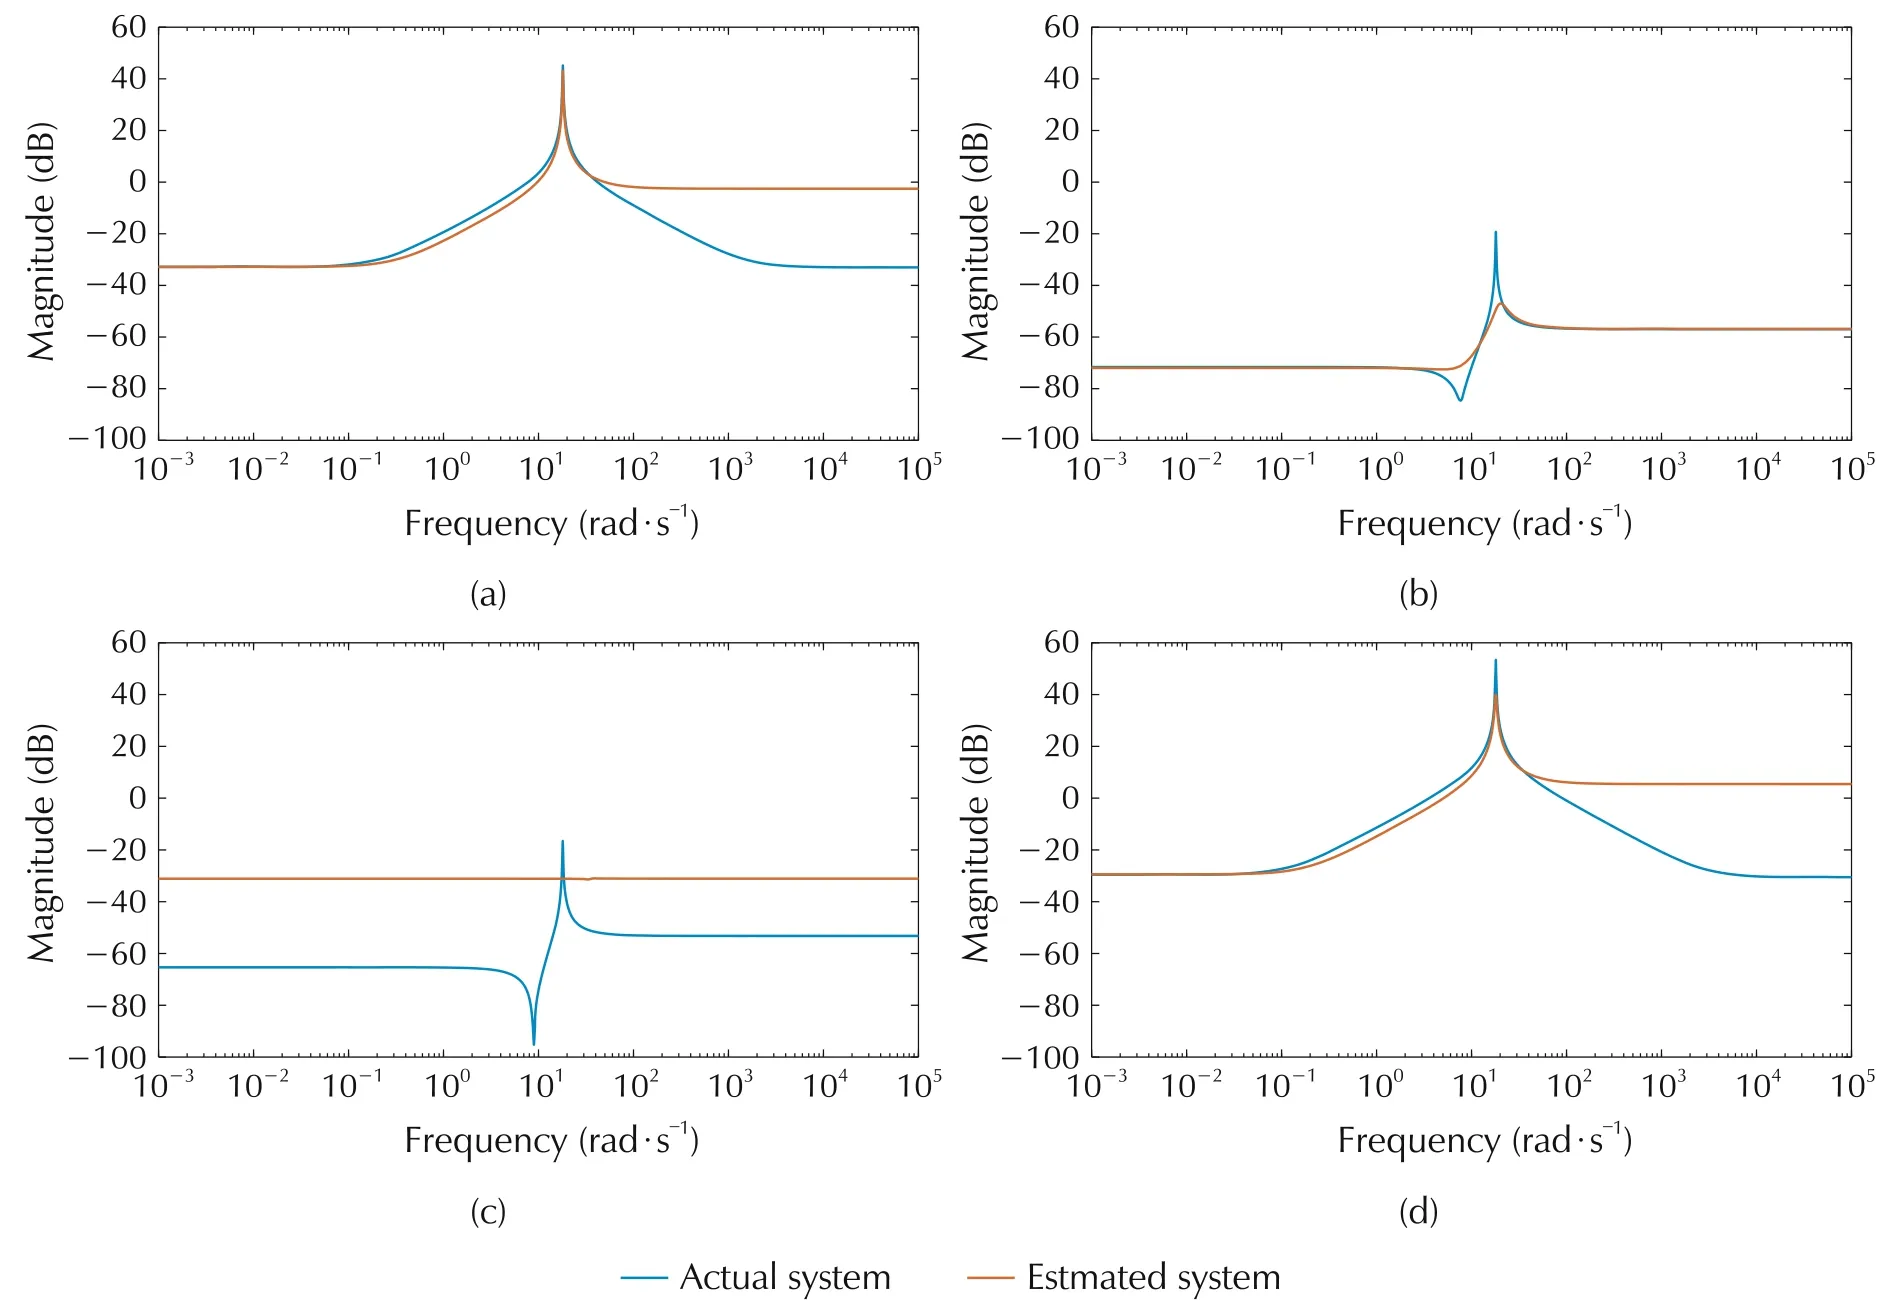
Fig.7 Actual and estimated system for m=3(proposed method).
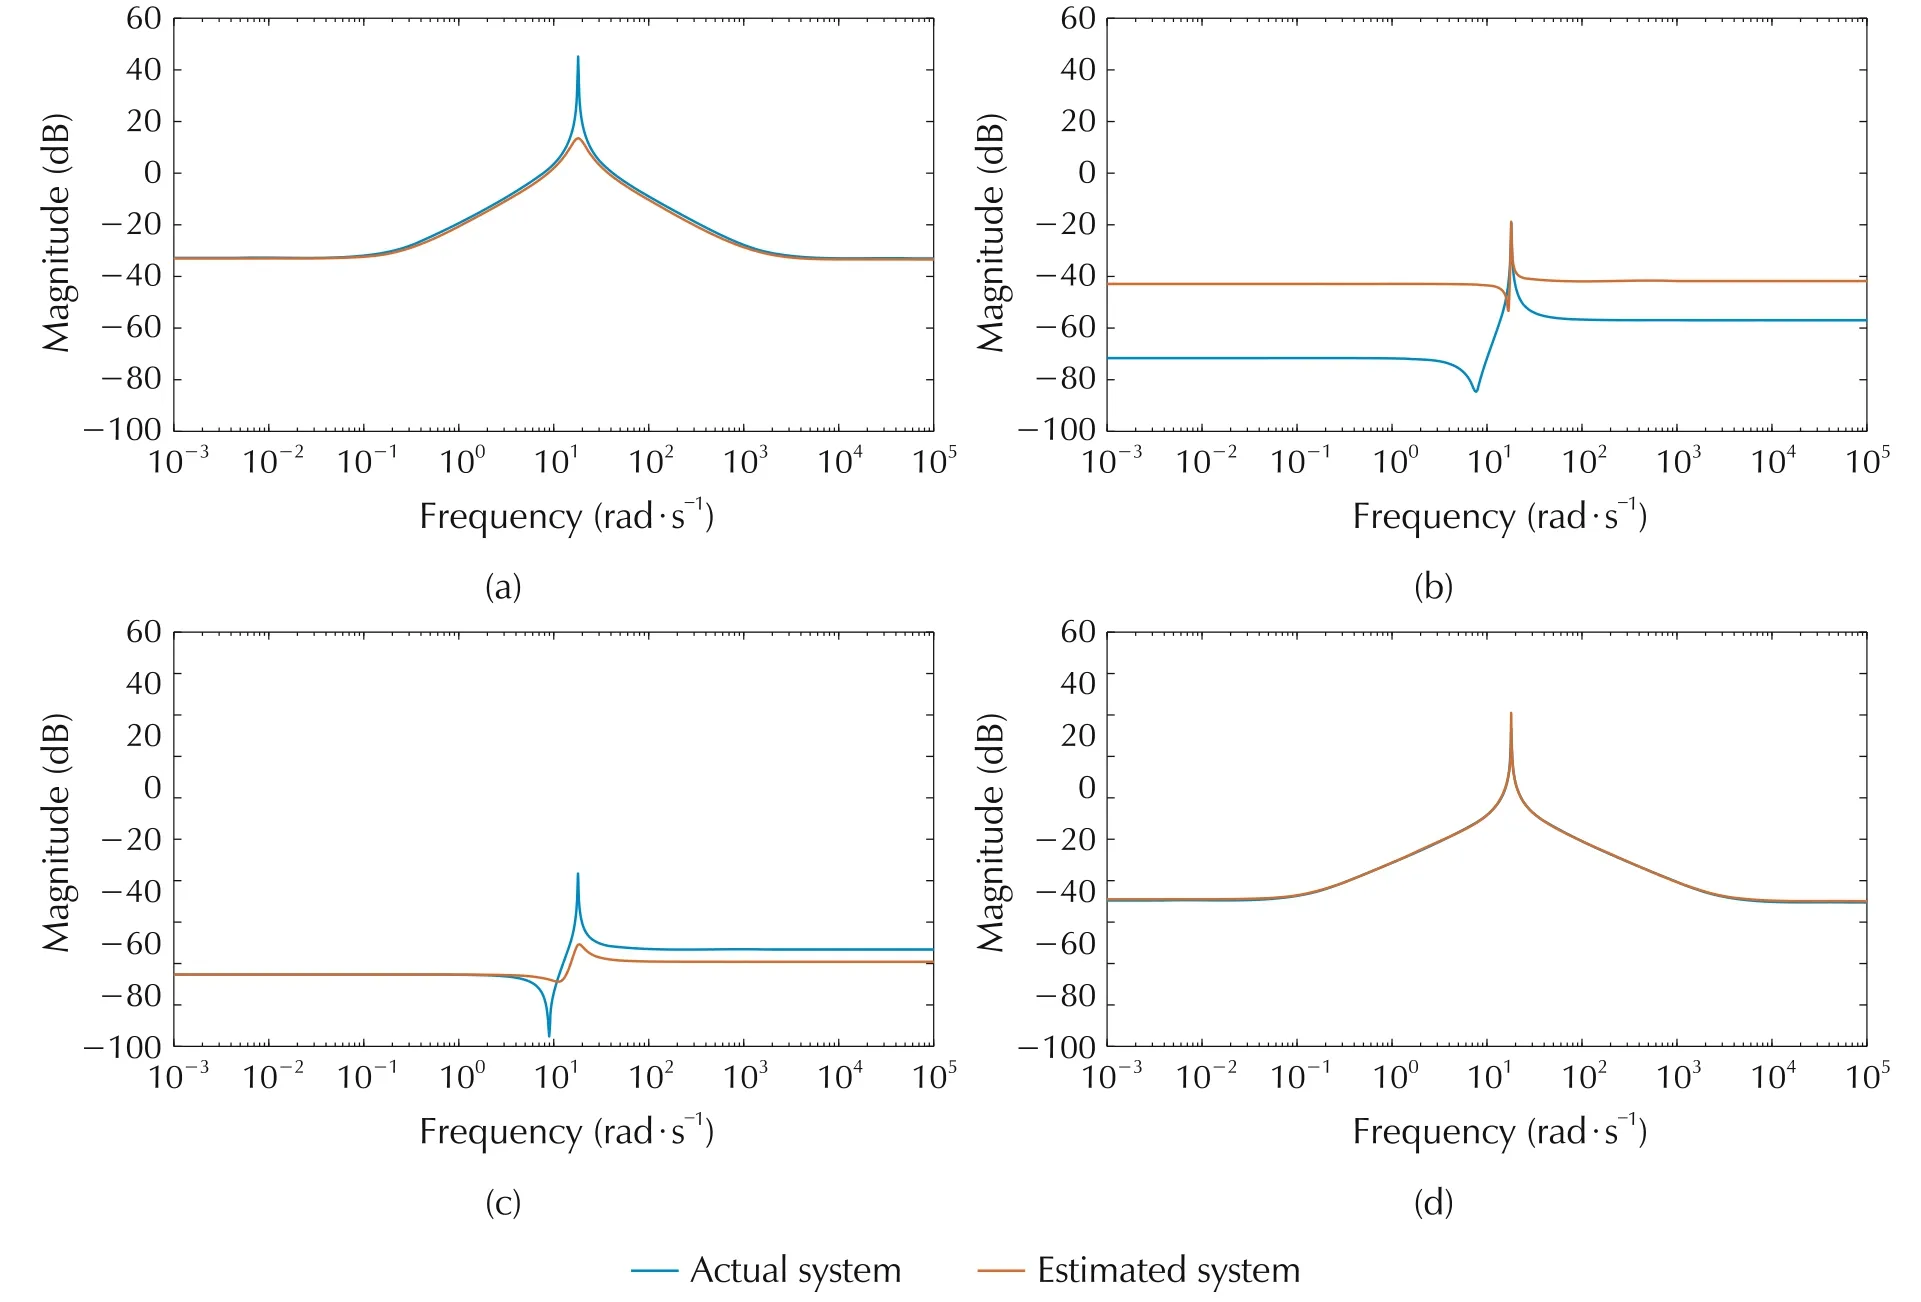
Fig.8 Actual and estimated system for m=4(proposed method).
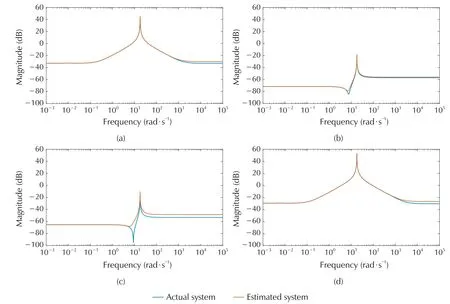
Fig.9 Actual and estimated system for m=5(proposed method).
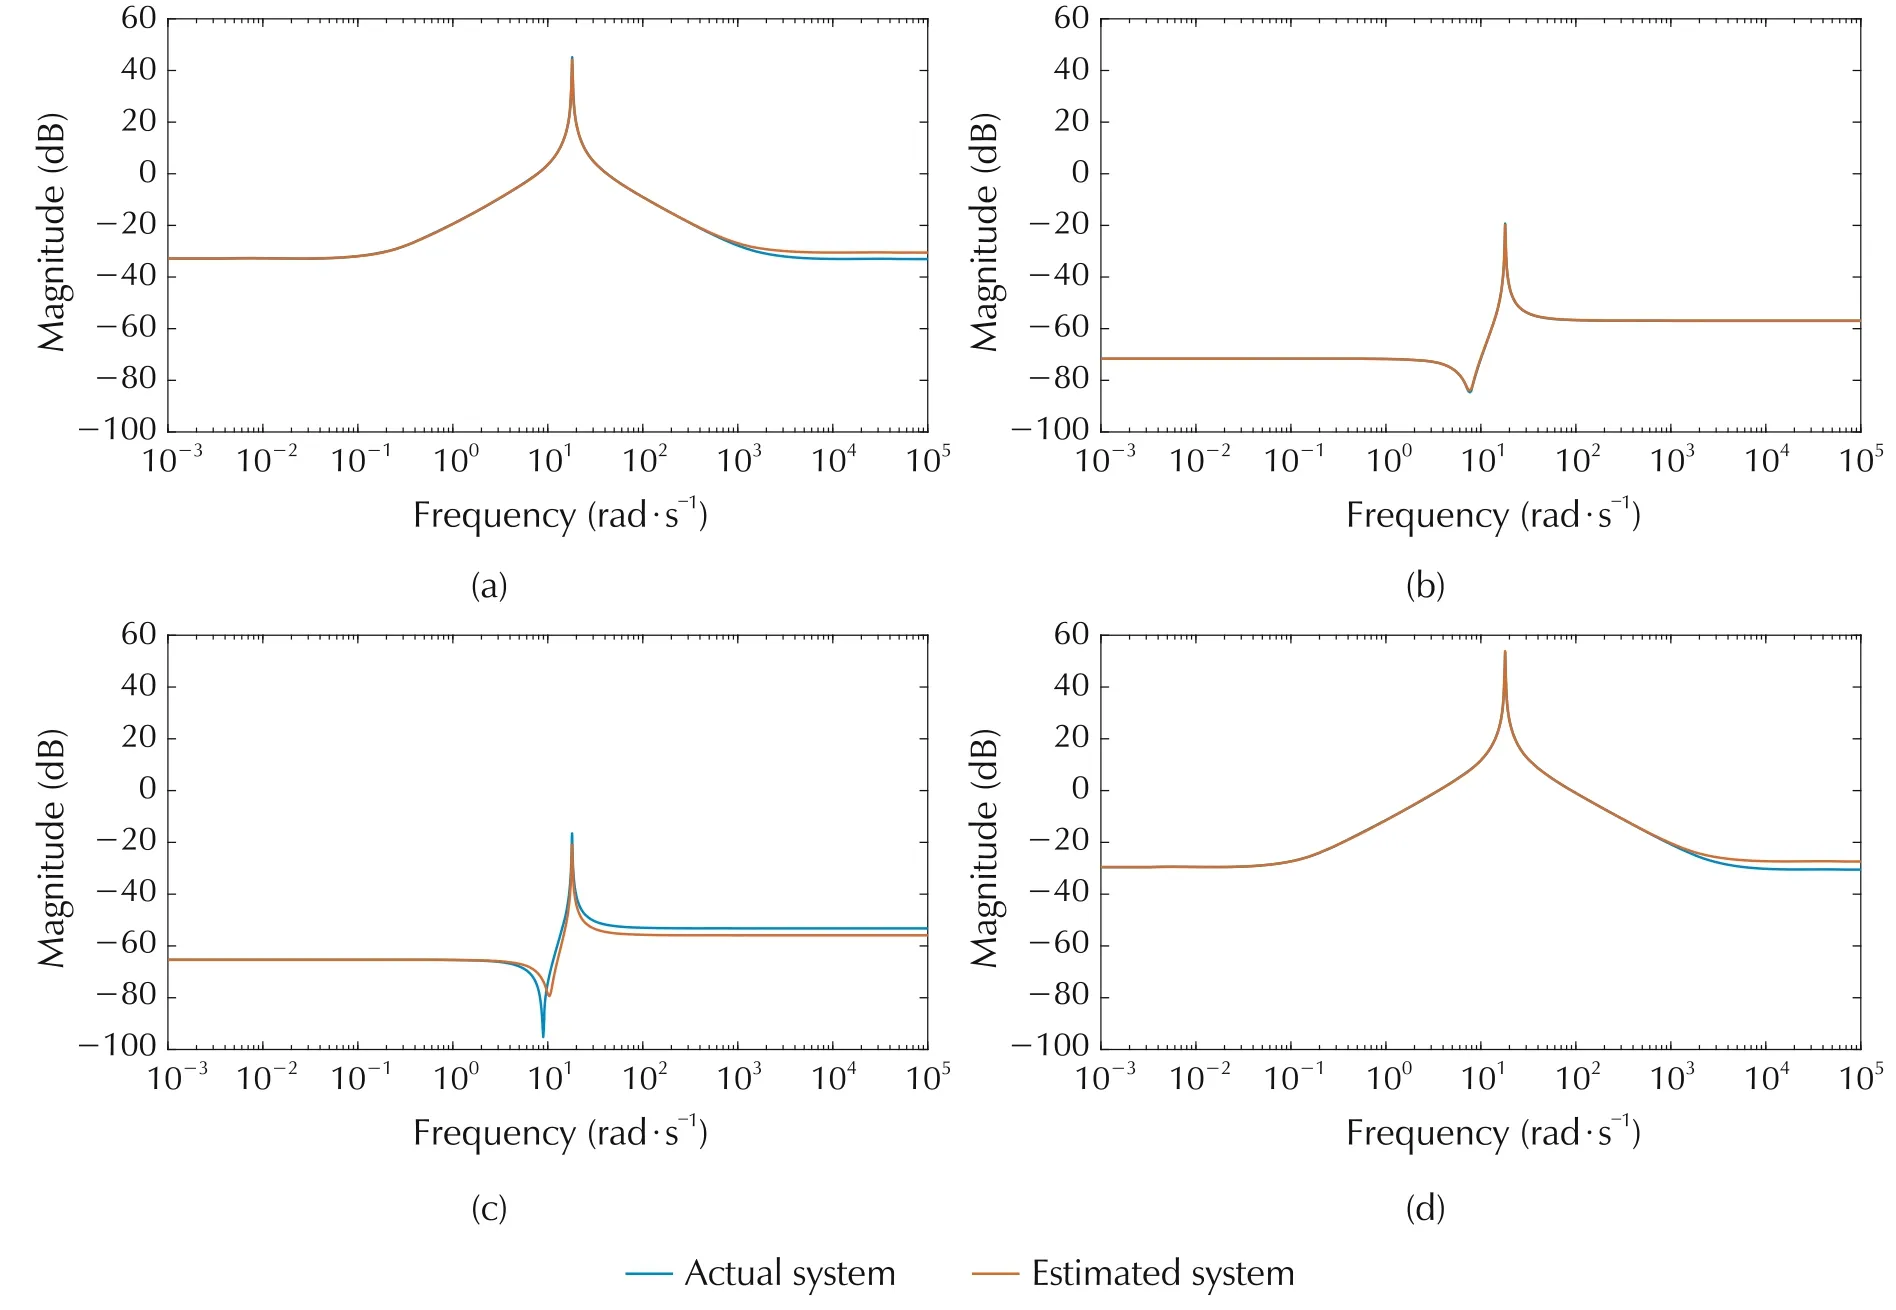
Fig.10 Actual and estimated system for m=6(proposed method).
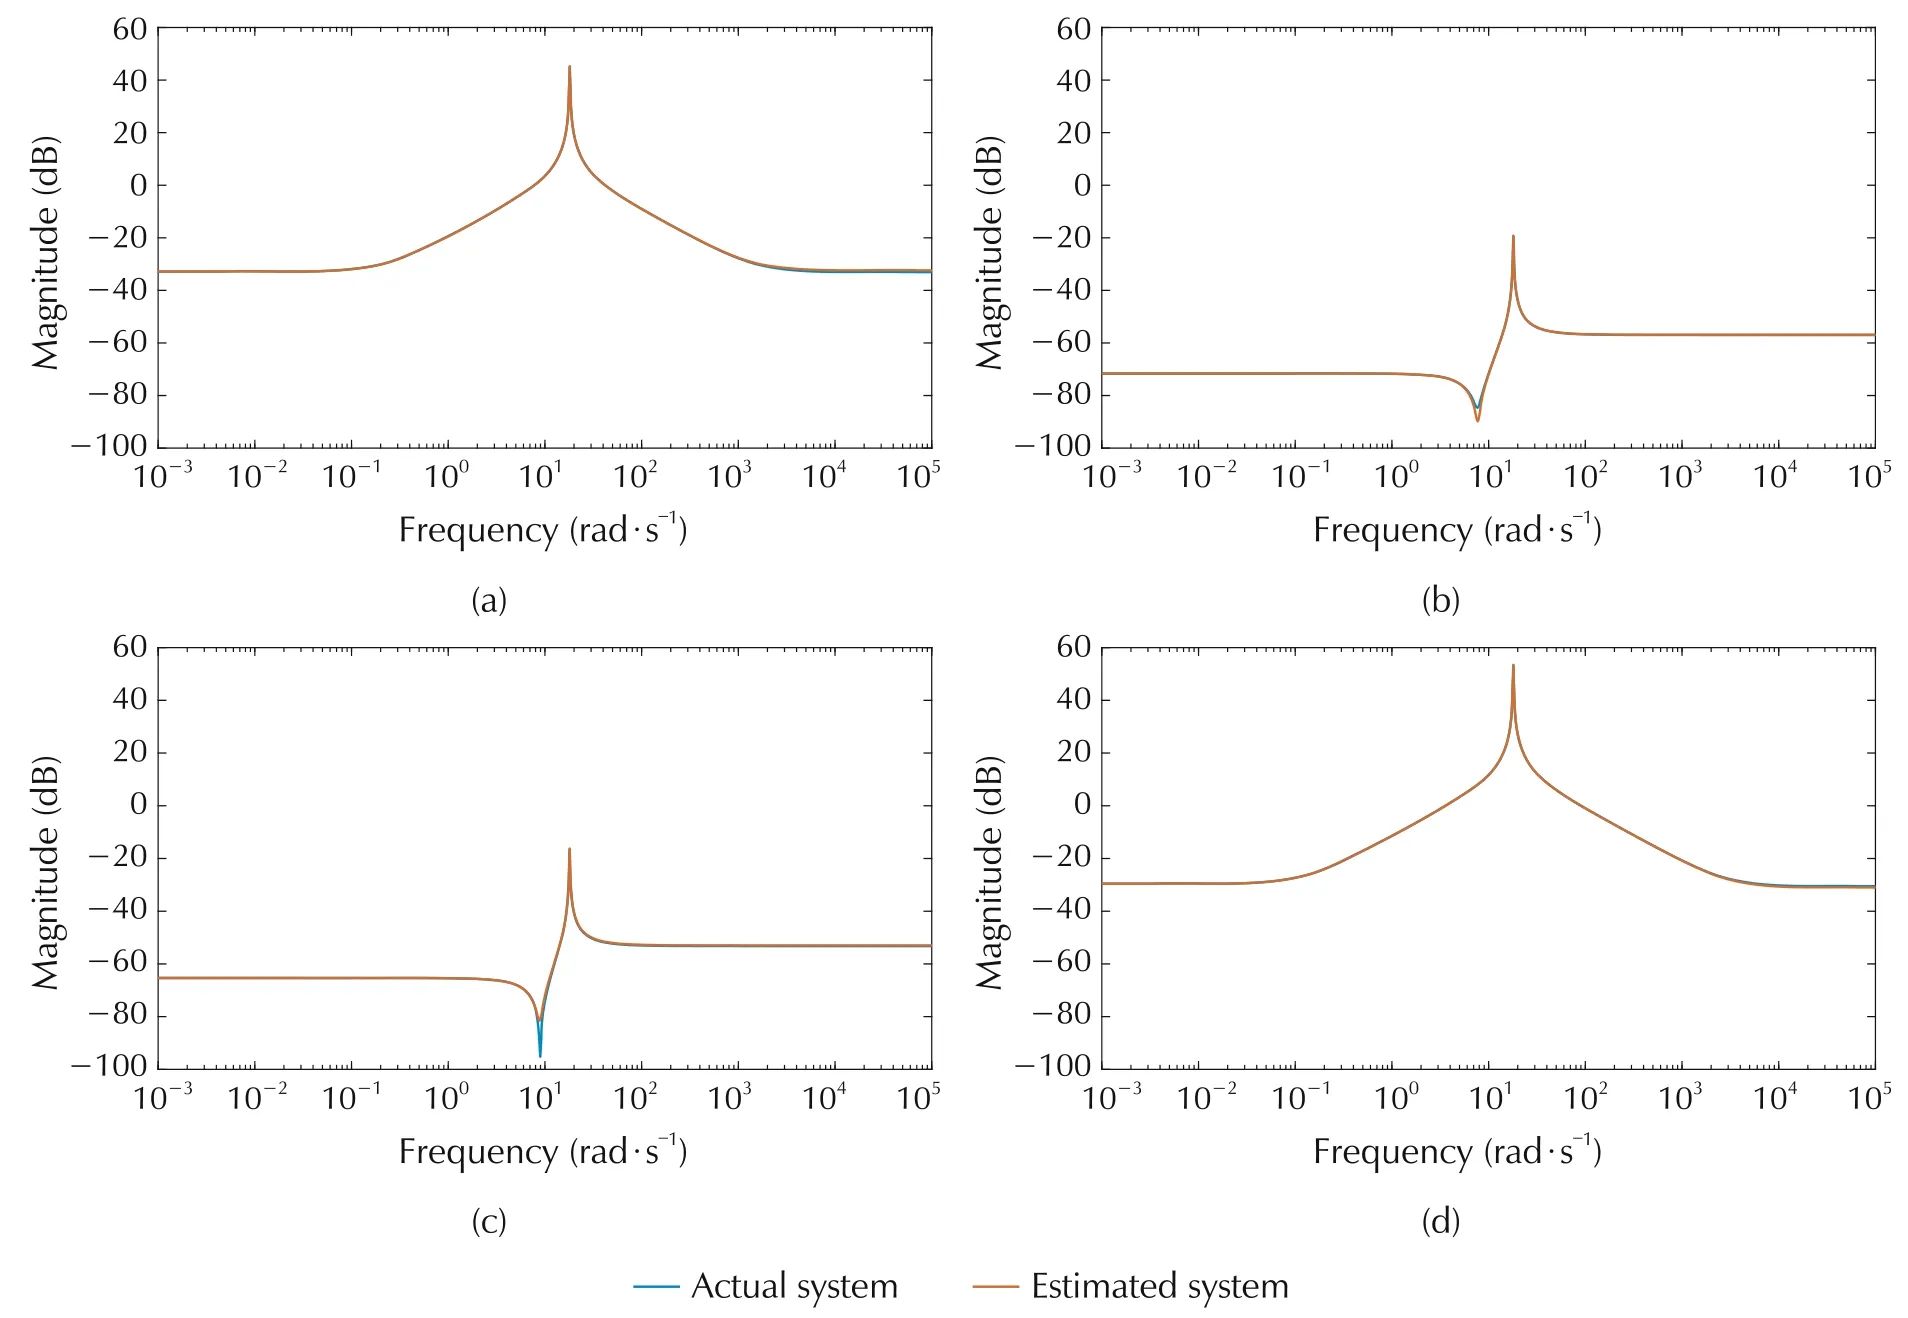
Fig.11 Actual and estimated system for m=7(proposed method).
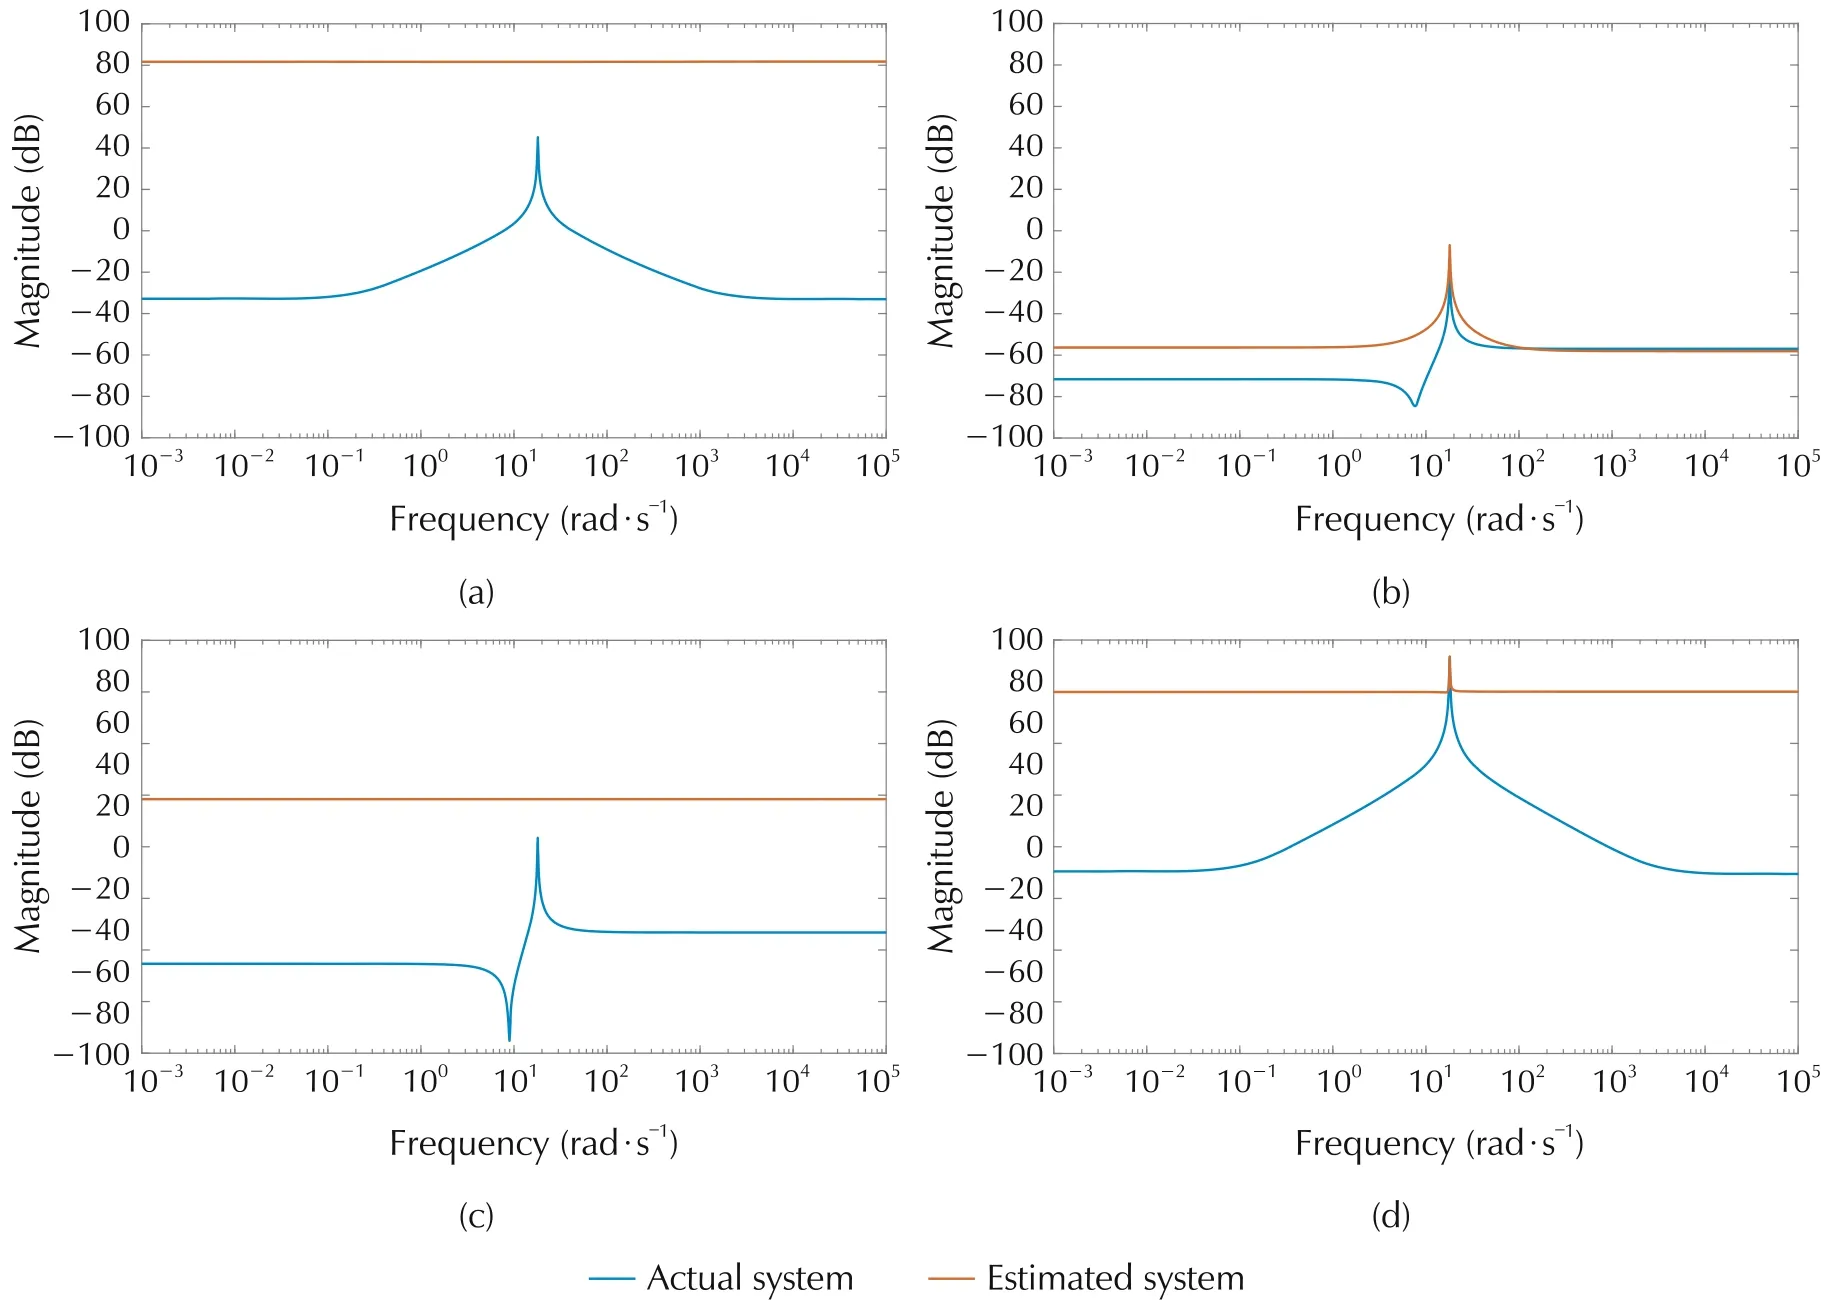
Fig.12 Actual and estimated system for m=3(state-of-the-art method).
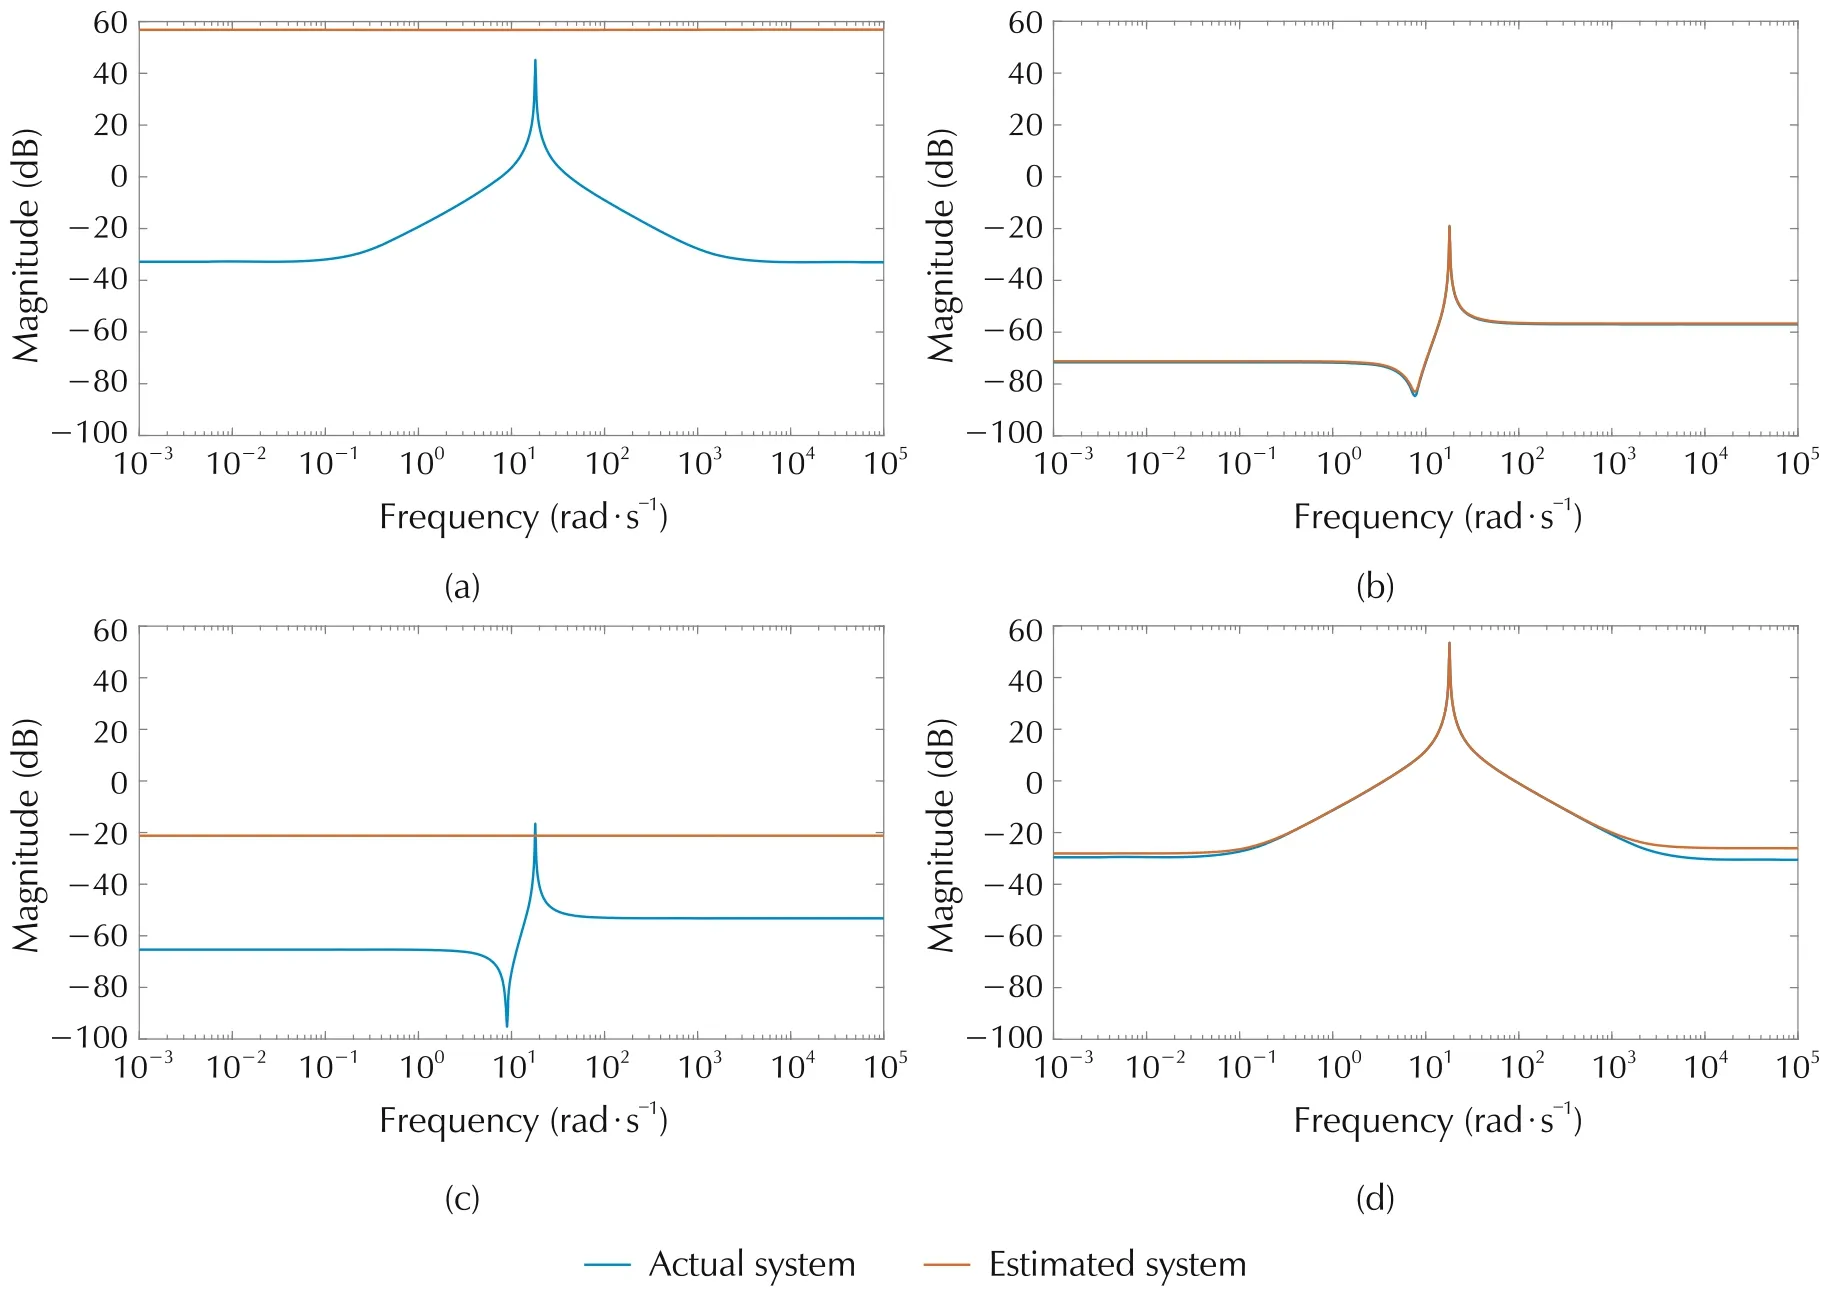
Fig.14 Actual and estimated system for m=5(state-of-the-art method).
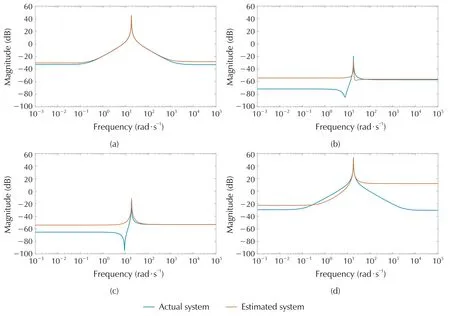
Fig.15 Actual and estimated system for m=6(state-of-the-art method).
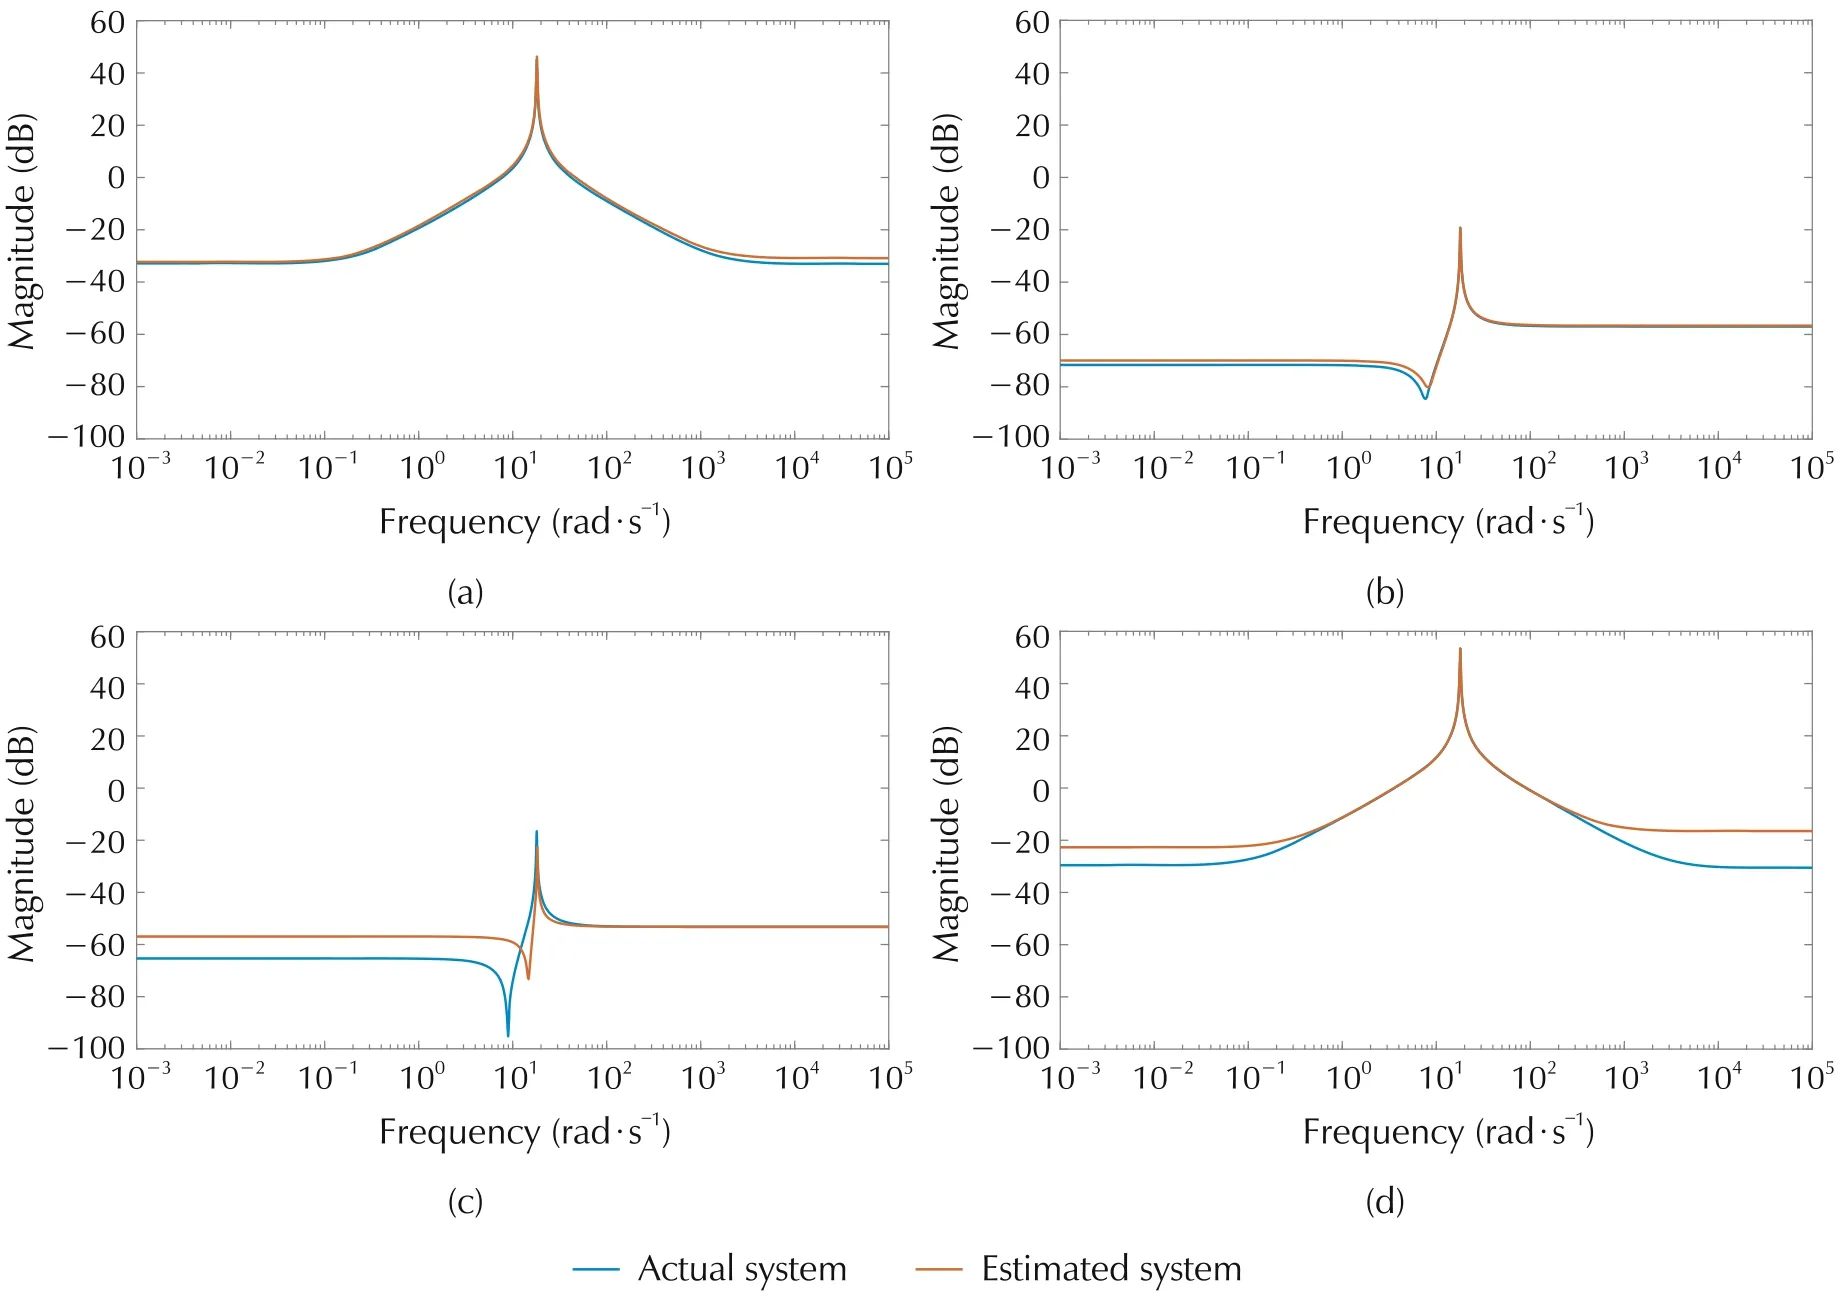
Fig.16 Actual and estimated system for m=7(state-of-the-art method).
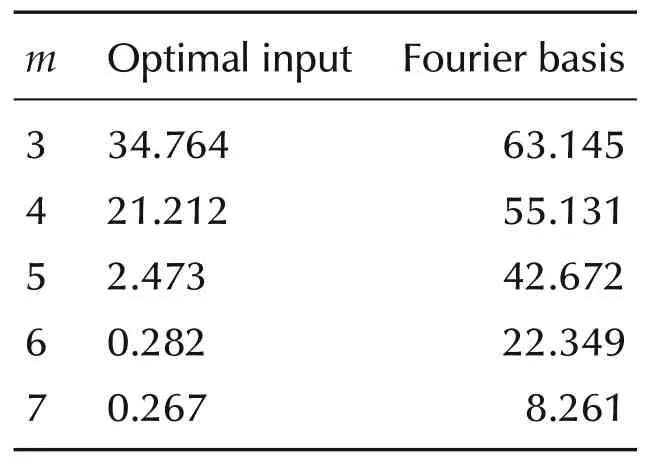
Table 2 MAPE for optimal input and Fourier basis for different m.
It can be seen that the MAPE for the proposed method is decreasing as m increases and is converging faster compared to the state-of-the-art method.
Note that Fourier basis can also be included in the proposed method.In the following this is proved for N=2.Let

Then
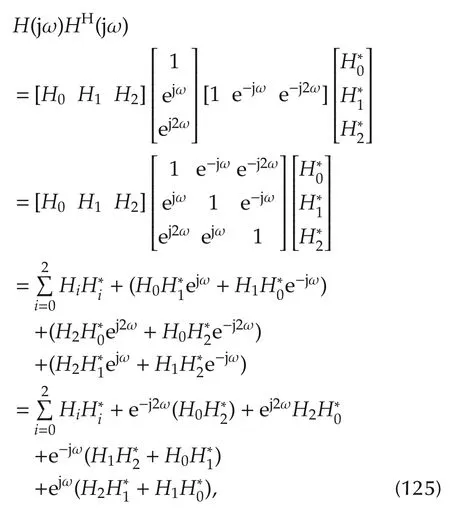
which is of the form

given in(34)where c-2,c-1,c0,c1and c2are appropriate matrices.
5 Conclusions
An approach for designing an optimal input for identifying a linear continuous MIMO system was presented.Unlike conventional schemes where the spectrum is parametrized in terms of covariance matrices or delta functions,the input spectra φu(jω)was first decomposed asH(jω)HH(jω),and H(jω)was parametrized as a matrix polynomial.The T-optimal cost function and the input and the output power constraints were parametrized in terms of H(jω).The positivity of the spectra was enforced by construction instead of KYP lemma which introduces additional variables in the optimization procedure.The resulting QCQP resulted in a non-convex semidefinite program with a rank one constraint and a rank relaxation was applied.The rank one solution for the relaxed problem turned out to be an optimal solution for the original non-convex problem.After determining the matrix polynomial,the inputs having the power spectral density φu(jω)were designed.Using subspace identification algorithm,the unknown system was estimated.The proposed algorithm was applied to identify a cantilever beam system with piezoelectric crystals attached to it.The system estimated using optimal input was shown to agree with the original cantilever system as can be seen from experimental results.
As mentioned in the introduction,the matrix polynomial in(51)can also be replaced by any other choice of basis in L2[-ωc,ωc],i.e.,

where Φkis a basis in.The exposition was kept simple by the usage of polynomials here.Usage of Gaussian or Wavelet kernels would enable the design of inputs having specific user desired characteristics.Future work deals with investigating more on the usage of these kernels.
Appendix
Proof for Theorem 1Note that a parameter θkis unique to a transfer function Gij(jω),i.e.,

while

Hence the cross terms

Hence,
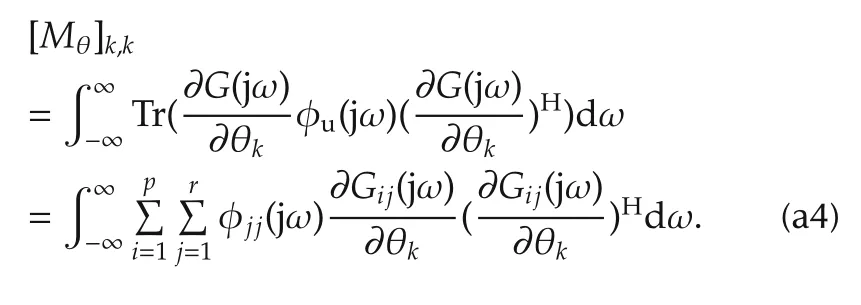
Applying(a4)in(13),trace of the FIM becomes

Using(a3)and(a4),it can be verified that

where

Therefore,

杂志排行
Control Theory and Technology的其它文章
- Parallel loop recovery with quiescent compensation for high performance feedback control of systems with imperfect actuators
- Nonlinear observer-based control design and experimental validation for gasoline engines with EGR
- Invariant observer design of attitude and heading reference system
- On the mechanism and control for the ultra-low frequency oscillation in NY Power Grid with large-scale hydropower
- Guaranteed feasible control allocation using model predictive control
- Diagnosability of a class of discrete event systems based on observations
