Air-vent layouts and water-air flow behaviors of a wide spillway aerator
2019-05-28JamesYangPenghuaTengChangLin
James Yang*, Penghua Teng, Chang Lin
a Vattenfall, R&D Hydraulic Laboratory, Älvkarleby, Sweden
b Concrete Structures, Royal Institute of Technology, Stockholm, Sweden
c Resources, Energy & Infrastructure, Royal Institute of Technology, Stockholm, Sweden
d Civil Engineering, National Chung Hsing University, Taichung, China
Keywords:Spillway Wide aerator Air entrainment Air-vent layout Jet trajectory CFDA B S T R A C T A spillway aerator should guarantee favorable flow conditions in the coupled water-air system even if the aerator is unconventionally wide. Eight air-vent configurations are devised and incorporated into a 35-m wide chute aerator for a generalized study. Computational fluid dynamics (CFD) simulations are performed to explore their effects on water-jet and air-cavity features. The Re-normalisation group (RNG) turbulence model and the two-fluid model are combined to predict the two-phase flow field. The results demonstrate appreciable influences of the vent layouts on the water-air flow. The air vents stir the air motion and re-distribute the cavity air pressure. Once the vent layout is modified, reciprocal adjustments exist between the jet behavior and air-pressure field in the cavity, thus leading to considerable differences in air-flow rate, jet-trajectory length, vent air-flow distribution across the chute, etc. The large width plays a discernable role in affecting the aerated flow. Telling differences exist between the near-wall region and the central part of the chute. To improve the duct pressure propagation, a gradual augment of the vent area should be assigned towards the chute center. Relative to single-slot vents across the flow, the layouts with segregated vents gain by comparison. A designer should see to it that a vented aerator operates satisfactorily for a given range of flow discharges.
1 Background
An aerator in a spillway structure aims to artificially entrain air into the high-velocity water flow and to prevent the spillway chute surface from cavitation damages. The local bottom offset deflects the water flow away from the bottom and an air cavity thus builds up. Inside the cavity, air is, because of the high flow velocity, entrained into the water jet's lower edge and transported by the flow. The cavitation risk is avoided or alleviated by the transported air bubbles nearest to the chute bottom. Downstream of the cavity, the entrained air detrains. As a result, the near-bottom air concentration declines streamwisely. An aerator protects thus a limited section of the chute [1–3].
Air is usually supplied to the aerator duct (groove) via a vertical shaft on each side of the chute. The water flow drives the air flow and governs the amount of air entrained. The air supply is affected by the geometry of the air passage that should have a sufficient cross-section, so that the aerator can “breathe” normally [4]. The air-vent layout forms an essential part of the coupled water-air system, thus having a bearing on the air motion. For a chute width below 10–15 m, the aerator is often just an offset or a single rectangular air slot. For estimations of the air demand, one often makes assumptions of the air-pressure gradient across the chute. However, prototype measurements show that there is not a general formula to follow; the air-pressure drop in the cavity is also moderately dependent on the flow discharge [5–8].
A spillway chute often accommodates the flood discharge from more than one gate, either segment or bulkhead. The Foz do Areia dam spillway on the Iguacu River, Brazil, is such an example, equipped with four radial gates and a 70.60-m wide aerator [9–11]. If the aerator width is larger than the conventional range, an air vent of merely an offset or a single air slot releases the air pressure in a short distance from the sidewall, which limits the penetration of the air flow towards the chute center. As a result, a large pressure gradient builds up locally close to the wall and leads to unfavorable air pressure conditions, which would in turn affect the air-flow distribution into the cavity and further into the water.
Aerator studies often focused on such aspects as streamwise cross-sectional shapes and aerator spacings for effective chute protection. Earlier experimental studies dated back to Pinto et al.[9], Volkart and Rutschmann [12] and Chanson [13] and recent studies to Pfister and Hager [7, 8], Chason [14] and Bai et al. [15].In the computational fluid dynamics (CFD) simulations, as in Ozturk and Aydin [16], Aydin and Ozturk [17], Zhang et al. [18],Bhosekar et al. [19] and Jothiprakash et al. [20], the characteristics of air entrainment and detrainment were examined mostly for offset-type air vents across the chute. A review was made by Bhosekar et al. [21] of the commonly used empirical formulas for estimations of parameters such as air entrainment rate, jet trajectory length and cavity sub-pressure. However, none of those formulas took into consideration the vent layout of an aerator;their suitability for use to wide chute aerators is therefore questionable.
Field measurements of air flows were often a way to verify laboratory results and evaluate the prototype behaviors. Tests were made at the Foz do Areia spillway under both symmetrical and asymmetrical conditions. The former referred to both the air shafts open to the atmosphere and the latter to only one shaft open (the other was sealed) [22, 23]. The results showed that the chute width had a significant bearing on air-pressure drops in the cavity and air-flow discharges. The pity was that the gate opening heights were not reported at different flow discharges. A few field tests of air flows were also summarized by Shi [24]. The measured parameters included air-flow rate, shaft air velocity and air concentration. The flow-rate results were even compared with laboratory values based on different model scales.Ozturk et al. [25] proposed a so-called bottom-inlet aerator,placed in the chute bottom downstream of the offset and composed of uniformly distributed circular air vents across the chute. Their aim was to improve, at low Froude numbers, the aerator performance in a wide chute. Teng and Yang [26] rearranged hypothetically the air vents in an existing chute aerator. By maintaining the same vent area, the air flow rate increased, and the entrained air became also more reasonably distributed in the flow.
Aerator air-flow conditions are affected by the air-vent layout; the air-pressure drop across the wide chute differs from the conventional assumptions [21, 26]. Engineering design has motivated the need to examine air-vent layouts in wide aerators, so that air-water behaviors are, in terms of air supply rate, air-pressure distribution and spatial air concentration, better understood. CFD modeling is therefore performed to evaluate a few typical vent configurations. The purpose of the study is to elucidate the effects of the geometrical layouts on water-flow features and to highlight differences as well as similarities between them,whereby a better understanding of air-vent layouts is provided as design guidance.
2 Geometrical Layout
The study is based on the chute aerator of a prototype spillway constructed recently in Sweden. Its downstream view is shown in Fig. 1a. The spillway features a single upward-going segment gate, with a 25.00 m width and a +112.75 m crest elevation. The full reservoir water-level elevation is +123.00 m; the corresponding flow discharge amounts to 1500 m3/s at the full gate opening [27, 28].

Fig. 1. Gated overflow spillway (25.00 m in width) with an aerator and shafts on both sides: a View from downstream; b Longitudinal profile.
An aerator with air shafts exists in the chute to avoid cavitation. The longitudinal profile of the spillway is shown in Fig. 1b and the details and dimensions in Fig. 2. The centerline of the aerator groove is 27.82 m downstream of the crest location; its bottom is 14.75 m below the crest elevation. Upstream of the air duct, the chute slope angle with the horizontal is= 32° and downstream of it= 30°. With the chute bottom, the deflector angle is 8°, implying that its slope with the horizontal is 24°(1:2.25). Inclusive of the deflector height, the total aerator off-set height is 1.50 m (from el. +98.00 to +99.50 m); the air duct area is 5.00 m2across the chute.
The width between the two spillway piers is 25.00 m. From the pier ends, the chute expands sidewards in the flow direction.On each side, the diverging sidewall runs first straight at an angle of 17.35°; it then transits tangentially to the air shaft via an arc of a 20 m radius. Between the two shafts providing air to the air duct, the chute width is B = 35.00 m. Downstream of the shafts,the chute remains the same width. Accounted from the duct bottom elevation, the shaft height is 21.00 m. The shaft is of rectangular shape, with an area of 8.70 m2. The intake is funnelshaped.
Based on literature review and design experiences, eight layouts of air vents are devised for a general evaluation. Studies are made for a few more cases than the specified. Those that give similar or non-typical results are excluded; some of the layouts are adjusted with reference to the already modelled cases. Preliminary modeling shows that the duct pressure drop becomes smaller towards the middle. The vent area is therefore designed to increase from the sidewall to counteract this.
In the prototype, the total air-vent area of the aerator amounts to A0= 13.00 m2and this is assigned to all the layouts examined. In each layout, the vents are symmetrical to the center-plane. As illustrated in Figs. 3 and 4, the layouts are divided into two categories. Category I refers to a single opening (A, B, C and D); Category II to a series of segmented openings (E, F, G and H). Table 1 specifies their geometrical configurations, in which b = width of an air vent or its sectioned width and h = airvent height. The prototype aerator possesses 17 vents. This is the reason why the same number of vents is also used for layouts E,F and G, where the vents are equidistantly distributed and the distance between two neighboring vent centerlines is Lcl=2.140–2.156 m.
Figure 5 shows, for each layout, the change of the accumulated vent area (Ay) from the sidewall to the centerline. Category I features continuous increases in area, while Category II is characterized by stepped profiles. Type A, with a linear Ayincrement,can be treated as reference for Category I. The vent area of Types B, C and D is smaller close to wall and becomes gradually larger towards center. Type D is marked with the smallest to largest gradient (|dAy/dy|) from wall to center. Type E acts as reference for Category II. The changes in Ayfor Types F, G and H are in an analogous manner; Type H has the smallest to largest gradient from wall to center. This implies that, in its respective category,Types D and H are assigned to the largest area in the middle.
For the design of the spillway, physical hydraulic model tests were previously performed, thus providing the numerical modelling with data of flood discharges [29, 30]. The 3.00 m partial gate opening is chosen for the modelling purpose, which is applied to all the vent layouts. The corresponding flow discharge Qw= 711 m3/s (constant). At the aerator offset, the correspond-ing mean flow velocity is V = 15.63 m/s, the mean water depth is H = 1.30 m and the aerator Froude number F = V/(gH)0.5= 4.38,in which g = gravitational acceleration.

Fig. 2. Chute layout with an aerator and air shafts: a chute lateral expansion and air shaft dimensions; b dimensions of aerator groove.
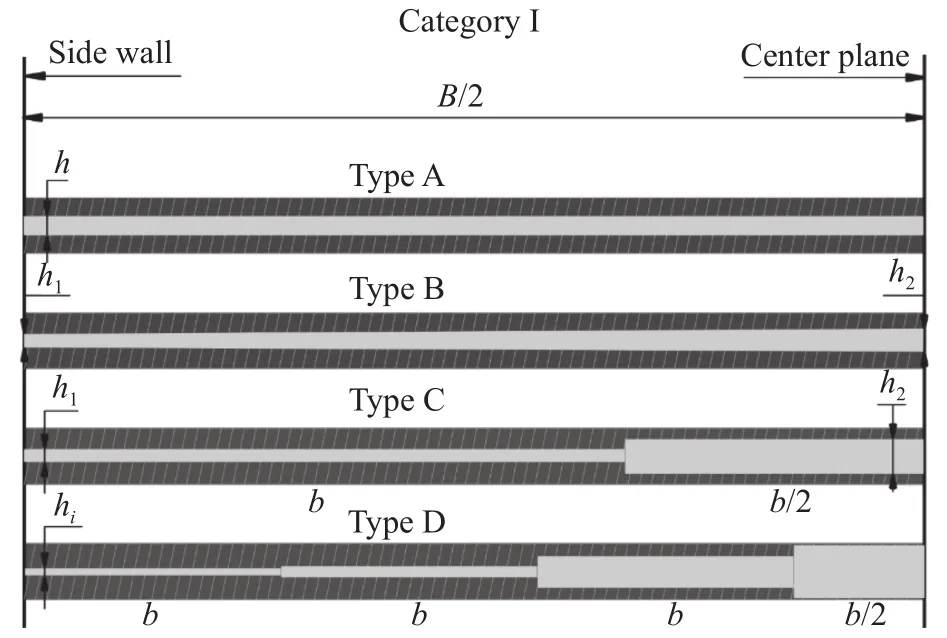
Fig. 3. Category I, vent layouts with a single opening (slot).
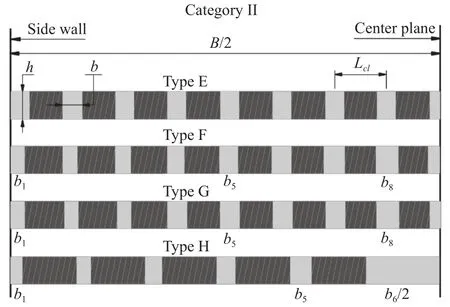
Fig. 4. Category II, vent layouts with multiple openings (segregated holes).
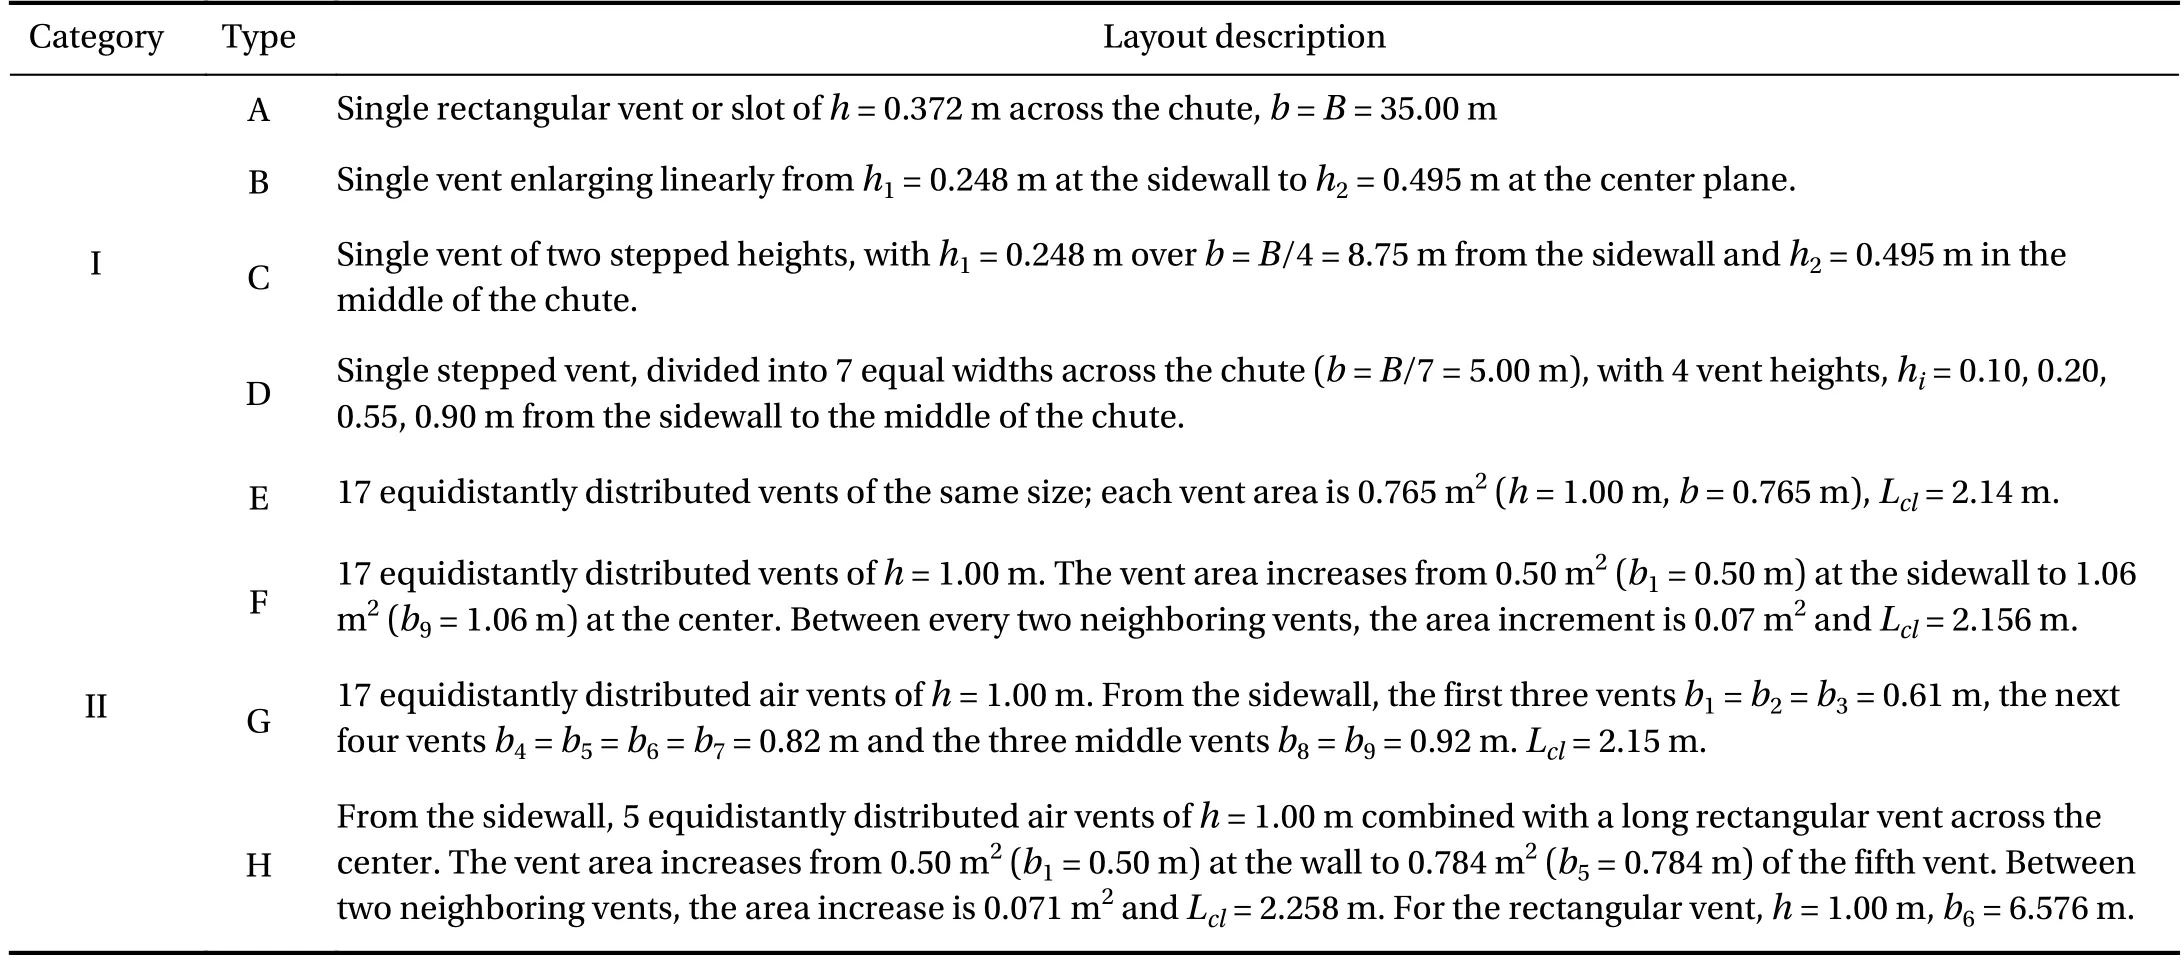
Table 1 Two categories of aerator air-vent layouts.

Fig. 5. Accumulated vent area from the sidewall to the chute center: a Category I; b Category II.
3 Numerical Model
The FLUENT software in ANSYS (version Academic Research Release 15) is used to examine the effects of air-vent layouts on air-water flow behaviors in the chute with the aerator[31]. The two-phase two-fluid model and the Re-normalisation group (RNG)turbulence model are combined to produce the flow field.
3.1 Two-fluid model
The two-fluid model is based on ensemble-averaged mass and momentum transport equations. For each of the two phases,the continuity equation reads


3.1.1 Interphase force G
The term G is the interphase force per unit volume of mixture, comprising the friction between two phases, pressure, cohesion and other effects.

in which f = dimensionless drag function, A = interfacial area between the phases,= particulate relaxation time and D = airbubble diameter. In the dispersed flow, f dominates air-bubble movements, acting as resistance due to non-even pressure distributions of the surrounding water.

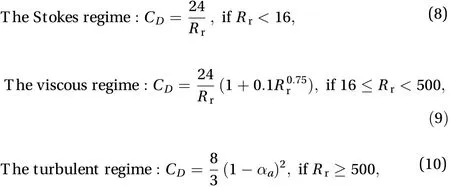
in which CD= drag coefficient and= relative Reynolds number.
For a family of air bubbles with defragmentation and coalescence, the effect of air concentration is represented by an effective continuum viscosity, μm= μw/(1−αa).is thus written as [32,33]

Dependent on the flow regime prescribed by the Rrvalues, CDand f are accordingly calculated in light of the following expressions [34, 35]
3.1.2 Interfacial force M
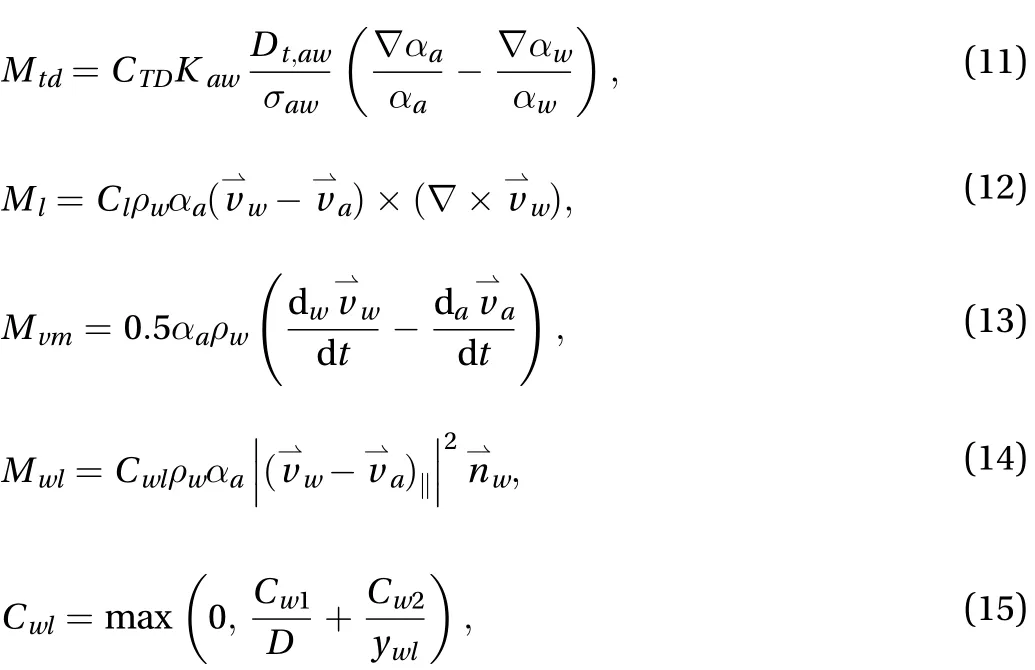
In the two-fluid model, the air bubbles are spherical. The term M is the interfacial momentum exchange (per unit mixture volume), composed of four parts, i.e. turbulence dispersion force Mtd, lift force Ml, virtual mass force Mvmand wall-lubrication force Mwl. The hydrodynamic force Mwlis generated due to the unbalanced drainage around an air bubble near to a wall boundary. They are written as [36‒39]in which CTD= constant,= dispersion Prandtl number, Cl= lift coefficient and d/dt= phase material time. The embedded values are CTD= 1.0 and= 0.75 in Fluent= phase relative velocity component tangential to wall surface, ywl=distance to wall,= unit normal pointing away from wall and Cwland Cw2= coefficients (Cwl= −0.01, Cw2= 0.05).
3.2 Turbulence model
The two-fluid model is incorporated into the RNGturbulence model to determine flow parameters of each phase. Via the physical properties and velocities of the water-air mixture,themodel for single phases is extended to two phases [31,40, 41]. The transport equations read

in which k = turbulent kinetic energy,= turbulent dissipation rate,= mixture velocity,= mixture densitymixture viscosity, Sk,m,= source terms,= inverse effective Prandtl numbers and Gk,m= production of turbulent kinetic energy.andare constants (= 1.42,= 1.68).refers to the effects of rapid strain and streamline curvature. The turbulent mixture viscosity is written as

4 Model Setup
4.1 Computational Domain and Mesh
The computational domain is illustrated in Fig. 6a, in which a coordinate system (x, y, z) is defined. x-y is placed on the chute surface, with x = 0 at the offset and positive x-axis downstream.Positive y-axis points to the left sidewall, with y = 0 at the chute center. The z-axis is perpendicular to the chute, with z = 0 at the surface and positive z-axis upwards.
With the flow considered symmetrical about the chute center plane, only one half of the flow is simulated. The upstream end of the domain is at the 25.00 m gate position, with a 3.00 m gate opening and Qw= 711 m3/s. Measured along the chute surface, the downstream end is 31 m downstream of the offset. Both the inflow into and the outflow from the domain are supercritical. Above the entrance of each air shaft, a sufficiently large space is included to model the air inflow.

Fig. 6. Spillway chute with aerator: a Computational domain; b Numerical mesh with 610000 hexahedral cells (for air-vent Type A).
The prerequisite for any reliable simulations is a quality mesh. Structural grids of hexahedral shape are generated in the program Gambit [30]. The spatial discretization is based on the second-order upwind scheme, with higher-order levels of accuracy achieved at cell faces. For each governing equation, it is possible to select a different discretization scheme.
The numerical results must be grid independent, which is evaluated with respect to the common procedure, grid convergence index (GCI) [42]. A coarse mesh with 380000 cells is first generated. It is then refined three times to obtain finer grids, resulting in approximately 490000, 610000, and 740000 cells, respectively. The global refinement is complemented with local refinements e.g. around the offset and the air vents and along the free surface. The evaluations indicate that the mesh with 610000 cells is sufficiently dense to model the aerator flow. The total number of cells varies slightly between the types.
For air-vent Type A, the chosen refined mesh is shown in Fig.6b. The minimum cell size is 5 cm at the aerator. Close to a solid boundary, a non-dimensional parameter usually measures the grid density's reasonability,, where= shear velocity and d = distance of the first cell to the boundary. It should be in the range between 10 and 100 [43]. The resulting y+values fall within the range 10−50. The enhanced wall function is activated to cope with the viscous layer.
4.2 Boundary conditions
The boundary conditions are illustrated in Fig. 7. The upstream boundary is specified as a velocity inlet with a 9.49 m/s velocity and a 3.00 m water depth. The downstream boundary is given as a pressure outlet with free outflow, with unknown flow velocity and water depth. The top surfaces of the domain and the shaft intakes are given as pressure inlets with the atmospheric pressure, allowing free air flow in or out. The remaining boundaries, inclusive of the radial gate's downstream skin plate, are treated as walls, with no-slip condition irrespective of phase. The chute center-plane is given a symmetry condition.
4.3 Bubble Diameter D
The water-air exchange is a dominant issue in aerator flow simulations and is affected by air bubble dimensions. All air bubbles are assumed to be spherical in the Two-Fluid Model.The bubble diameter (D) is a primary parameter and a representative value needs to be explicitly specified by the user.
Very seldom, one finds air-bubble data from prototype aerators, which is mainly due to measurement difficulties. Most observations are from laboratory tests. Based on the studies by Pfister and Hager [7, 8], Takahashi et al. [45], Chen et al. [46] and Yuan [47], D values are commonly below 4.0–5.0 mm. Close to the chute bottom, D is in the lower range, i.e. D = 0.1–3.0 mm.
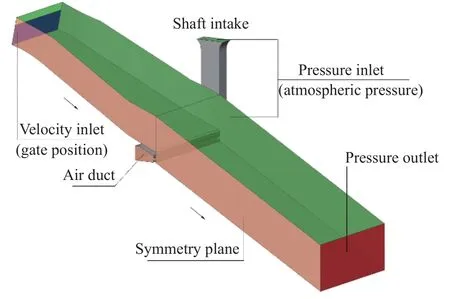
Fig. 7. Computational domain with boundary conditions.
The study by Teng et al. [48] indicates that the air-cavity length is weakly affectedly by D; the air flow rate of the aerator increases moderately with an increase in D. For D = 1.0–4.0 mm,the maximum difference amounts to 9%. In this study, D = 1.0 mm is chosen for comparisons among the eight vent layouts.Choice of another D value (e.g. 2.5 mm) leads to another set of results and does not affect the conclusions, as the comparisons are relative for a given D value.
4.4 Iterative convergence
Numerically, the aerator flow is solved as a transient approaching a steady state. With a fully implicit scheme, the choice of time steps is not governed by any stability criterion [31].However, to solve a transient flow, the time step is usually set at least one order of magnitude smaller than the smallest time constant in the system. A common way to judge its choice is to count the number of iterations to a converged solution. 5–10 iterations per time step are ideal. With more iterations, the time step is too large and vice versa. The convergence is reached if the normalized residuals for each equation are lowered by at least three orders of magnitude. The check is made for each time step.
5 Results and discussions
Among the layouts, their similarities and differences are typically illustrated with such parameters as the amount of air supply, air-cavity length, air-flow field and air concentration in the flow. Unless otherwise specified, the results refer to the steadystate results with time-averaged values.
To exemplify a general longitudinal view, Fig. 8 illustrates, for Type A, the instantaneous water-air flow velocity pattern along the center plane. The two solid lines of air concentration C = 0.90 outlines the shape of the jet trajectory. At the offset, V = 15.63 m/s, leading to a 22–24 m/s flow velocity in the jet impact area.Within the cavity, the air-flow velocity amounts to about 2.50 m/s at 1.00 m from the vent and increases downstream along the cavity's upper part. A circulation zone, though very narrow, of water-air mixtures occurs on the chute base. At the end of the cavity, strong shear actions take place between the jet and the base, also leading to air entrainment.
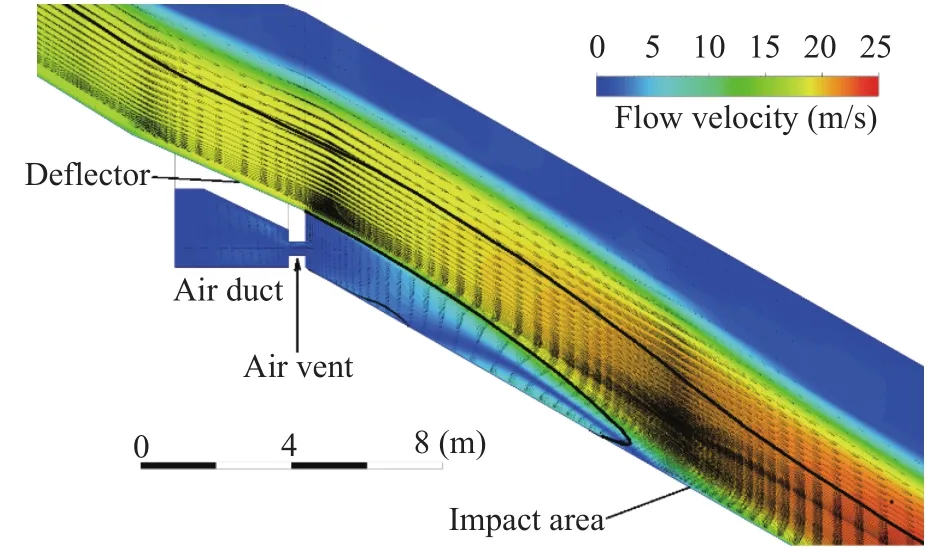
Fig. 8. Instantaneous streamwise flow pattern along symmetry plane (Type A).
5.1 Air-pressure distributions
Due to the significant difference in density between water and air, the cavity air-flow field is susceptible to the water flow.The resulting air-flow pattern typifies one aspect of the interplay between the two fluids and marks the appreciable influence from the vent layouts.
Within the air cavities of both categories, Figs. 9 and 10 present the instantaneous air-flow fields, plotted with velocity vectors and colored by the air-pressure drop (, Pa).is defined as the difference between the atmospheric pressure(patm, Pa) and the gauge pressure (p, Pa), i.e.= patm– p. The color scale in each panel depends on its maximum value (,Pa) and varies between the panels. The transects are parallel to the chute base and through the centerline of the air vents; they are all at a 0.43-m distance from the base. The downstream boundary in each plot corresponds approximately to C = 0.90.
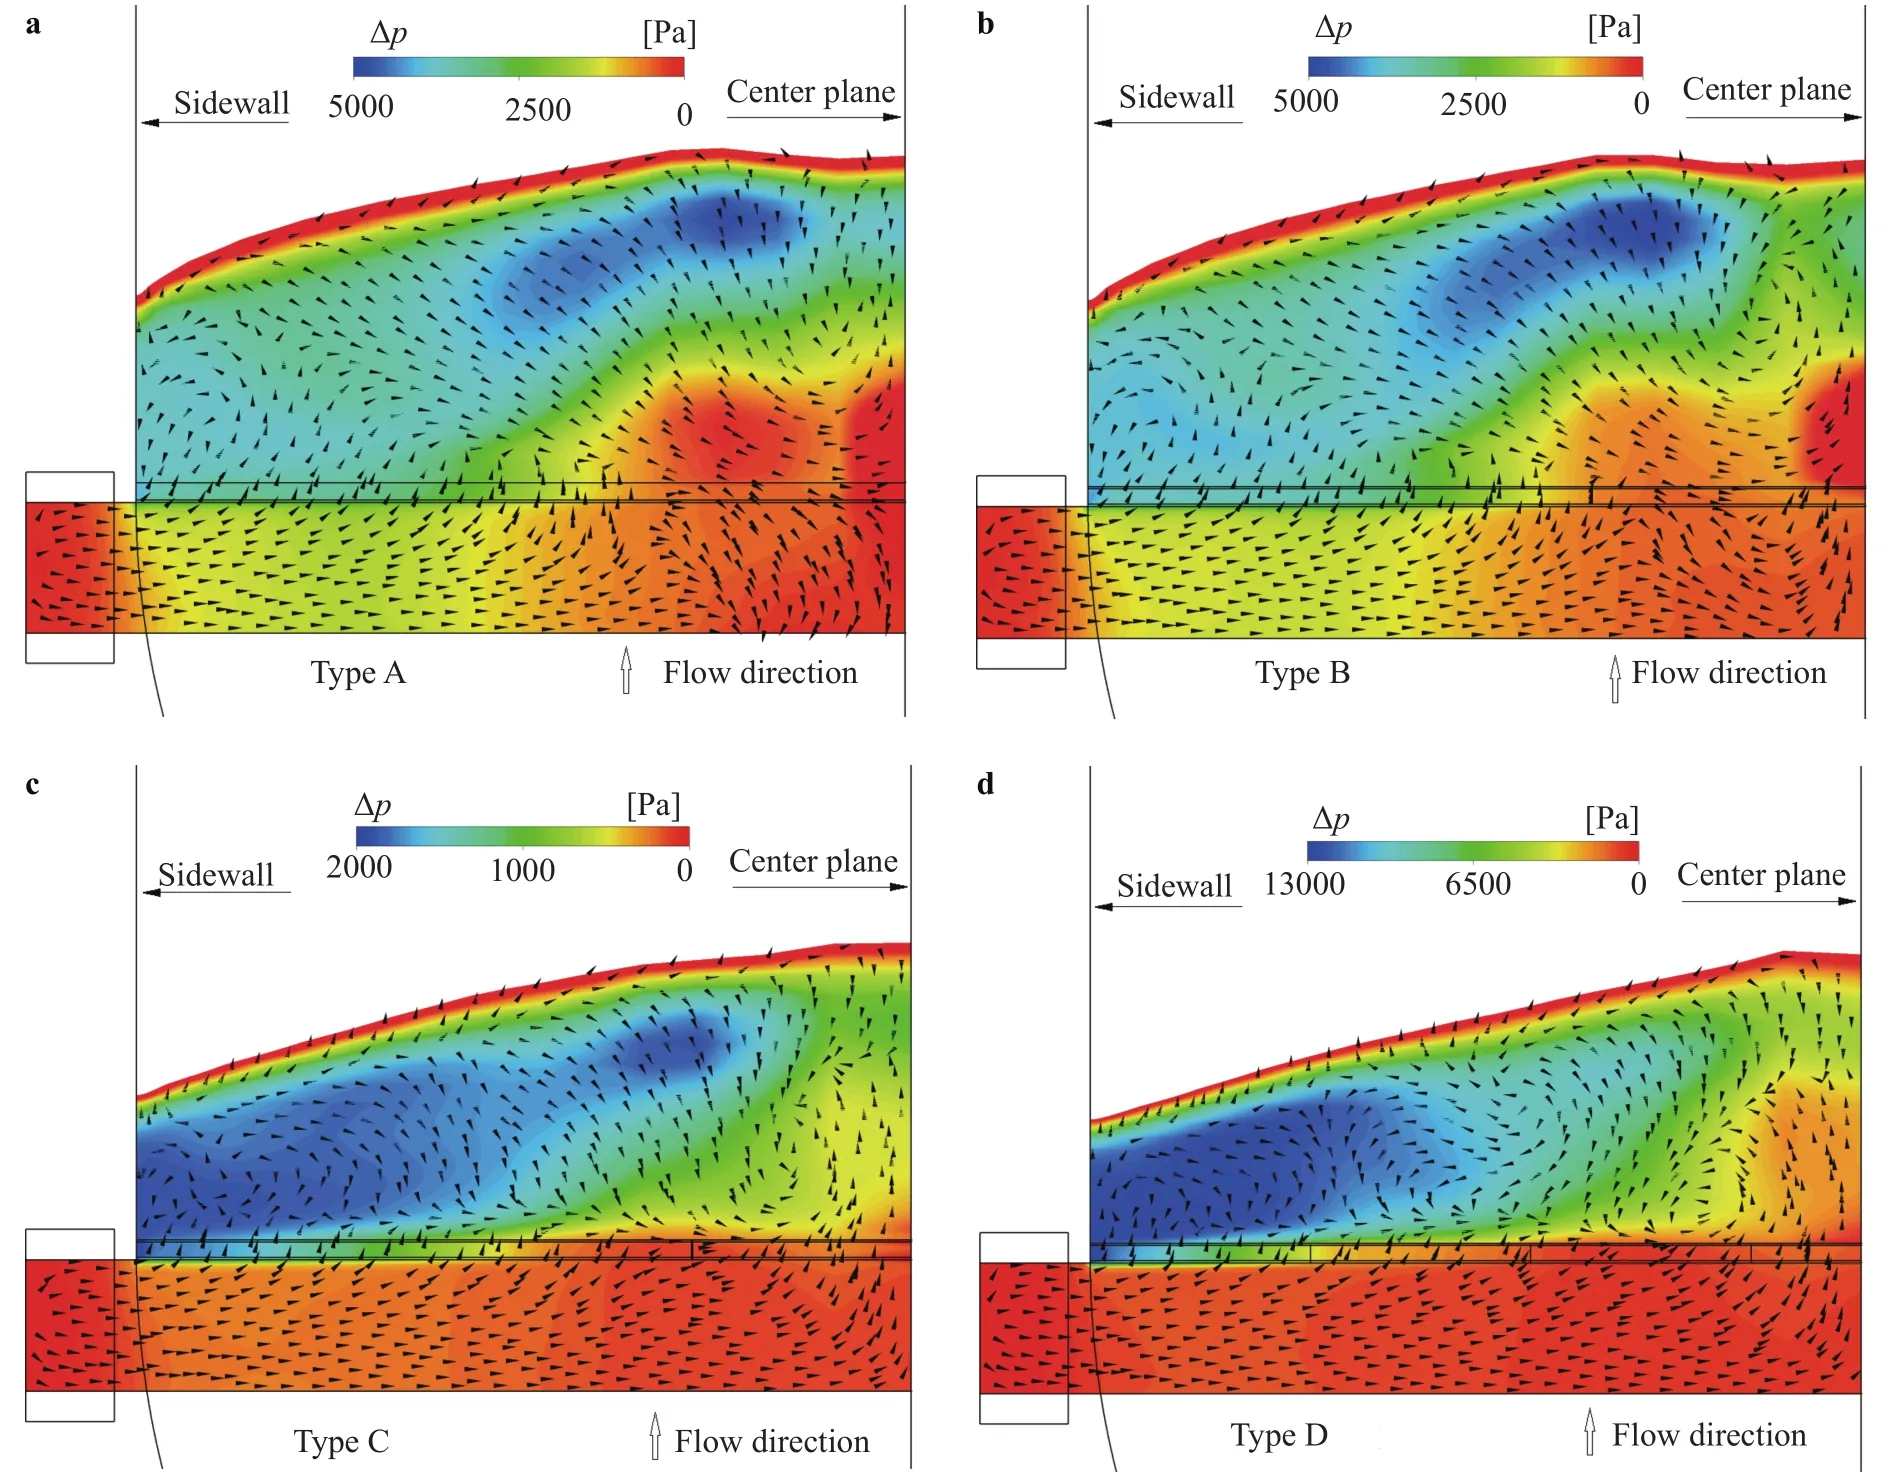
Fig. 9. Air-vent Category I, instantaneous air-flow pattern in the cavity, colored by: a Type A; b Type B; c Type C; d Type D.
The major aspects indicative of the differences include air-flow circulation pattern, air-cavity extension and air-pressure drop. A common belief is that the air in the cavity moves in the same direction as the water flow in the chute. The simulations show that this is not exactly the case. The cavity air flow exhibits a complex pattern with circulations along planes both parallel and perpendicular to the chute surface. The panels indicate that the air flow demonstrates swirling motions, resulting from uneven pressure gradients. In Types A and B, it is noted that backward flow into the duct occurs. It seems that the slot close to the wall releases much air from the duct, generating a high-pressure region in the cavity's middle part. The duct pressure is insufficient to drive the air into the cavity. The return flow of surplus air disappears in the other vent types.
Imagining that the air-vent types were exchangeable, there would be reciprocal adjustments between the cavity air motion and the water jet movement until an equilibrium state was reached. A lower cavity pressure would e.g. give rise to a shorter cavity (length) and associated adaptation of other indexes. With a single slot across the flow, Category I is characterized by highervalues than Category II with segregated vents. Thevalues are summarised in Table 2. In Category I, Types A and B are comparable, while the reduced vent heights close to the wall create much lower pressures in its vicinity. Too low pressures might cause air choking. In Category II, thevalues are much smaller and their differences are minor.
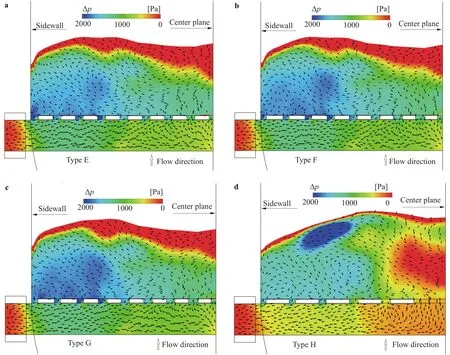
Fig. 10. Air-vent Category II, instantaneous air-flow pattern in the cavity, colored by: a Type E; b Type F; c Type G; d Type H.
Table 2 Maximum air-pressure drop () in the air cavity.

Table 2 Maximum air-pressure drop () in the air cavity.
Category I Type A B C D (kPa) 4.70 4.90 8.50 12.50 Category II Type E F G H (kPa) 1.75 1.80 1.85 2.20
Another finding is the change in the air-cavity shapes. Seemingly, the much lower pressure in Types C and D encumbers the streamwise extension of the cavity. The jet is suppressed downwards, and its downstream edge exhibits almost a straight line.The pressure difference across the jet has obviously a bearing on the jet trajectory. In contrast to the free-falling jet with a parabola profile, the cross-jet pressure difference causes a deviation of the trajectory [10]. This is consistent with the observations made by Zheng et al. [49], in which the scale-model and prototype results are compared and the effect of pressure differences across the jet is discussed. A larger cross-jet difference gives a shorter trajectory.
A particularity here is the air-pressure variation in the aerator duct. Fig. 11 presents the time-average value ofalong the duct's centroid. For both categories,exhibits first an increase from the wall and then a decrease towards the center. The differences between the types are larger in Category I than in Category II – the curves of the latter are much closer to each other. In Category I,≈ 750–1100 Pa at the sidewall and between 0‒600 Pa at the centerline, with= 1500 Pa. For Type A, the pressure drop in the middle is limited. In Category II,≈ 1100 Pa at the wall and approximately 600 Pa at the center for all the types, with= 1200 Pa. The duct air velocity descends towards the center; the pressure variation results from the head losses and kinetic energy recovery of the air flow.
At Foz do Areia dam, its field measurements of the aerator flows are cited as comparison [9, 22, 23]. The facility is a 160-m concrete-faced rock-fill dam with a B = 70.6 m spillway chute. To prevent cavitation, three almost identical aerators are installed along the 400-m chute. The aerator is simply an offset with deflector, without any vents. During the tests, the air shafts are all open to the atmosphere; the cavity air pressure along the offset is registered. At Qw= 1470 m3/s, theresult along the offset is plotted in Fig. 12.
5.2 Air-flow rate
The amount of air entrained via the water jet's lower boundary depends upon the flow conditions and the geometry of the air-supply system including the air vents. Its interdependence with the vent layouts is illustrated with an air-entrainment coefficient,(%), defined as the ratio of Qato Qw, where Qa(m3/s) is the total air-flow rate (time-average value). The Qaandresults are summarized in Table 3.
Via the air shaft, the duct and the cavity, the supplied air is destined for the water jet. For a given shaft, the vents introduce additional throttling losses to the air flow between the duct and the cavity. Thus, thevalue represents, for a vent layout in question, a lumped cross-flow effect. In Category I, Types A and B lead to almost the same result. For Type D, the throttling effect is obviously augmented owing to the narrower vent close to the wall. This inhibits the air flow and results in a lowestvalue. In Category II, Types E, F and G give rise to comparable results; a highestvalue for Type H is ascribable to the re-arrangement of the vents with a large rectangular vent in the middle. Between Types H and D, the Qaandvalues differ by 35.6 m3/s and 5%,respectively, which is significant. In comparison with Category I,Type H generates improved cavity pressure conditions and at the same time enhances the air supply capacity.
5.3 Vent air-flow distribution
Between the duct and the cavity, the pressure difference across a vent opening governs the cross-chute distribution of air flow. Let the dimensionless parameterdenote the ratio of the air-flow amount per unit chute width to qw(= 20.31 m2/s). Fig. 13 plots thedistributions along the air duct. In Category I, the vent is a single opening; thechanges are continuous. In Category II, the air vents are segregated openings;exhibits spikelike shapes.
Category I sees, for each type, a non-uniform distribution ofacross the chute. More air is admitted into the cavity close to the wall, while the air amount in the middle part is limited. Even some flow reversals, though negligible in amount, occur at y/(0.5B) = 0.20–0.30 for Types A and B, which is also evidenced in Fig. 9a and 9b. From Type A to D, the amount of air admitted in the middle increases progressively, tending to even out the difference between the central chute and the near-wall region.
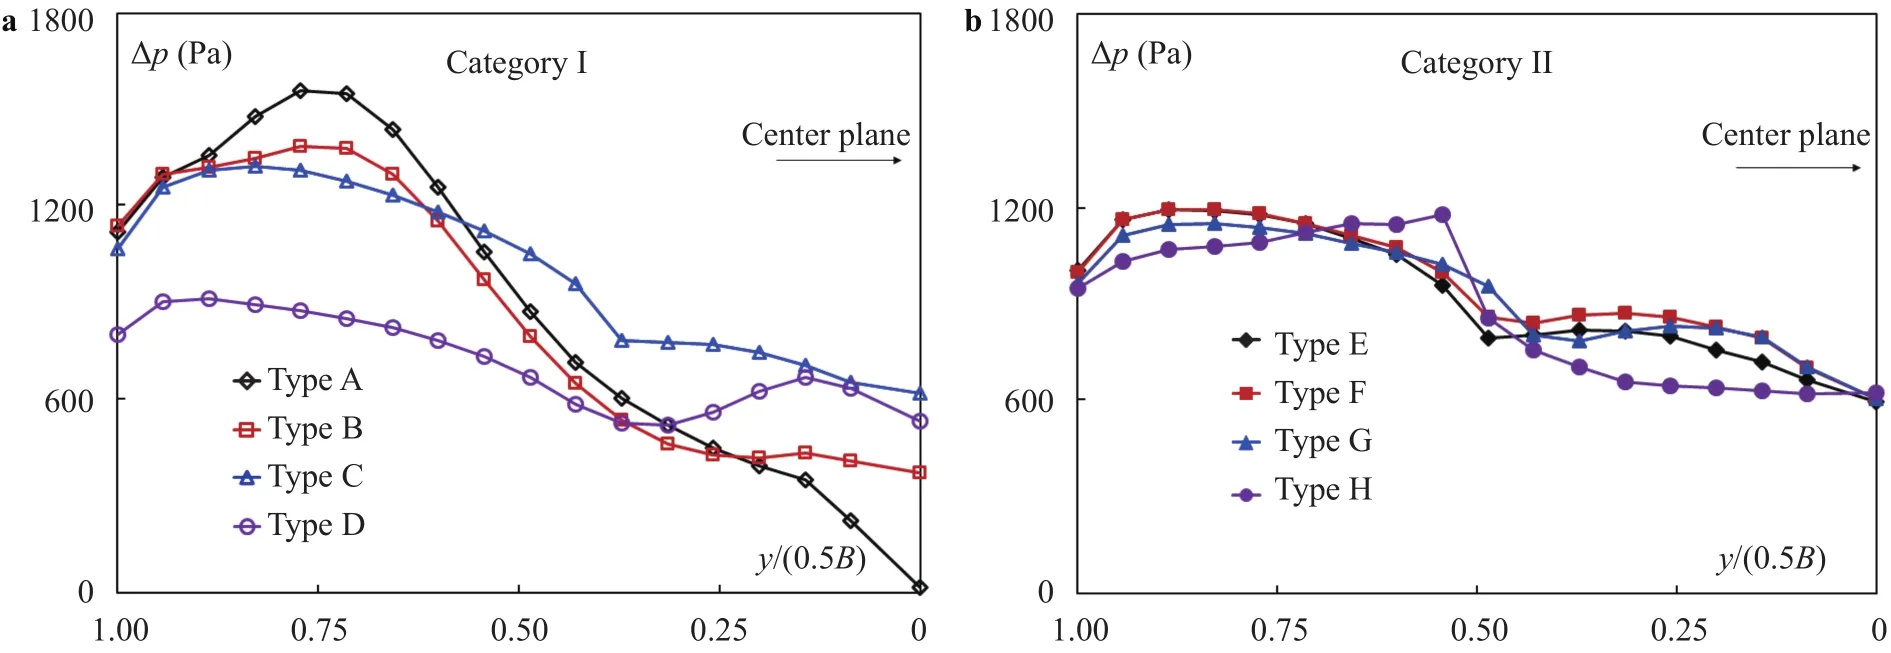
Fig. 11. Changes of (time-averaged value) along aerator groove: a Category I; b Category II.
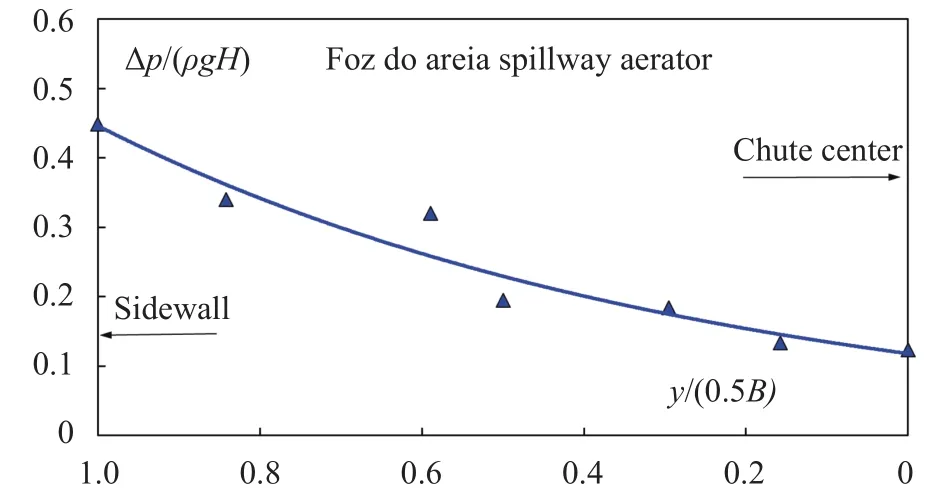
Fig. 12. Field measured variation across Foz do Areia aerator,Brazil.
Category II demonstrates somewhat evendistributions along the duct. The layouts exhibit similar patterns. Owing to the well-developed pressure conditions (Fig. 11b), the vent flows are accordingly improved. In contrast to Category I, the individual vents modify the air passage and introduce more reasonable throttling resistance to the flow. No flow reversal is observed.
5.4 Air-cavity and black-water length
The air-cavity length (L) is an essential proxy of the aerator flow. Measured parallel to the chute, it refers to the distance from the offset's upper edge where the flow detaches from the deflector to the flow reattachment position S in the impact area(i.e. the point where the base pressure is at its maximum). Figure 14 plots the L results for the vents, i.e. the change of L/H as a function of y/(0.5B). In Category I, Types A and B lead to nearly coinciding L values, while Types C and D show much shorter jet lengths. In Category II, Types E and F give almost identical results, while Types G and H point to also lower values. In contrast,Category II generates longer air cavities than Category I. For a given type, the length tends to be constant in the central part of the chute.
In Falvey [1], Pointo [23], and Bhosekar et al. [21], the common approaches for prediction ofare summarized. The formulas are based on estimations of the head loss (coefficient), L andin the cavity. No limiting conditions are given concerning the chute width. Our simulations show that, for a wide aerator with air vents, the L values are not constant across the chute;the differences are large. As described above, thedistribution in the cavity exhibits also a complex pattern, without any trend to follow for definition of a monomial function for.This means that it is unrealistic to estimate the air flow rate using the existing formulas. Instead, numerical modelling should be made.
The black-water extent within the jet is also a parameter mirroring the effects of the vent layouts. As in other studies, by black water we mean the pure-water body not penetrated by entrained air. In the flow direction, the sleek black-water body above the cavity tapers down to a point where the entrained air bubbles from both sides of the jet meet. To be numerically measurable, the isoline of C = 0.10 is used to mark its length Lb(accounted also from the offset's upper edge and parallel to the chute). Figure 15 shows, across the chute, the Lbchanges for each vent layout.
As well as L, Lbalso reflects the feedback between the water flow and the negative cavity pressure, which is in turn depend-ent upon the air-vent layouts. Lbexhibits the same tendency as L(except for the near-wall region). The blackwater reaches also longer in Category II. It should be noted that neither L nor Lbis constant across the chute; the difference is significant across the water jet.
Table 3 Summary of Qa and results for the air-vent layouts.

Table 3 Summary of Qa and results for the air-vent layouts.
Category I Type A B C D Qa (m3/s) 235.4 236.8 214.4 203.4(%) 33.1 33.3 30.1 28.6 Category II Type E F G H Qa (m3/s) 219.6 220.3 214.7 239.0(%) 30.8 30.9 30.2 33.6

Fig. 13. Cross-chute distributions of: a Category I; b Category II.
5.5 Air concentration distribution
Along the jet's lower boundary with black water above, the cross-jet C distributions (perpendicular to the chute base) further unveil the differences between the vent layouts. For a given layout, the thickness of the entrained air increases in the flow direction. The results show that, among the layouts, the C values are not uniform from point to pint across the chute. Between positions z90and z10, Fig. 16 exemplifies the distributions at the chute center and x/H = 2.00. z90and z10refer to the z values at C =0.90 and 0.10 of the lower jet surface, respectively. The vertical axis Z = (z – z90)/H. For this point, larger differences are seen in Category I.

Fig. 14. Air-cavity length (L) across the chute: a Category I; b Category II.

Fig. 15. Black-water length (Lb) across the chute: a Category I; b Category II.
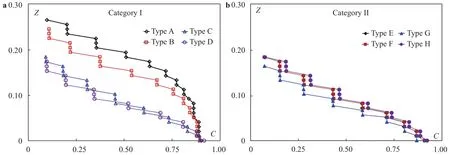
Fig. 16. C distributions perpendicular to the chute base at chute center and x/H = 2.00
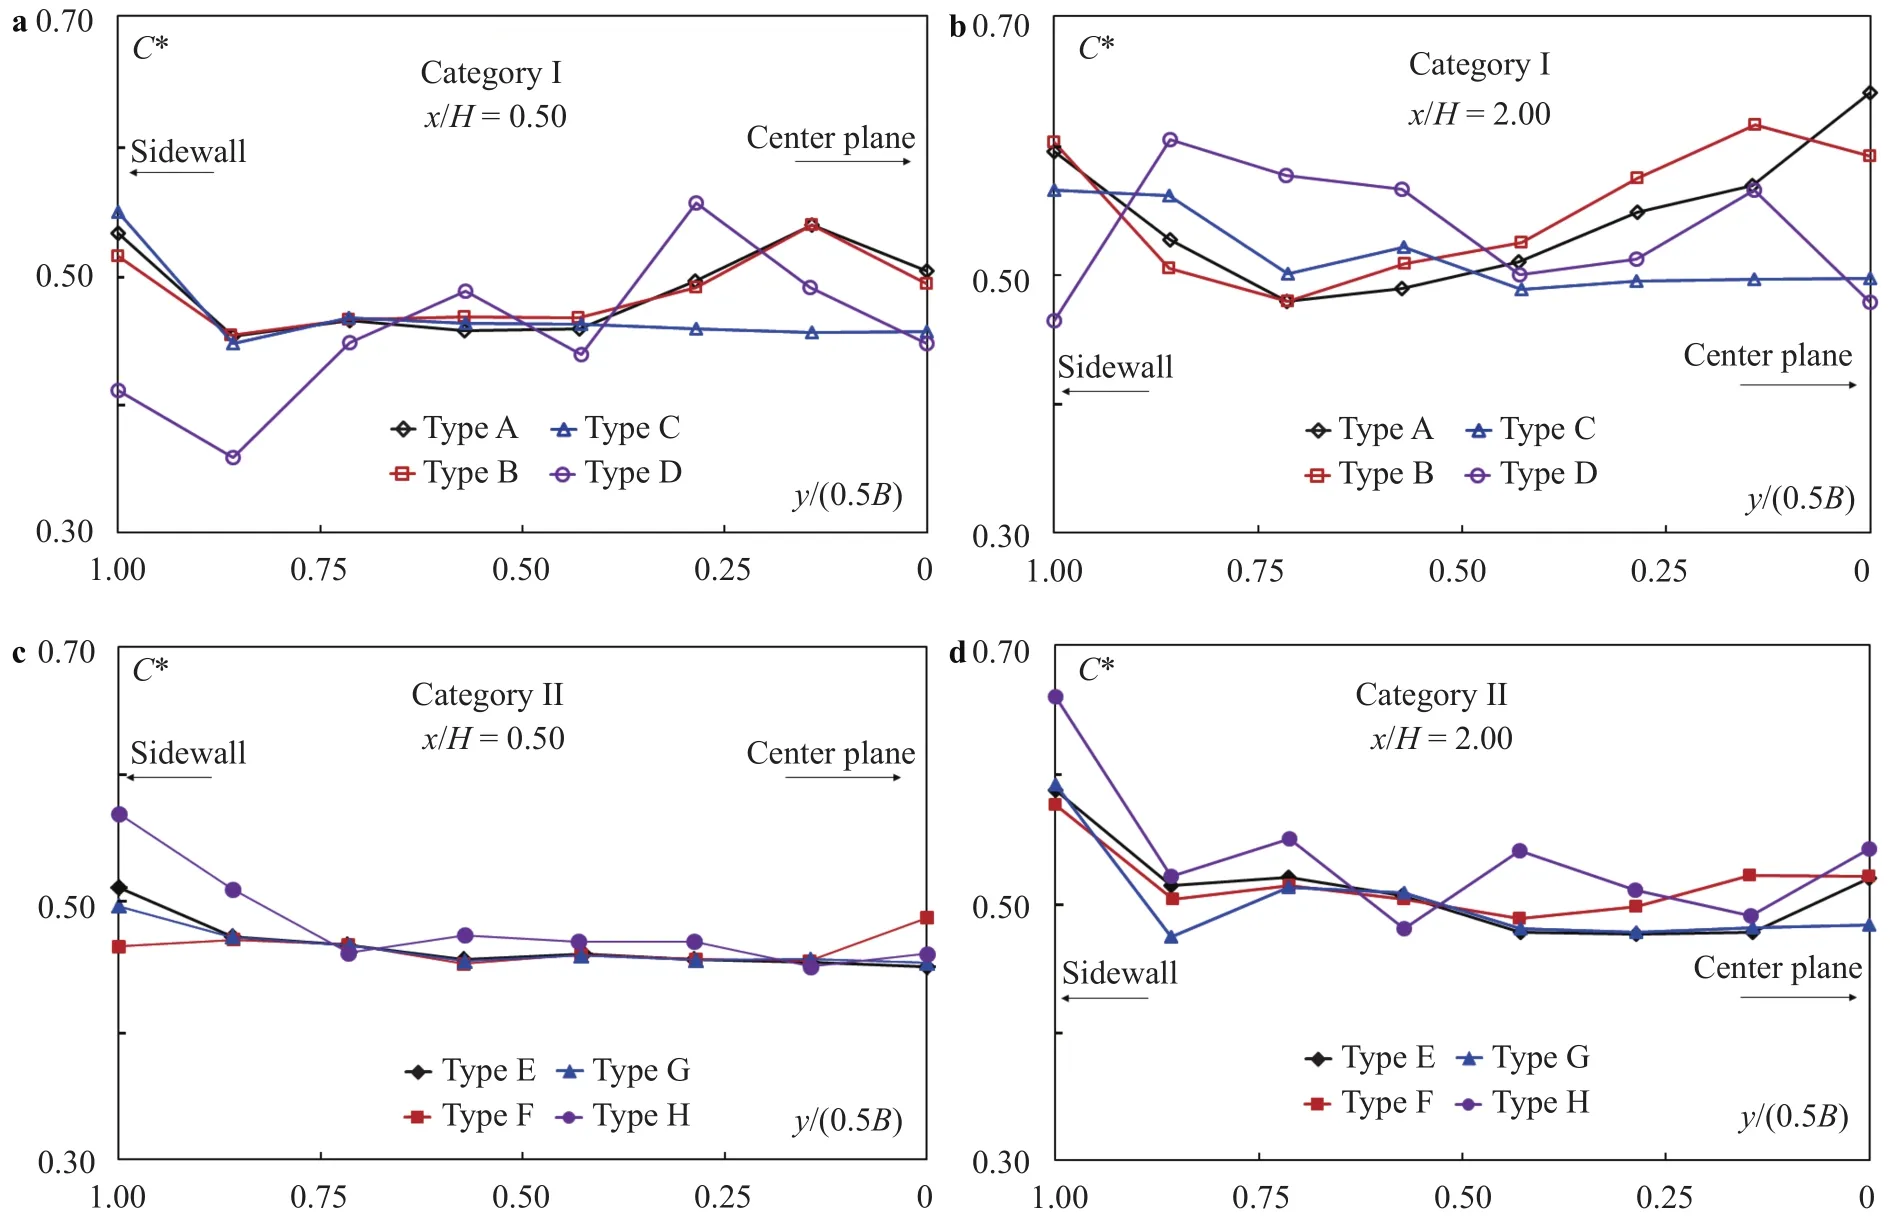
Fig. 17. Cross-chute distributions of C* along water jet's lower surface: a Category I, x/H = 0.50; b Category I, x/H = 2.00; c Category II, x/H =0.50; d Category II, x/H = 2.00.
For the jet's lower boundary, its space-averaged air concentration, denoted as C*, is another measure of the air-vent effects.It is acquired from the integration over the flow depth along the z-axis between z90and z10[7, 8]. For two streamwise locations,i.e. x/H = 0.50 and 2.00, Fig. 17 plots, for both categories, the C*variations across the jets.
The augment of air entrainment thickness in the flow direction leads to higher C* values at x/H = 2.00 than at x/H = 0.50.The coupling between the jet and the cavity affects not only the total amount (Qa) but also space distribution of the entrained air in the water flow, which is typically marked by the C* variations.As the jet position (in the z-direction) varies among the types, it is not straightforward to directly compare C values. The differences in C* among the types in Category I are larger than among those in Category II, especially in the middle part of the chute.The Category-II types behave in a comparable manner, with minor differences in between. The cross-chute changes are almost invariable. For both categories (excluding Type D), the near-wall C* values are higher than a few meters away from the wall, which is presumably due to the wall boundary effect.
6 Concluding remarks
Based on the 35 m wide chute aerator, eight configurations of air vents are devised. CFD modelling in 3D is performed to discuss their similarities as well as differences in performance. The reciprocity of the vents with the flow is demonstrated with such parameters as air-flow rate, cavity parameters as air pressure and length.
An aerator with a width below 10−15 m often possesses merely an offset across the flow. A wide aerator of only an offset would inhibit the air-pressure penetration towards the center,leading to a non-uniform distribution of the vent flow across the chute. To counteract this, the vent area should be gradually augmented towards the middle, so that more air is provided to the middle part. The study shows that the large aerator width affects the aerated flow, exhibiting significant differences between the near-wall region and the central part of the chute.
The aerator flow is sometimes compared to a pumping system. On one hand, it is the water flow that drives the air movement; one the other hand, the air flow is highly responsive to the water jet. The introduction of air vents modulates the air-flow conditions, which in turn affects the interplay between the jet and the cavity air. Once a vent layout is modified, the cavity pressure is re-distributed. The vent layout plays an appreciable role in the coupled water-air system. As compared to a single-vent layout (Category I), the practice of segregated vents (Category II)contributes to the improvements in the aerator behaviors.
It is not the primary aim of the study trying to find an optimum vent layout. This is due to two reasons. First, it is not obvious to define what is the optimum flow condition at the aerator.Second, even a definition is given, the condition varies with the water-flow discharge. Instead, the study aims to demonstrate, in a wide chute, the manner of laying out air vents and their effects on the aerator characteristics. Bearing in mind the differences illustrated in the study, one should consider the design with air vents for a wide aerator. It is also advisable to check that the aerator operates satisfactorily not only at one flow discharge but within the selected range of discharges.
Acknowledgments
The study is part of research project “Hydraulic design of spillway aerators”, funded in part by Swedish Hydropower Centre (SVC). Together with Royal Institute of Technology(KTH), Luleå University of Technology (LTU), Chalmers University of Technology (CTH) and Uppsala University (UU), SVC is established by Swedish Energy Agency, Energiforsk and Swedish National Grid. Other funding sources from Vattenfall R&D, Fortum Generation and Uniper/Sweco have indirectly facilitated the study.
James Yang is grateful to Prof. Anders Ansell, Dr. Richard Malm and Prof. Erik Nordström (KTH Division of Concrete Structures), Ms. Charlotta Winge (KTH School of Architecture and the Built Environment), Ms. Marita Karlsson (Vattenfall R&D) and Ms. Emma Hagner (SVC) for kind help and assistance with diverse issues and to Mr. Qiancheng (Kevin) Xie (LTU Fluid and Experimental Mechanics) for devoted cross-check of the manuscript.
杂志排行
Theoretical & Applied Mechanics Letters的其它文章
- Particle selectivity of filtering by C. elegans
- The extractable hydrokinetic power from an oscillating membrane-based harvester
- Impact of spray droplets on momentum and heat transport in a turbulent marine atmospheric boundary layer
- A new numerical framework for large-eddy simulation of waves generated by objects piercing water surface
- Numerical solutions for point masses sliding over analytical surfaces: Part 1
- Numerical solutions for point masses sliding over analytical surfaces: Part 2
