Impact of spray droplets on momentum and heat transport in a turbulent marine atmospheric boundary layer
2019-05-28MingPnCixiLiuQingxingLiShuiTngLinShenYuhongDong
Ming Pn, Cixi Liu, Qingxing Li, Shui Tng, Lin Shen, Yuhong Dong,b,*
a Shanghai Institute of Applied Mathematics and Mechanics, Shanghai University, Shanghai 200072, China
b Shanghai Key Laboratory of Mechanics in Energy and Environment Engineering, Shanghai 200072, China
c Department of Mechanical Engineering, and St. Anthony Falls Laboratory, University of Minnesota, Minneapolis, MN 55414, USA
Keywords:Direct numerical simulation Air–sea interface Sea spray Turbulent airflow
A B S T R A C T Droplet-laden turbulent airflow (i.e. the mixture of dry air and water vapor) in the marine atmospheric boundary layer is described by an open channel flow configuration in direct numerical simulation (DNS). The dispersed phase, the spray droplets are tracked in a Lagrangian framework, and their impact on the carrier airflow is modeled with the two-way coupling between the two phases. A wide-range droplet size is typically found near the air–sea interface according to the sea spray concentration function (SSCF). The interactions of the droplets with turbulent airflow including mass, momentum, and energy exchange are investigated here. We found a balancing mechanism exists in the droplet effects on the turbulent drag coefficient, since spray droplets lead to a decreased vertical turbulent momentum transport, but also lead to an increased droplet contribution to total drag coefficient. For the heat transfer, as droplet mass loading increasing, the total Nusselt number decreases due to the depression of turbulent heat flux and enhanced negative droplet convective flux.
Sea spray transported and dispersed in the marine atmospheric boundary layer (MABL) is a complex process [1-3]. Many researchers make a consensus that spray droplets have a significant impact on dynamics and thermodynamics of airflow. Understanding the momentum, heat and humidity exchange process and its influence mechanism is the core problem of the study of air–sea interaction [4-7].
Recent studies have shown that the drag coefficient does not always increase as the wind speed increases, but have a reduction for wind speed exceeding hurricane values of 30–40 m/s [8,9]. There are currently two different explanations. Makin [10]considered that at very high wind speeds, spray droplets originating from actively breaking waves form a deep suspension layer which can prevent momentum transfer from airflow to the sea surface. While, Andreas [5] argued that momentum flux induced by spray droplets is responsible for the reduction of the drag coefficient. Bye and Jenkins [11] numerically reproduce the observed saturation of the drag coefficient in high winds. On the other hand, the presence of spray droplets can modify the temperature and humidity profiles in the MABL. Meirink and Makin[12] investigated the effect of sea spray evaporation to the atmosphere, they found a substantial cooling and moistening due to the increase in latent and the decrease in sensible heat flux. Anthes [13] pointed out spray evaporation lead to the cooling of the air-sea interface atmosphere, then results in sensible heat flux increased. Cheng et al. [14] numerically examined effects of sea spray evaporation on heat transfer, they found that sea spray evaporation increases the interfacial sensible heat flux, but has little effect on the interfacial latent heat flux. Meanwhile, they indicated that the effect of spray droplets on the near-surface temperature and humidity depends on droplets amounts and their locations.
The above mentioned parameterizing method cannot directly compute the momentum heat and mass coupling between two phases [15]. Recently, to overcome the limitation, some research groups have tried to model these processes by direct numerical simulation (DNS) coupled with Lagrangian tracking method. Russo et al. [16] adopted an Euler–Lagrangian approach with a complete two-way coupling to investigate the condensation and evaporation of water droplets in an incompressible turbulent channel flow. They observed an equilibrium state can be reached in the total channel when the condensation or evaporation of water droplets are considered in simulation, and the Nusselt number is increased by the condensation or evaporation of water droplets. Later, Bukhvostova et al. [17] further investigated the importance of compressibility in turbulent droplet-laden heated channel flow with phase transition and the influence of the relative humidity. In addition, Helgans and Richter [18] investigated the effect of evaporating saline droplets on enthalpy fluxes in turbulent Couette flow with different temperature and humidity boundary conditions by DNS with a complete two-coupling of momentum, heat, and mass transfer.
However, the underlying mechanism that governs the air–sea interaction process is still unknown, especially how the MABL dynamics and thermodynamics modulated by evaporating spray? Therefore, the present study aims to fill this gap by investigating the influence of sea spray droplets with phase transition on the momentum and heat transport of the air–sea interface. We focus on how the droplets change the flow drag and heat transfer. To the best of our knowledge, this is the first numerical simulation to establish spray droplets that have a wide range of sizes dispersed in the MABL.
In this study, the airflow is computed using direct numerical simulation for an incompressible flow and a Lagrangian particle tracking based on a point-force approximation is used to examine the motion of sea spray droplets. The two-way coupling of momentum, heat, and mass transfer between sea spray droplets and airflow are taken into account. An Eulerian–Lagrangian hybrid formulation is developed to predict and analyze the impact of different mass loadings spray droplets on the boundary layer dynamics and thermodynamics.
Because the Mach number is much smaller than one. The mixed airflow can be assumed to be as an incompressible and Newtonian fluid [16]. This means that the gas mass density is constant,, in whichis the gas density of mixed airflow,is the density of air, andis the density of water vapor. In the present study, the concentration of water vapor is much smaller than air and the temperature of airflow is small.Therefore, the humidity and temperature dependent thermodynamic properties of airflow can be seen as constant (such as specific heat capacity, kinematic viscosity) in accordance with the standard Boussinesq assumption. In addition, the water vapor is also treated in an Eulerian way, and the rate of change of the vapor mass density is governed by flow transport and mass exchange between two phases by evaporation and condensation.The governing equations for the gas mixed with water vapor, the Navier–Stokes equation, a convection-diffusion equation for gas temperature and water vapor humidity can be written in dimensionless form as


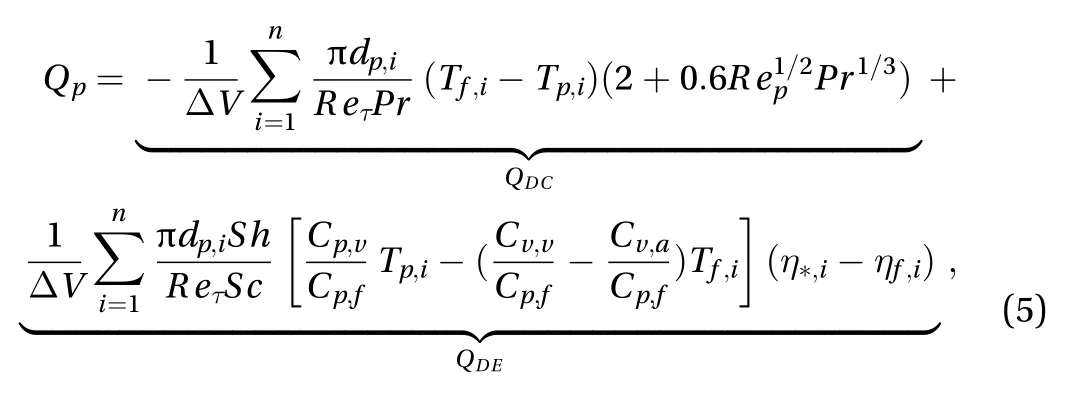
The dispersed phase consists of droplets, which considered in a Lagrangian way. In the current study, the density ratio of the dispersed phase to the carrier phase is large enough, and the particle diameter is smaller than the Kolmogorov length scale.Thus, the most important force acting on the particle is the drag force exerted by the fluid [19]. The governing equations for the location and velocity of each particle can be written as
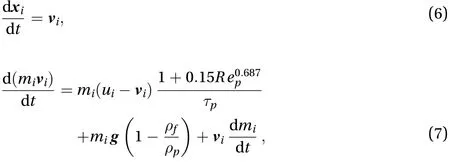

where the Sherwood number is given by,andare the specific humidity in the surrounding of the droplet and at the surface of the droplet,respectively. The expression of specific humidity adjacent to the droplet surface is given by


To model heat transfer, the radiative contribution is neglected and it is assumed that the temperature of a particle is uniform. The convective heat and mass transfer to and from the airflow should be taken into account. Therefore, the equation of droplet temperature can be written as

In the present simulation, the model of geometry is horizontal open-channel flow. Direct numerical simulation is performed to investigate the impact of droplets on turbulence at.To perform the present calculation, a finite-difference method developed is used to solve the governing equations on a nonuniform staggered orthogonal grid. Spatial derivatives are discretized by a second-order central difference. Time advancement is carried out by the semi-implicit scheme using the Crank–Nicolson scheme for viscous terms and the three-stage Runge–Kutta scheme for the non-linear terms and the feedback terms. The discretized formulation was described in detail by Dong and Lu [22].
A 3D representation of the physical model is plotted in Fig. 1.The size of the computational domain iswith the corresponding grid numberin the streamwise(x), spanwise (y), and vertical directions (z), respectively. In the vertical direction, the mesh is stretched to increase the grid resolution near the free surface and bottom wall, so that the grid distribution is sufficient to resolve the viscous sublayer and diffusive sublayer near the boundaries. Periodic boundary conditions are applied in the periodic streamwise and spanwise direction, and no-slip and slip conditions are imposed on bottom and top surface, respectively. Two different constant air temperatures and moistures are imposed on the bottom and the top boundaries. The initial temperature presented a linear distribution in the wall-normal direction. For the initial condition of moisture, the air–vapor mixture is assumed as under the saturation condition all over channel. Therefore, the initial specific humidity can be calculated by the function of the corresponding saturated specific humidity at a specific temperature. The numerical validation of our scheme is provided in Dong and Lu[22].
In this study, our goal is to investigate the influence of droplets with a wide range sizes on turbulence. The dispersed phase is composed with different diameter droplets. The sea spray concentration function (SSCF) is used to produce the numbers of different initial droplet diameters. SSCF gives the number of droplets of radiusdispersed per cubic meter of air(m–3·μm–1). Lewis and Schwartz [23] presented nine different ways to evaluate the SSCF according to concentration data of experimental measurement and provided a canonical concentration function for low-moderate wind speed. Later, Jones and Andreas [24] extended the concentration function to higher wind speed case. Sea spray concentration function is obtained as follows

For the dispersed phase, after the flow reaches a statistically stationary state of fully developed turbulence, the multi-component droplets withkg/m3are injected into airflow at random positions and distributed over the entire computational channel. The radius of the majority of the droplets is smaller than 100 μm. In our simulation, the different sizes droplets are segregated into 50 classes with different initial radius range from about 10–100 μm. The total number of droplets () in multicomponent droplet system can be calculated by, B is the coefficient and set to 1000, andis the computational domain of open channel flow.is the radius difference of two adjacent classes.is sea spray concentration function, andrepresents the droplet radius of i-th radius class. In this study, to mimic the different environmental conditions in the atmosphere boundary layer, we designed four sets of simulations(see Table 1) by increased droplet mass loading. Figure 2 shows the profile of SSCF of four runs.
Lagrangian particle tracking is used to obtain the position,diameter, velocity, and temperature of droplets. The governing equations of the droplets are advanced in time by a second-order Adams–Bashforth method. Fourth-order lagrangian polynomial was applied to interpolate the fluid velocity, temperature,and humidity at particle position. At the beginning of the simulation, droplet velocity and temperature are set equal to those of the fluid at the droplet initial position. Periodic boundary conditions are used to reintroduce droplet into the computational domain when droplet moves outside the channel in horizontal dir-ections, whereas a new droplet will be injected at the stochastic position in channel when a droplet falls into the wall. In this study, droplet collision is not taken into account [25] but twoway coupling (such as momentum, thermal, and mass coupling)is investigated.
Table 1 Definition of the four runs. The droplet mass loading is denoted by.
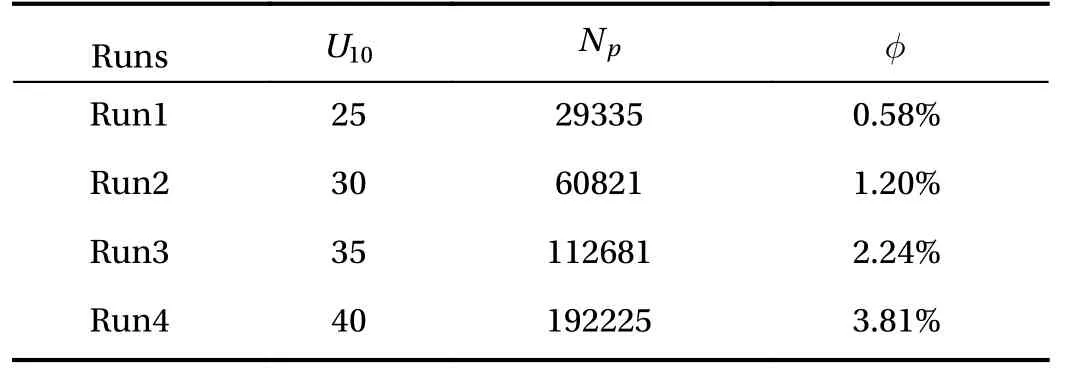
Table 1 Definition of the four runs. The droplet mass loading is denoted by.
?
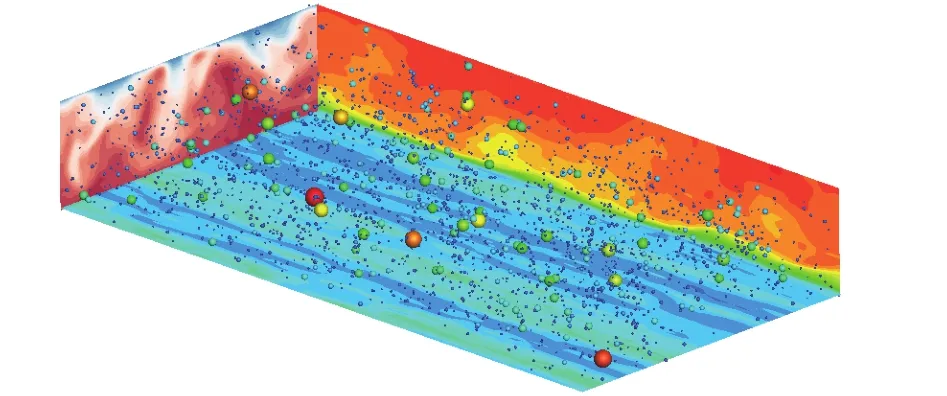
Fig. 1. Schematic of the physical domain: the colour scheme of the different sizes droplets indicates the droplet temperature, where dark blue is the coldest and red is the hottest.
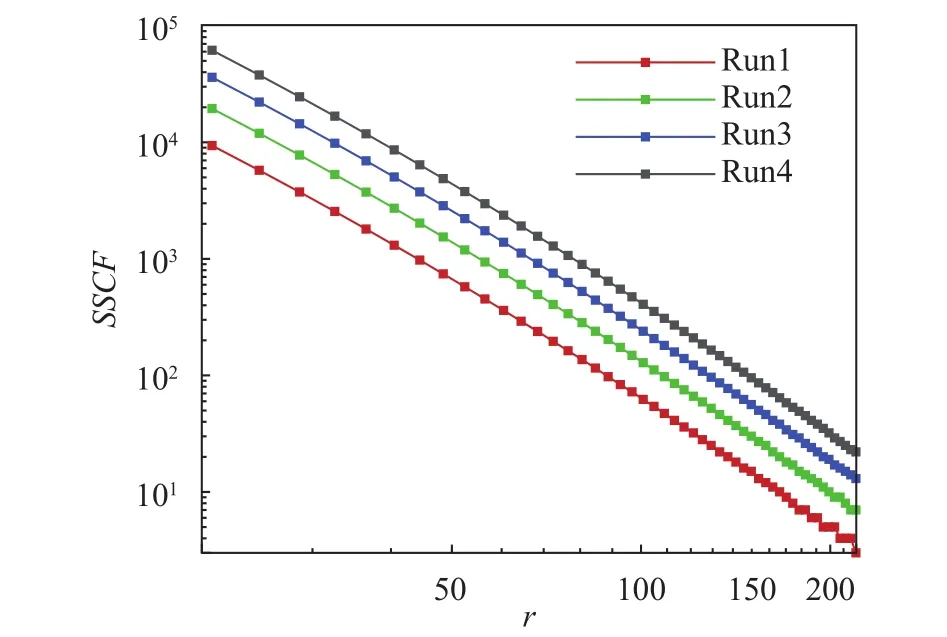
Fig. 2. Sea spray concentration functions for 4 runs.
The simulation results of a set of numerical experiments will be presented and analyzed. Although the evaporation and condensation of droplets is considered, the change of droplet diameter is very small, especially under low volume fraction condition. This is due to their relatively long evaporation time scale that is three orders of magnitude greater than residence time scale [26]. With the evolution of time, the rate of mass exchange between phases and the distribution of droplet in turbulence reach a steady state, in which temperature and the water vapor content only fluctuates in time. In the analysis presented in all runs, we make uses of quantities averaged over the two homogeneous directions for carrier gas, and for the dispersed phase we use 128 equal-sized bins in the vertical direction and average over all the spray drops contained in a certain bin at a certain time. The temporal averaging is performed in an enough long time range for considering the statistically steady state.
The droplet volume concentration observed at each vertical bin is calculated using

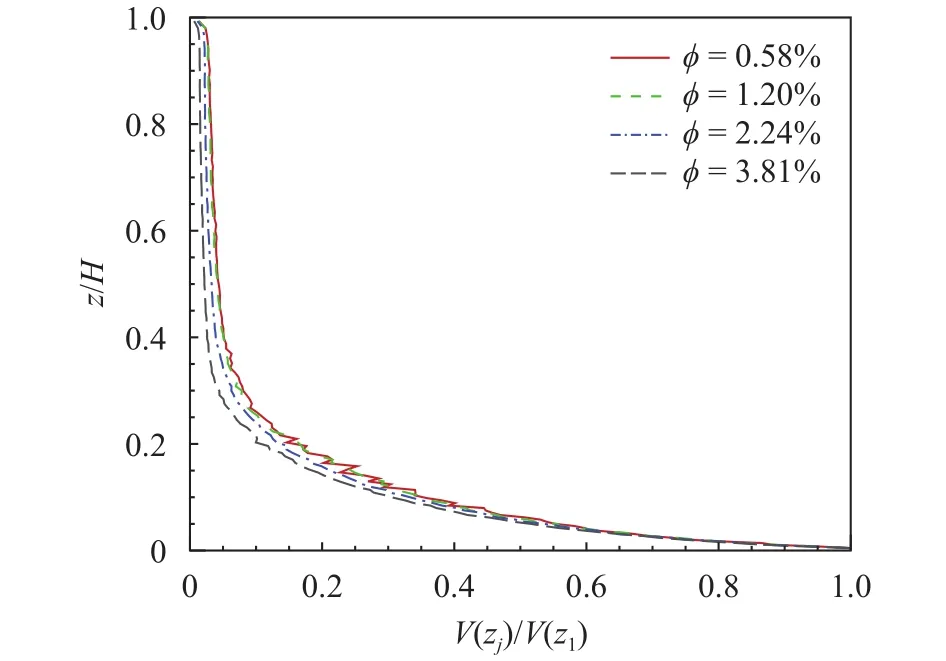
Fig. 3. Normalized mean vertical concentration profiles.
In the MABL, the momentum exchange is described by the total drag coefficient (), the formula of total drag coefficients for droplet-laden open-channel flow can be given as [29-31]
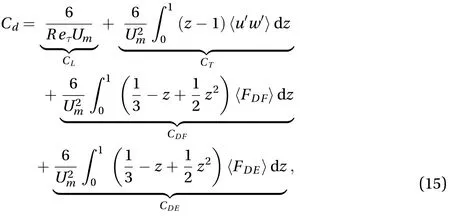
where the first, second, third, and fourth terms on right-hand side of Eq. (15) are the viscous contribution, the turbulent contribution, the droplets force feedback contributionand the droplets evaporation feedback contributionto drag coefficients. In Eq. (15), the dimensionless bulk mean velocityis generally defined based on the total mass flow rate as
Table 2 shows the different behaviors of drag coefficient in droplet-laden flow with different droplet mass loadings. The most striking result is Run1–3 has almost the same value of the total drag coefficient, and only has an obvious increase in Run4.In all contribution terms,contributes a significant part, butcan be negligible relative to other drag coefficient. Therefore, the variation of total drag coefficient is achieved by combining effect of the,, and. Next, we analyze the reason of the change of each drag coefficient.
From Eq. (15), we found a negative correlation between the viscous drag coefficientand the bulk mean velocity.As seen in Fig. 4, with the presence of spray droplet at higher mass loading, the mean airflow velocity is increased a little, correspondingly contributions arising fromhas a very slightly decrease. For the turbulent drag coefficient, its change mainly reflects on the modulation of turbulent velocity field. Figure 4 plots the intensities of the streamwise velocity fluctuation and the vertical velocity fluctuation are suppressed with increasing mass loading. Therefore, it would make turbulence entrainment effect weaken, this is one of the main reasons why spray droplets distribution get a slightly close to the sea surface. Also,as shown in Fig. 4, Reynolds stress across the boundary height decrease monotonically with increasing mass loading, soreduced from 5.83 to 3.83 in Table 2.
For the droplet force feedback drag coefficient, it is mainly related to the streamwise droplet force feedback termand the bulk mean velocity. Theincreases with the increase of droplet mass loading which can be contributed arising from the increase of thein Fig. 5. In addition, it can be found that the force feedback of the droplets to turbulence is positive near the wall and is negative outside the near-wall region. This is related to the trajectory of the droplet motion. After the droplets are ejected from the sea surface, they moving from bottom to upward and get some momentum from high wind.But under the effect of gravity, droplets eventually getting closely to the surface, they enter in the low velocity region and then lose momentum to the airflow in the horizontal direction. Also, with increasing droplet mass loading, the growth of negative feedback force is greater than growth of positive feedback force.Therefore,rises from 0.59 to 3.63. Overall, total drag coefficient is identical in Run1–3 by the balance of turbulent drag coefficientand droplet force feedback drag coefficient, but increases due to a large enhancement of.
The effect of evaporating droplets on sensible heat transfer is also investigated. Heat transfer is quantified by the Nusselt number. The formula of Nusselt number for droplet-laden openchannel flow can be given as [30, 32]
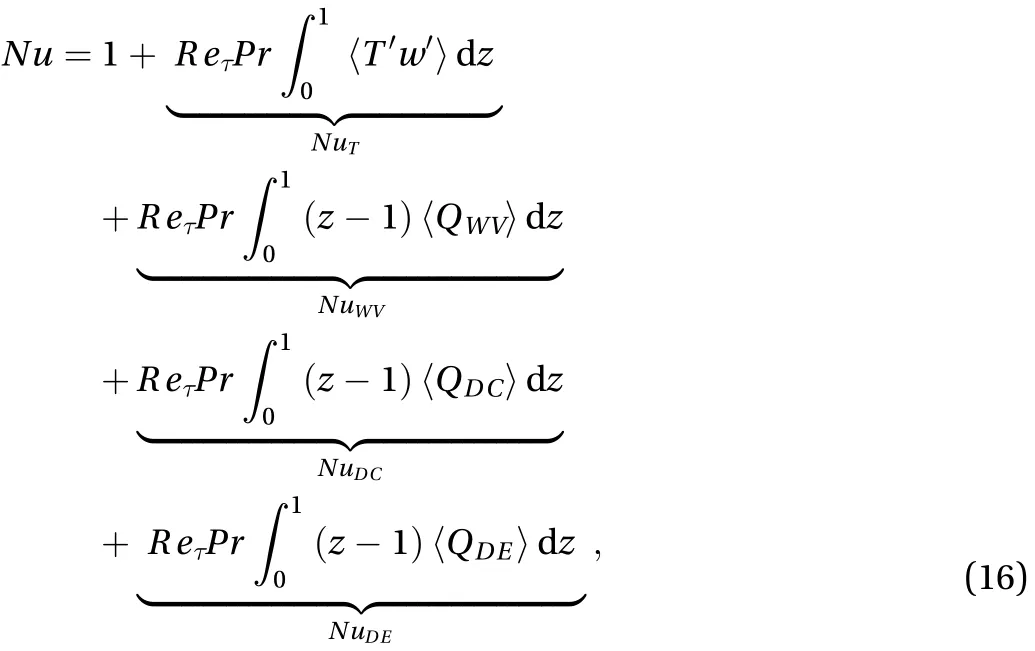
where the terms on right-hand side of Eq. (16) are the laminar contribution, the turbulent contribution, the contribution of water vapor, the droplets convective thermal feedback contribution, and the Dropletevaporation thermal feedback contribution,respectively.
Table 3 shows the different behaviors of Nusselt number in droplet-laden flow with different droplet mass loadings. A significant reduction in Nusselt number has been found in higher mass loadings. It can be found that the contribution arising from turbulent transport is most important relative to other contributions,is the laminar open channel flow without droplets. It can be also found that the droplet-evaporation thermal feedback Nusselt number can be negligible due to the small rate of droplet evaporation. Figure 6 shows the water vapor mass fraction and RMS of the water vapor have no significant change for 4 runs, it results in little influence on the water va-por Nusselt number for different droplet mass loadings. So the major influence onare the turbulent Nusselt number and the droplet convective thermal feedback Nusselt number, which will be analysed in detail.
Table 2 Different contributions to the total drag coefficient for runs with different droplet mass loadings. All the terms have been multiplied by.

Table 2 Different contributions to the total drag coefficient for runs with different droplet mass loadings. All the terms have been multiplied by.
?
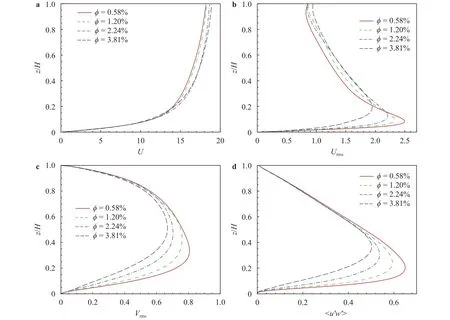
Fig. 4. Effect of droplet mass loading on flow statistics. a Mean streamwise velocity. b Root mean square (RMS) of steamwise velocity fluctuation. c RMS of vertical velocity fluctuation. d Reynolds stress. All variables are scaled by the friction velocity.
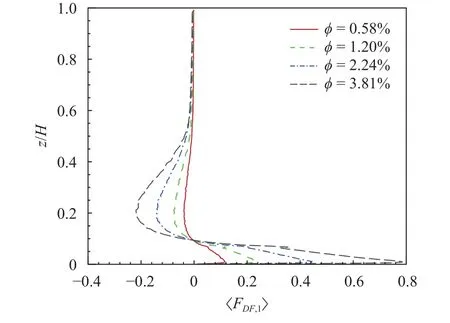
Fig. 5. Droplet feedback force in streamwise direction.

Table 3 Different contributions to the Nusselt number for runs with different droplet mass loadings.
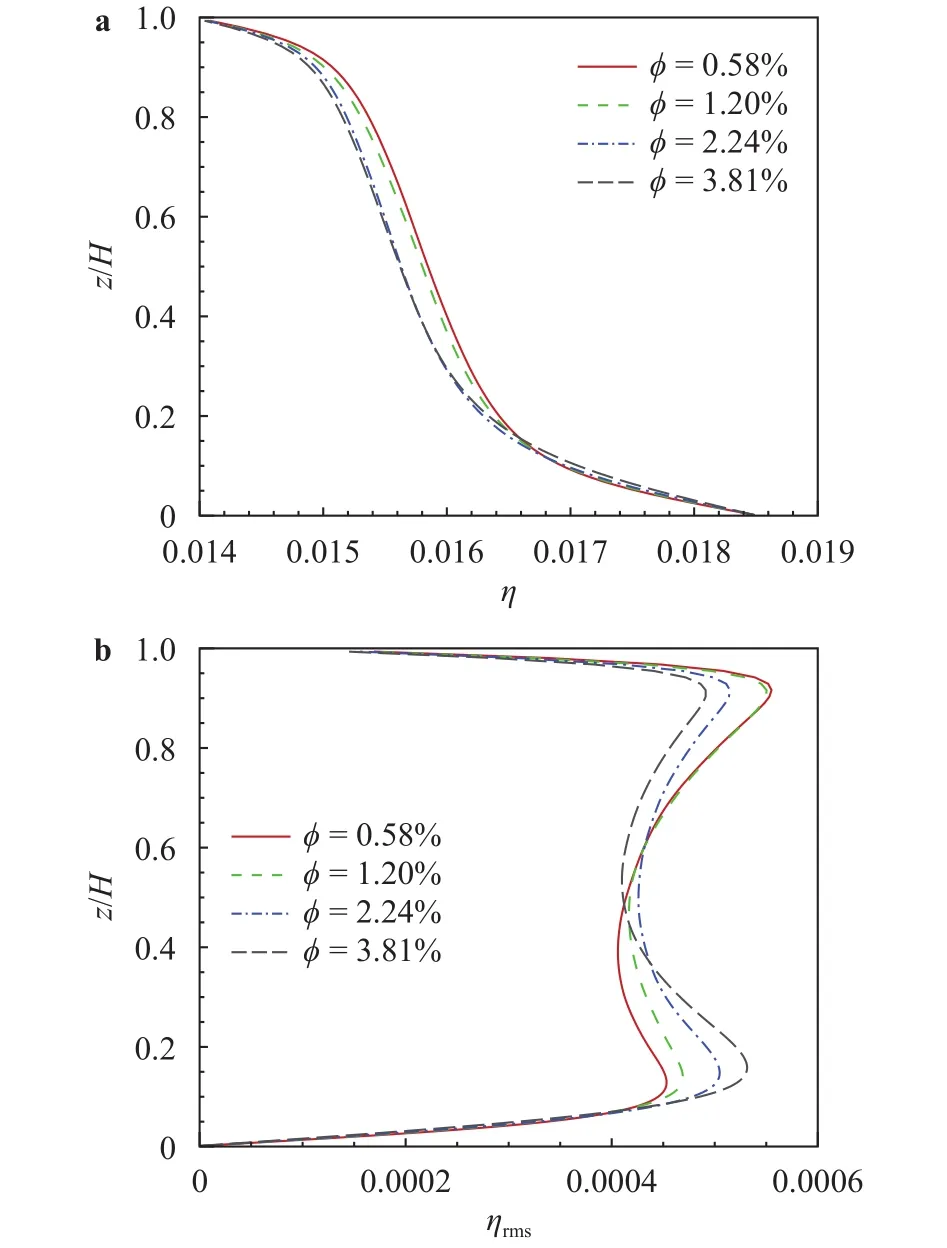
Fig. 6. a Mean vapor mass fraction and b RMS of vapor mass fraction.
We study the effects of sea droplets over a wide distribution of radius on flow drag and heat transfer in turbulent open-channel flow by DNS combined with Lagrangian point-particle tracking method. In this simulation, the momentum, heat, and mass exchange between the droplets and turbulence, namely a complete two-way coupling, are considered. We investigate the variation trend of the flow drag and Nusselt number of droplet-laden turbulent open-channel flow with the droplet mass loading.
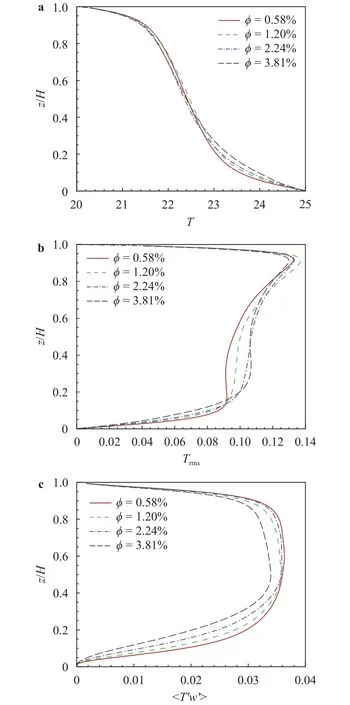
Fig. 7. a Mean temperature profile, b RMS of temperature, and c vertical turbulent heat flux.
In our simulation, the initial relative humidity of the air–vapor gas is equal to 100%. The vertical transport of momentum and heat are suppressed by the presence of spray droplets. Our results show that the total drag coefficient has no change with the increase of the droplet mass loading for Run1–3, but a significant increase in highest mass fraction (Run4). We found that there is a balance between the contributions from turbulent transport and droplets, except for Run4 (highest mass loading),since the reduction of contribution caused by turbulent diffu-sion is less than compensated by the droplets. While the efficiency of heat energy transfer significantly depends on the droplet mass loading. By the increment of droplet mass fraction,decreases due to heat transfer contributions from both turbulence and droplet are weakened.
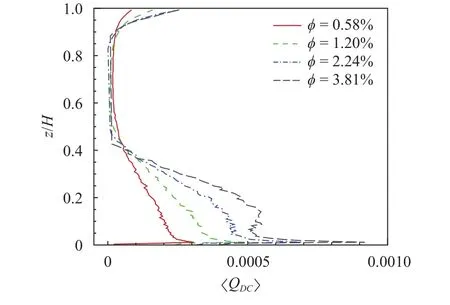
Fig. 8. Droplet convective thermal feedback term.
Acknowledgment
This work was supported by the National Natural Science Foundation of China (Grants 11572183 and 91852111), Program of Shanghai Municipal Education Commission (Grant 2019-01-07-00-09-E00018).
杂志排行
Theoretical & Applied Mechanics Letters的其它文章
- Particle selectivity of filtering by C. elegans
- The extractable hydrokinetic power from an oscillating membrane-based harvester
- A new numerical framework for large-eddy simulation of waves generated by objects piercing water surface
- Numerical solutions for point masses sliding over analytical surfaces: Part 1
- Numerical solutions for point masses sliding over analytical surfaces: Part 2
- Marangoni liquid film scattering over an extending cylinder
