Analysis of conflict factors between pedestrians and right-turning vehicles at signalized intersections
2019-04-04ChenYonghengLiuFanghongBaiQiaowenTaoChuqingQiXingzu
Chen Yongheng Liu Fanghong Bai Qiaowen Tao Chuqing Qi Xingzu
(College of Transportation, Jilin University, Changchun 130022, China)
Abstract:Due to the fact that there is no protected signal phase for right turns at most signalized intersections, the conflict between pedestrians and right-turning vehicles is one of the most common conflict types for pedestrians. A pedestrian safety analysis of the common right-turn mode at four-phase signalized intersections is presented. Relative risk is used as a measure of the effect of behaviors. The analysis mainly includes five pedestrian factors that affect the conflict process between pedestrians and right-turning vehicles. Pedestrians tend to have a higher risk of being involved in conflicts in the following six situations: crossing with others, running over the crossing, entering the intersection, being near the exit lane, crossing in the middle or at the end of a green light when the right-turn lane is shared, crossing at the beginning of a green light or red period when the right-turn lane is exclusive. It is easier for pedestrians to get priority when crossing the street in the following situations: running over a crossing, entering the intersection, being near the entrance lane, and not using the crosswalk. However, pedestrians are more inclined to yield to right-turning vehicles when pedestrians are crossing in the middle of the green light time. Some measures to alleviate the conflict are put forward according to the conclusion. Video observations also indicate that a clear pedestrian waiting area must be marked for both pedestrian safety and right-turning vehicle efficiency at major flat intersections, particularly when the arms cover the lateral dividing strips.
Key words:safety; conflicts; pedestrian behaviors; right-turning vehicles; relative risk
Signal control mitigates conflicts between traffic streams with different directions by separating the passage time. However, right turn on red (RTOR) is permitted in many countries, so right-turning vehicles can move in full time. Thus, the conflicts between pedestrians and right-turning vehicles are inevitable. Right-turning vehicles cannot always yield to pedestrians due to many factors. Sometimes, right-turning vehicles and pedestrians competed at the intersection, which increases the risk of pedestrians. In fact, right-turning vehicles are a key element in making pedestrians unsafe at signalized intersections. A study has revealed that the conflicts with RTOR are more serious than those with protected/permissive right-turn phasing (PPRT). Meanwhile, right-turning vehicles more likely yield to pedestrians at PPRT intersections[1]. Currently, normal non-channelized right-turn lanes with RTOR are widely used. Therefore, the study of safety involving pedestrians and normal non-channelized right-turning vehicles is necessary.
There are generally two methods for safety analysis. The first is the accident data analysis method[2-3]. The second is the conflict data analysis method[1,4]. Since the accident data cannot recreate the accident process well, the corresponding records are incomplete. The frequency of accidents is low, and the prevention of personal injury and property loss lags behind. Therefore, this method cannot meet the needs of research. Studies have indicated that conflicts and accidents have strong correlations[5-6]. Safety analysis using conflict data has the advantages of a shorter data cycle, a more complete record of the conflict process, advance prevention of accidents, and easier analysis. Therefore, this study uses conflict data instead of accident data to analyze traffic safety since it can be a good substitute for accidents.
There have been many studies on the factors that influence the conflict between pedestrians and vehicles. Some researchers analyzed flow factors[4,6]. Other researchers analyzed the influences of channel conditions and traffic facilities on the conflict[7-8]. Moreover, many researchers have studied pedestrian behaviors. Some researchers analyzed the factors that affect pedestrian behaviors[9-14]. All these studies are conducive to the understanding of the conflict process between pedestrians and vehicles. There are also some studies analyzing the influences of pedestrian behaviors on conflicts[15-16]. However, the influences of pedestrian behaviors on the conflict between pedestrians and right-turning vehicles under the RTOR mode still lacks in-depth research.
Through the survey, it is found that the process of conflict between pedestrians and right-turning vehicles may be affected by pedestrian factors such as pedestrian companion behavior, crossing speed, crossing position, crossing signal phase, and the direction of entering or exiting intersections. After analyzing the background of the study, this paper does not use the widely used odd-ratio method[17-18]. Conversely, this study measures the influences of factors by directly calculating relative risk. The influences of pedestrian factors in the process of conflict between pedestrians and right-turning vehicles under the RTOR mode is analyzed.
1 Conflicts between Pedestrians and Right-Turning Vehicles
When a pedestrian and a right-turning vehicle approach each other, a crash would be likely to occur if neither of them takes actions such as decelerating, running to avoid a vehicle, stopping short and swerving to avoid risk. All the following conflicts are the conflicts between pedestrians and right-turning vehicles.
The post-encroachment time (PET) is used to distinguish conflicts. In this paper, PET is the time period from a pedestrian entering the conflict area to the pedestrian returning to his/her normal walking speed[15]. Here, the time that the pedestrian takes to return to the normal walking speed is the time for the pedestrian to leave the conflict area. Also, the conflict area is the overlap of the pedestrian’s pass area and right-turning vehicles’ pass area. The PET is the straight-line distance of the conflict area with pedestrians crossing divided by the walking speed. A pedestrian arrives at the conflict area and decides whether he/she can cross the street. Then, if right-turning vehicles also arrive at the conflict area within the PET threshold, the situation is considered a conflict. To determine the PET threshold for a given intersection configuration, the average speed must be clear. Muley et al.[12]indicated that the average crossing speed was 1.43 m/s; however, in this study, the walking speed was assumed to be 1.2 m/s, which is a publicly recognized average speed, to calculate the PET, since the use of 1.43 m/s will substantially underestimate the number of conflicts.
Pedestrians have priority over right-turning vehicles according to the rule of law. However, pedestrians must sometimes yield to right-turning vehicles to avoid conflicts. Drivers compete with pedestrians over the right of way, which is a common phenomenon in some countries such as China and Qatar[12]. To better understand the pedestrian characteristic, this paper studies the yielding behavior of pedestrians. The frequent yielding behavior of pedestrians implies the low yielding rate of right-turning vehicles and vice versa.
There are situations in which a pedestrian or a group of pedestrians has conflicts with continuously right-turning vehicles in reality. These pedestrians first yield to vehicles but subsequently refuse to yield because they lose patience. Hence, the number of conflicts with these pedestrians should be recorded twice. In addition, the number of yieldings and the number of no-yieldings should be recorded once.
2 Data Collection
The influence factors in the conflict between pedestrians and right-turning vehicles are as follows.
Field observation shows that a pedestrian and his/her nearby pedestrians affect one another when the pedestrian is crossing in groups. Therefore, pedestrian group (PG) is proposed in this paper. A pedestrian group contains one pedestrian or several pedestrians with time headways less than 2 s and identical origination and destination. The following studies of pedestrians are conducted by the pedestrian group.
The speed of both sides in the conflict affects the conflict decision; thus, the walking speed should be considered. According to the field survey, pedestrians can be divided into two groups: runners and walkers.
The direction of crossing pedestrian affects the aggregation behavior of the pedestrian groups. Hence, the pedestrians can be divided into two groups by direction: entering pedestrians and exiting pedestrians, as shown in Fig.1.

Fig.1 Five trajectories of pedestrian crossing
The crossing location can affect the vehicle velocity that the pedestrian faces. According to the use of crosswalk in the conflict area of pedestrians and right-turning vehicles, there are two types of pedestrians: pedestrians in type Ⅰ use the crosswalks well, and their tracks are entirely within the crosswalk area; the tracks of pedestrians in type Ⅱ are not entirely within the crosswalk. As shown in Fig.1, there are five typical trajectories in reality. Trajectoriesmandnbelong to type Ⅰ. Trajectorymis near the entrance lane, and trajectorynis near the exit lane. Trajectoriesp,qandobelong to type Ⅱ. Trajectorypis near the entrance lane, and trajectoryqis near the exit lane. Pedestrians choose trajectoryoin the protected left-turning phase. This phenomenon is notably rare and commonly occurs when pedestrians have more freedom.
At signalized intersections, groups of pedestrians accumulate during the red light time. When the green light is on, they will move together. Moreover, if the right-turn lane is shared, right-turning vehicles are blocked by through vehicles and must frequently stop, so the velocities of right-turning vehicles are slow. The conflict is closely related to the present color of pedestrian lights. This study mainly discusses typical intersections with four-phase traffic signal control. Pedestrian lights only have red and green lights. The color of pedestrian lights is a reference. All survey sites have no countdown lights. There are four periods: 1) Initial green time (IG); 2) Middle green time (MG); 3) End green time (EG); 4) Red time (Red). The initial green time affects the pedestrians who arrive before the green light is on. IG encompasses the first three seconds since the green light is on. The end green time is defined as the pedestrian flashing green interval. In this study, the end green time is the last three seconds before the red light is on. The middle green time is the remaining green time. The red time is the time period when the pedestrian light is red.
Data was collected during both peak hours and off-peak hours in June 2017. Three sites with normal non-channelized right-turn approaches in Changchun were selected: the west arm of Jiefang Road-Renmin Street (JF Rd.-RM St.) intersection, the west arm of Ziyou Road-Tongzhi Street (ZY Rd.-TZ St.) intersection with a shared right-turn lane, and the east arm of Ziyou Road-Renmin Street (ZY Rd.-RM St.) intersection with an exclusive right-turn lane. These sites are situated in the downtown with heavy traffic and more conflicts between pedestrians and right-turning vehicles. Therefore, they can represent common situations of the study. During the video collection, the weather was fine, and the traffic operated as usual. Manual counts were used to obtain information. Tab.1 shows the observation results of three sites. The investigation time is 1 h and 50 min in non-peak hours, and 2 h in other conditions.

Tab.1 Number of samples under different conditions
3 Methodology
There are several methods to measure the correlation, such as crosstab analysis, correlation coefficient, regression analysis, and analysis of variance (ANOVA). However, for the effect of the factors to study in this article on conflict, these methods do not fit. The crosstab analysis cannot tell whether the correlation is positive or negative. The correlation coefficient can only measure the linear correlation. Regression analysis makes sense only if the result is under a very large sample size. The actual situation does not match the basic assumption of ANOVA. We need a simple and effective method to measure the relevance between the factors and the traffic-conflict-related incidents.
In recent years, some scholars adopted odd-ratios (ORs) in studying the relationship between factors and traffic conflict events. This method is simple and efficient and makes a good measure of relevance. All studies indicated the applicability of the OR indicator in traffic conflict research[17-18]. However, due to the relatively large pedestrian flow and motor flow at the survey sites and different indicators selected in the conflict measurement, the highest percentage of conflict obtained in this study is much higher than 5%. The OR indicator cannot accurately reflect the relative risk (RR) of exposure factors. In addition, the research in this article is a cohort study, which implies that the sample can reflect the population, and the relative risk index can be directly calculated. Therefore, instead of using the OR indicator, which is currently widely used by researchers in traffic conflicts, we directly calculate the relative risk.
The relative risk was originally defined as the ratio of cumulative incidences of exposure to the cumulative incidence of non-exposure groups. Corresponding to the influence research of conflict events, the relative risk refers to the ratio of the exposure group conflict rate and the non-exposed group conflict rate. Tab.2 shows all required parameters in the calculation.

Tab.2 Number of pedestrian groups in the conflict groups and reference groups depending on the exposure
(1)
In Tab.2,Ais the number of conflict group under the exposed factor condition;Bis the number of conflict group under the unexposed factor condition;Cis the number of reference group under the exposed factor condition; andDis the number of reference group under the exposed factor condition. If RR is equal to 1, the factor has no effect on the occurrence of conflict. If RR is greater than 1, the factor is risky. If RR is less than 1, the factor is protective and can decrease the number of conflicts. The calculation about pedestrian yielding behaviors is similar to the calculation about conflict.
The factors include the scale of pedestrian groups, pedestrian speed characteristics, selected trajectories by the pedestrians, directions (whether the pedestrians are exiting or entering the intersection) and present color of the corresponding pedestrian lights. The calculation results are shown in Tabs.3 and 4. C/R in Tab.3 means conflict group/reference group. N/Y in Tab.4 means no-yielding group/yielding group.

Tab.3 Relative risks to conflicts between pedestrians and right-turning vehicles

Tab.4 Relative risks to pedestrian no-yielding behaviors in conflict situations
4 Result Analysis on the Factors of Pedestrian Crossing
4.1 Companion
The result of relative risks in Tab.3 is not very convergent. But our preceding research has convergent results[19]. Thus, the pedestrian crossing in groups has a larger risk of being involved in conflicts. The reason can be that the span of several pedestrians is longer than the span of one pedestrian. When they are crossing in groups, pedestrians in groups can affect one another and become more impatient to choose a safer acceptable gap. Therefore, the pedestrians in groups are more likely to yield to vehicles.
4.2 Walking speed
Running is a distinct acceleration behavior of pedestrians. Tabs.3 and 4 show that the running pedestrians have a larger risk of being involved in conflict and no-yielding behavior than those pedestrians who walk slowly. On the one hand, running pedestrians are commonly younger, more competitive and have more confidence than the walking pedestrians. On the other hand, the running behavior of pedestrians causes some perception limitations between the pedestrian and the driver. Not running causes conflicts, but pedestrians choose to run due to conflicts. To some degree, running is a yielding behavior of pedestrians to vehicles, but running is undoubtedly a risk factor of pedestrian crossing. To maintain safety, the vehicles should slow down, and the pedestrians should increase their vigilance and not abruptly speed up when they cross intersections.
4.3 Direction
The pedestrians who enter intersections and those who exit intersections have different aggregation characteristics because of the signal control. Entering pedestrians gather with one another and form larger pedestrian groups while they wait during the red period. The exiting pedestrians gradually disperse when they are crossing the intersection. Thus, the direction of pedestrians (entering or exiting intersections) obviously affects the pedestrian-vehicle conflicts.
Tab.3 shows that the pedestrians entering the intersection have greater conflict risk than those exiting the intersection. This phenomenon is connected with different aggregation characteristics of exiting pedestrians and entering pedestrians. The result is identical with the previous study[19].
Tab.4 shows that the pedestrians entering the intersection more likely do not yield to right-turning vehicles. This behavior conforms to the right of way.
Thus, the combined action of pedestrian groups and signal control modes varies the conflicts and yielding decisions between entering pedestrians and exiting pedestrians.
4.4 Trajectory
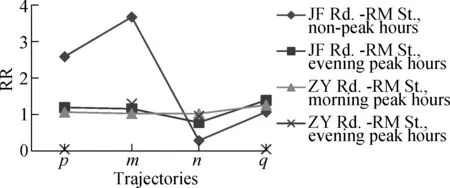
The results of the effects of pedestrian trajectories on conflicts are shown in Figs.2 and 3. Every point in the following figures should be contrasted with 1. The maximum RR value in Fig.2 is 19.17. For the drawing range, we replaced 19.17 with 5.
Fig.2 shows that the pedestrians who use the crosswalk well in trajectoriesmandnmake a strong contrast with the pedestrians who do not use the crosswalk well in trajectoriespandqwith regards to conflict risk. The pedestrians select trajectorynwith a RR of conflict larger than 1 and a RR of no-yielding less than 1. Hence, pedestrians in trajectorynhave a higher risk of unsafety.

Fig.2 Relative risks of trajectories that pedestrians choose to cross intersections to conflicts

Fig.3 Relative risks of trajectories that pedestrians select to cross intersections to no-yielding behaviors of pedestrians in conflict situations
The contrast between the pedestrians who use the crosswalk well and those who do not use crosswalk well, as shown in Fig.2, indicates that we should pay particular attention to pedestrian safety, specifically on exit lanes.
Fig.3 shows that pedestrians are more likely to yield in trajectorynthan in trajectorym, which may be significantly related to the velocity changes of vehicles during the right turn. Right-turning vehicles driving to exit lanes are faster than those at entrance lanes, which is closely related to the stop line on the entrance lane. Although pedestrians have priority, they prefer to yield to right-turning vehicles.
Pedestrians who do not use crosswalks well, such as those in trajectoriespandq, tend to compete to pass before the right-turning vehicles. Those pedestrians are adventurous and take priority for granted, and thus, they are inclined to save time instead of safety.
4.5 Signal phase
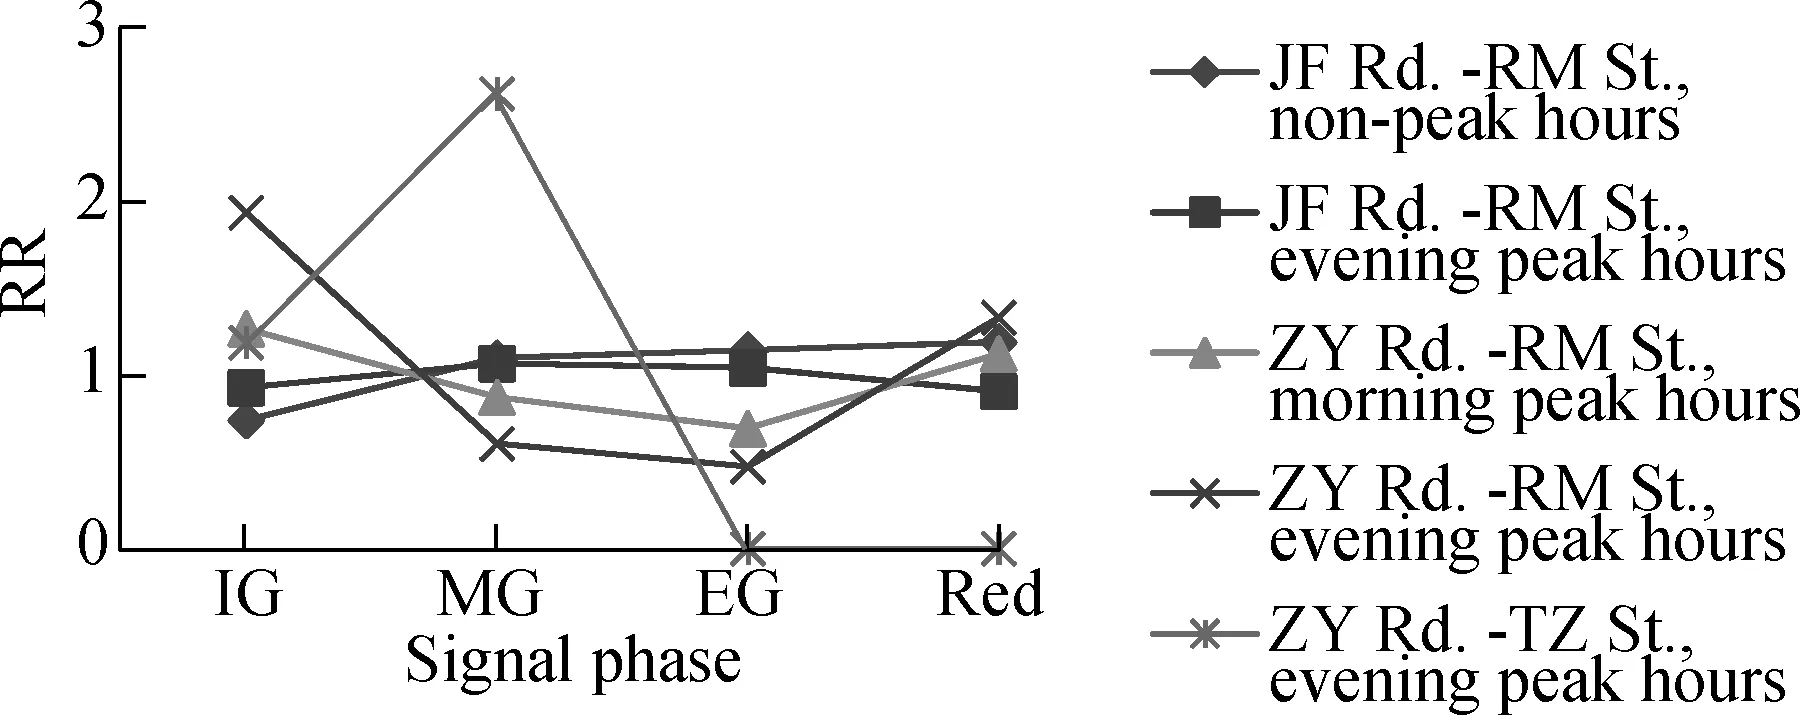
The west arm at JF Rd.-RM St. intersection and the east arm at ZY Rd.-RM St. intersection are notably different in Fig.4. The effect of the signal phase to conflicts may be related to the pattern of right-turn lanes. For shared right-turn lanes, conflicts tend to occur during the middle and end of the green period. For exclusive right-turn lanes, conflicts tend to occur during the initial green period and red period. The following reasons are likely explanations: There are more pedestrians and pedestrian groups during the initial green period; the attention level of drivers noticing pedestrians is lower during the pedestrian red-light phase.

Fig.4 Relative risks of signal phases when pedestrians cross intersections with conflicts>
Fig.5 shows that pedestrians crossing during the middle green period more likely yield to right-turning vehicles. Furthermore, the yielding behavior may relate to different periods of the day.

Fig.5 Relative risks of signal phases when pedestrians are crossing intersections to pedestrian no-yielding behaviors in conflict situations>
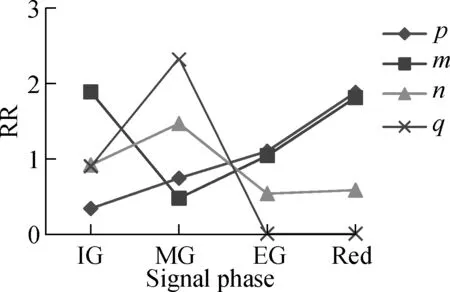
To better understand the effect of different phases on the conflict process, we analyzed the effect of the signal phase on the conflict and yielding behavior in different crossing trajectories. The differences among intersections were ignored. Comparing Fig.6 with Fig.7, we observe that the relative risk of conflict atpis negatively correlated with the pedestrian no-yielding behavior relative risks. The conflict relative risks atqis positively correlated with the pedestrian no-yielding behavior relative risks. In Figs.6 and 7, the RR trends atmandnshow a significant negative correlation.

Fig.6 Relative risks to conflicts of different trajectories with changing signal phases

Fig.7 Relative risks to pedestrian no-yielding behaviors in conflict situations of different trajectories with changing signal phases
5 Conclusion
This paper uses relative risks to analyze the influence factors of conflicts between pedestrians and right-turning vehicles at signalized intersections in detail. The findings of this study can be used as the foundation of traffic controlling measures and regulate the street crossing location of pedestrians. For example, set physical isolation in place so that the pedestrians cannot directly enter the motor vehicle lane from the sidewalk at the spot without the crosswalk. There are more frequent conflicts between pedestrians and right-turning vehicles at the exit lane. Also, the priority of pedestrians cannot be guaranteed. Therefore, the speed of right-turning vehicles in front of the pedestrian crossing should be restricted by additional measures such as setting signs or flashing lights to indicate right-turning vehicles. At the intersections where there are frequent conflicts between pedestrians and right-turning vehicles, it is advisable to give up the RTOR mode and separate pedestrians and right-turning vehicles by signal lights. If the arm covers dividing strips, a clear pedestrian waiting area should be marked to reduce the vehicle delay caused by the waiting pedestrians. This work will contribute to normalizing the pedestrian crossing, reducing the number of accidents and improving the operating efficiency at intersections. This paper examines the situation from a pedestrian’s perspective without considering the driver. An extension study will investigate the effects of vehicle velocities and driver behaviors on the conflict. The conclusion of this paper is applicable to the following conditions: The pedestrian flow is 350 to 600 people/h, and the right-turning vehicle flow is 100 to 550 veh/h. However, different cities, districts and intersections have different pedestrian flows, right-turning vehicle flows and pedestrian behaviors. In order to obtain a more systematic and comprehensive conclusion, various combinations should be considered.
杂志排行
Journal of Southeast University(English Edition)的其它文章
- Influence of image data set noise on classification with a convolutional network
- A low-cost personal navigation unit
- Flexural behavior of steel reinforced engineered cementitious composite beams
- Compact passing algorithm for signalized intersection management based on vehicular network
- Effect of contract choice on upstream carbon emission reduction considering carbon taxation
- Multi-relaxation-time lattice Boltzmann simulation of slide damping in micro-scale shear-driven rarefied gas flow
