An improved lattice Boltzmann model for high gas and liquid density ratio in composite grids
2018-11-24ShojunZhngWnqingWuQinggongZheng
Shojun Zhng, Wnqing Wu, Qinggong Zheng
a Marine Engineering College, Dalian Maritime University, Dalian 116026, China
b College of Naval Architecture and Marine Engineering, Shandong Jiaotong University, Weihai 264310, China
Keywords:Lattice Boltzmann model Density ratio Composite grids Bubble motion Temperature effect
ABSTRACT Lattice Boltzmann method is one of the widely used in multiphase fluid flow. However, the two main disadvantages of this method are the instability of numerical calculations due to the large density ratio of two phases and impossibility of the temperature distribution to be fed back into the velocity distribution function when the temperature is simulated. Based on the combination prescribed by Inamuro, the large density ratio two-phase flow model and thermal model makes the density ratio of the model simulation to be increased to 2778:1 by optimizing the interface distribution function of two-phase which improves the accuracy of differential format. The phase transition term is added as source term into the distribution function controlling two phase order parameters to describe the temperature effect on the gas-liquid phase transition. The latent heat generated from the phase change is also added as a source term into the temperature distribution function which simulates the movement of the flow under the common coupling of density,velocity, pressure and temperature. The density and the temperature distribution of single bubble are simulated. Comparison of the simulation results with experimental results indicates a good agreement pointing out the effectiveness of the improved model.
The lattice Boltzmann method (LBM) is widely used in the isothermal or non-thermal field due to the gas-liquid two-phase density ratio of less than 10:1 [1-4]. However, in actual systems,the density of gas-liquid flow systems much more, an example being the water to air density ratio, which is close to 1000:1. Although in some cases the influence of temperature changes can be neglected, the flow process is more or less always accompanied by energy changes.
There is a disadvantage that all the LBM schemes are limited to small density ratio due to numerical instability in the interface, because of the lattice Boltzmann model cannot be recovered to continuity equation accurately when the interface gradient is too large. Many scholars have done a lot of research on improving the model for large density ratio and temperature change. Teng et al. [5] applied the total variation diminishing with artificial compression (TVD/AC) scheme to solve the tradi-tional lattice Boltzmann equation wherein the collision and molecular forces have been treated as explicit source terms and the phase transition of density ratio has been simulated up to 100:1.Werzner et al. [6] used a new force format to simulate the gas-liquid ratio to be 810:1 while Lee and Lin [7] simulated the impact of a liquid cylinder with a density ratio of 1000:1. Inamuro et al.[8] improved the free energy model by solving the pressure Poisson equation for considering the pressure gradient velocity field correction (projection method) to simulate the density ratio of 50 and 1000 bubble rise processes. The above method is to optimize the particle distribution function to ensure that twophase interface satisfies the continuity equation, and using the exact difference format can improve the two-phase density ratio effectively [9-12].
The optimization of LBM model for thermal flow is mainly used for multi-velocity model and double distribution function model [13-18]. However, the numerical stability of the transport coefficient of the viscous dissipative item in the multi-velocity model energy equation is poor, who may turn out to be incorrect and therefore, severely limits the use of this model. Inamuro et al. proposed the combination of the large density ratio free energy model with the lattice heat transfer model to produce a new mathematical model describing the phase transition[19, 20]. But when the interface gradient becomes too large, the pressure resulting from the lattice Boltzmann scheme diverges,i.e. the effective pressure value cannot be obtained within a desirable number of iterations.
In practical engineering, the problem of large-density ratio two-phase flow is common and a solution to this problem is of paramount interest, but the temperature models suitable for simulating large-density two-phase flow are still rare. This paper explores the two-phase flow pattern and the transition boundary between flow patterns in bubbling fluidized bed. It is necessary to simulate the liquid-vapor two-phase flow with 2778:1 density ratio and to analyze the bubble deformation and temperature distribution. A multi-distribution function model based on large-density ratio model and thermal model was constructed to analyze the motion mechanism during the rise of bubble. This led to the density ratio of the lattice Boltzmann model being improved and the simulation of the flow under the common coupling of density, velocity, pressure and temperature being realized.
A kind of Lattice Boltzmann method free energy model proposed by Inamuro et al. [19] is used herein. In the LBM, a modeled fluid, composed of identical particles whose velocities are restricted to a finite set ofvectors, is considered. The fifteen-velocity model (=15) is used in the present paper. The velocity vectors of this model are given by:

The lattice speed distribution is shown as Fig. 1. The two particle-velocity distribution functions,fiandgi, are used to calculate an order parameter which distinguishes the two phases and predicts the velocity of the two-phase fluid without a pressure gradient:
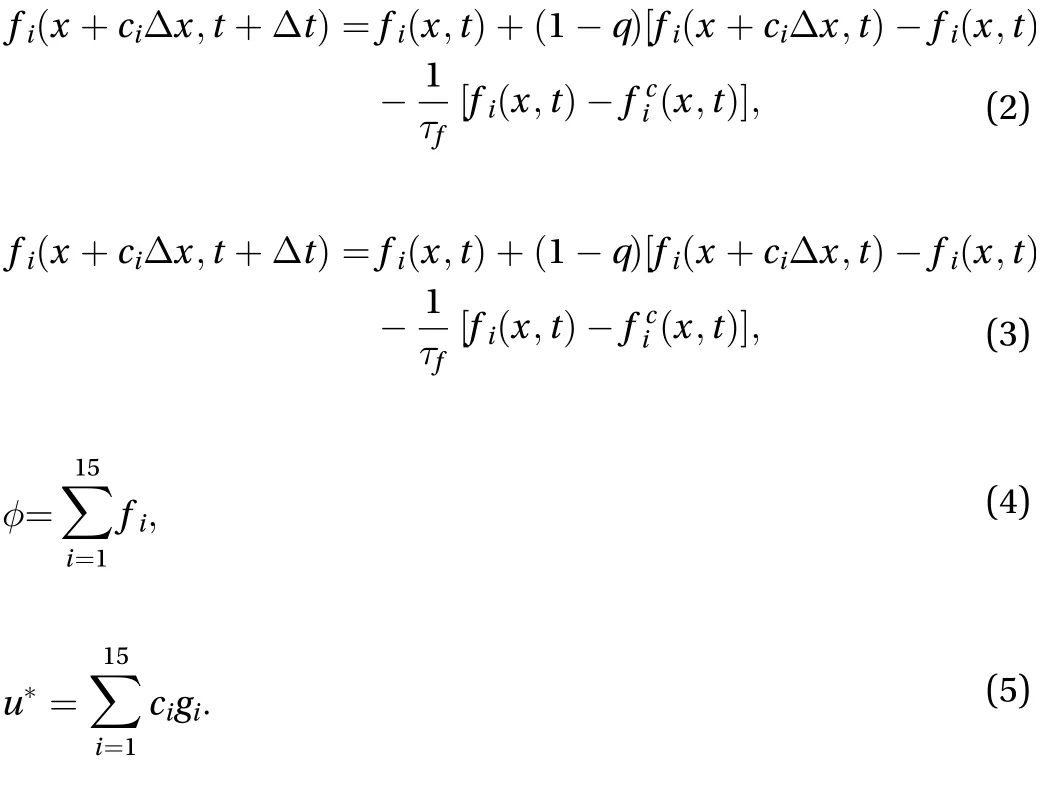
Using the above formulas, the parameterand non-pressure gradient velocitycan be obtained leading to the relationship between densityand.

The velocity obtained from the above equation is without the pressure gradient and does not satisfy the macroscopic continuity equation. The projection method needs to be applied to solve pressure and subsequently correct the velocity.

To improve the density ratio, the particle distribution function Eq. (8) that describes the interface between two phases is optimized, the density function Eq. (10) and the accuracy of the differential schemes Eqs. (11) and (12) are improved, and the pressure iterative format is corrected Eqs. (13) and (16).
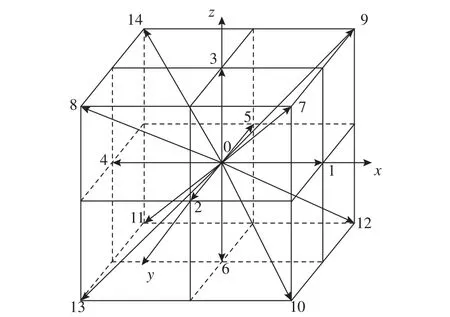
Fig. 1. D3Q15 model.
The Inamuro original model can simulate the two-phase flow with a gas-liquid density ratio of 1000:1, for effectively describing the two-phase interface change. The density distribution function can be approximately obtained from the Cahn-Hilliard diffusion equation. Cut-off technique of Level method handles the two-phase interface. In this paper, the Zheng model [21], the one closer to Landau phase theory in the physical background is adapted, wherein the difference term controlled by parameters is introduced into the phase describing the change distribution function. The space point has been replaced by the time point to reduce the error caused by the presence of the artificial shear term in the interface definition. Additionally, by taking the appropriate parameters, the model can be improved to second-order accuracy. The new velocity distribution function is obtained as:
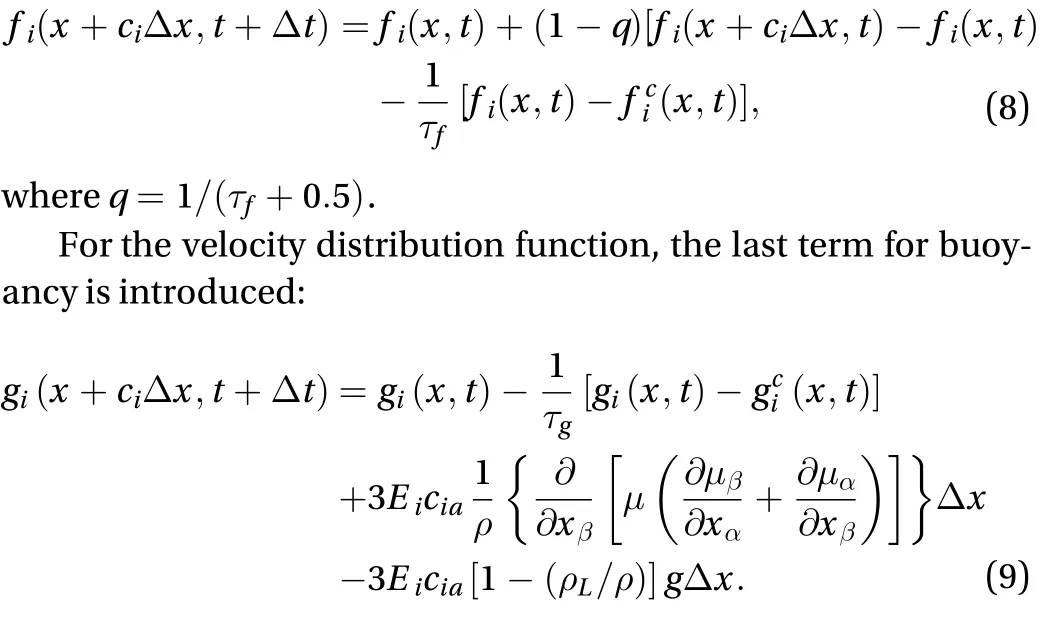
The order parameter is used to differentiate the two-phase interface and the density is obtained using format as presented in the Eq. (10) using a simple linear function instead of the sine function to obtain the equilibrium state distribution function in a simple manner, thereby enhancing the computational efficiency. In this format, the ordinal parameter values are consistent with the interface density ensuring not only the numerical stability at the interface but also identifying the gas-liquid density accurately.
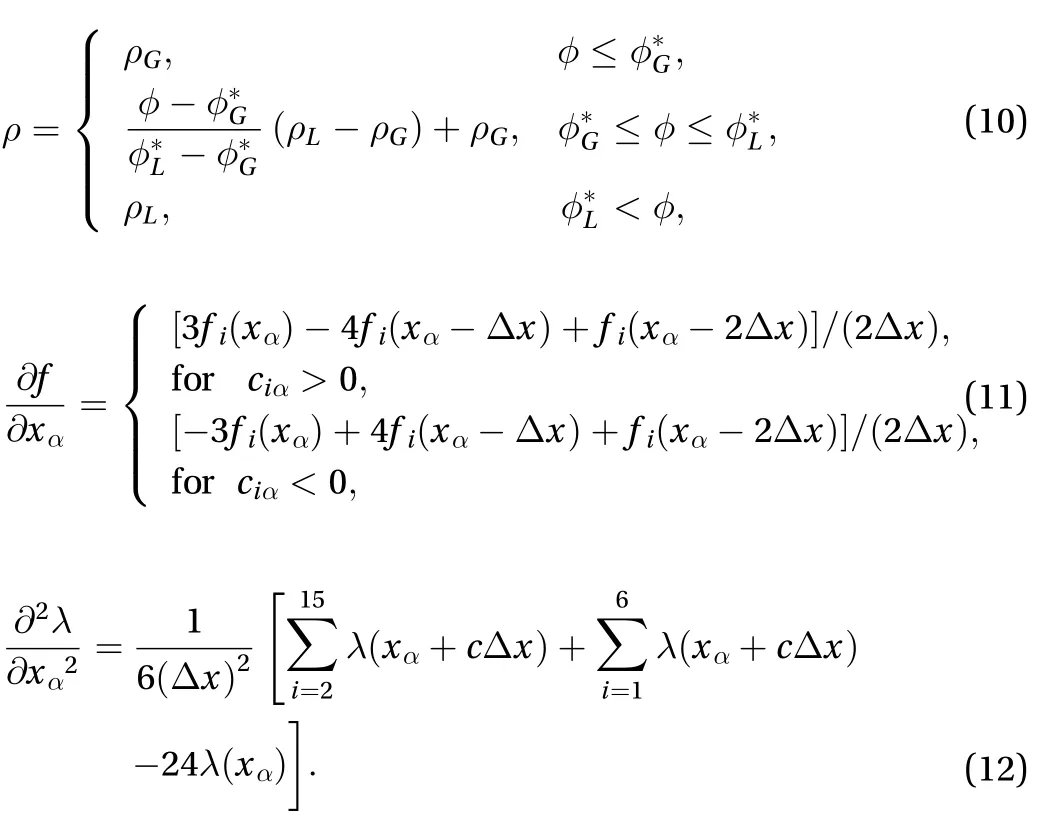
Increasing the differential scheme accuracy is an effective way to improve the numerical stability of the model. In this paper, the second-order upwind differential is used to solve the first-order partial derivative. This scheme can obtain a more accurate solution with second-order accuracy error and it is very stable. A Fourteen-point difference scheme solves the secondorder partial derivative.
The numerical instability of the original model in calculating the large density ratio is reflected in the interface gradient being too large. The pressure field resulting from the lattice Boltzmann scheme diverges, implying that an effective pressure value cannot be obtained within the desired number of iterations. This article considers the correction of pressure during the iterations.The idea is when the error exceeds the set value after a certain number of iterations (20 times in the literature), the last time distribution function is brought into the Eq. (13) as the current distribution function. This process is a regression correction of the pressure velocity distribution function, that is, when the calculated pressure deviates greatly, the value of the function is controlled within the range of a stable calculation.
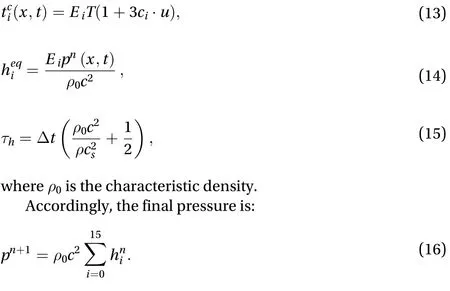
However, this approach of employing a strict range for pressure solution control, decreases calculation results accuracy. In this paper, we only apply this method on the lattice points whose iteration error exceeds the average of the whole field when iteration divergence takes place. This not only guarantees the stability of numerical solution, but also reduces the calculation error. The simulation of gas-liquid two-phase system with density ratio 2778:1, is hence realized.
According to the heat transfer model proposed by Inamuro et al. [19] in 2002, the distribution function for calculating the temperature is defined as follows:
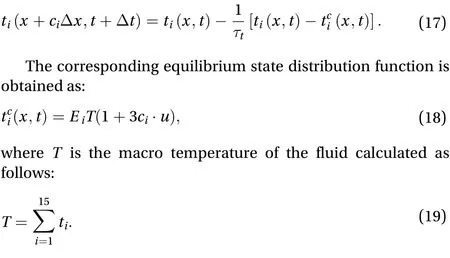
According to Landau's theory of phase transition, the gas-liquid phase change can be regarded as a phase order parameter in the simulation. Consequently, the phase transition term is added as the source term into thedistribution function controlling the two-phase order parameters to describe the temperature effect on the gas-liquid phase transition. The notation for latent heat generated from the phase change, is also included as a source term into the temperature distribution function:
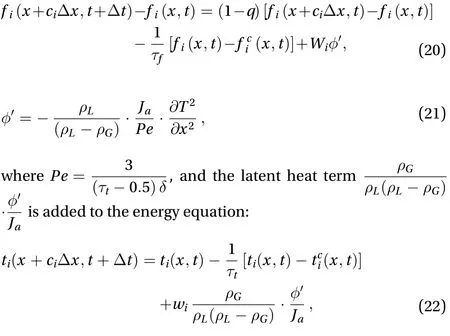
Applying Taylor series expansion and Chapman-Enskog multi-scale analysis to Eqs. (20) and (22), the following macroscopic governing equations are obtained:

The validity and accuracy of the improved large density ratio heat model needed to be explored considering two aspects. One is the effect of the temperature on the phase transition of two phases. In this aspect, the bubble deformation is the most direct manifestation of the accuracy of the model. The second criterion is the correctness of temperature distribution of flow which needs an experimental proof.
The experimental verification was done using a liquid and vapor for the two-phase flow system with a density ratio of 2778:1. A Phantom® v310 high-speed digital camera with capture rate of 6000 frames per second was used to shoot the single bubble motion in liquid having a concentration of 57.5% inside a bubble-pump lifting pipe of radius 9.5 mm, and the NEC H2640 thermal imager was used to collect the temperature distributions of single bubbles in the beaker containing boiling solution and the double bubble in the bubble-pump lifting pipe (Fig. 2).The temperature was analyzed by InfReC Analyzer NS9500 software.
After improving the model, the single bubble in water-air,water-vapor were simulated.
Figure 3 shows the density of single bubble rising process in liquid (left), velocity vector distribution (middle) and temperature field distribution (right). The bubble shape changes from the initial spherical to ellipsoidal and finally to capped spherical.The direction of the velocity vector inside the center of the bubble is upward. At the bottom of the bubble, the left and right sides have two vortexes which direct the velocity vector on both sides of the bubble from top to bottom and from the inside to outside.
It can be seen that the temperature inside the bubble is the highest and there is a gradient distribution of low temperature in the wake region below the bubble. Comparison of the temperature distributions in Fig. 3(a) and 3(c) reveals the temperature distribution around the bubble to change with the bubble shape and the velocity field distribution. The bubble bottom returns to the low temperature region gradually. The maximum temperature of bubble is reduced, i.e., the temperature field around the bubble tends to decrease.
Figure 4(a) shows the volume change of single bubble in different initial radii. The trend of increase in bubble volume is the same for different initial radii but smaller the initial bubble volume, larger is the volume growth rate in rising process. From the two curves obtained with radius of 7 and 8 lattice length, it can be seen that with the attainment of a certain value of the initial radius, the volume growth rate does not increase all the while. Because the initial parameters are set considering the physical property parameters and experimental conditions of the working fluid, the bubble size should be within a certain range.
Figure 4(b) shows the time-dependent changes in the volume of a rising single bubble at differentJanumbers (Jashow the magnitude of the latent heat of phase change). The latent heat of vaporization has a direct effect on the bubble growth.The latent heat of vaporization being different, the overall change in the trend of the growth rate is the same, but the growth rates of the single bubble volumes are different. With the increase inJanumber being larger, the occurrence of phase transition becomes more intense so that the latent heat of vaporization as a control for influencing factors in bubble growth deformation is appropriate.

Fig. 2. The comparison of simulated shape-change of single bubble with the corresponding experimental result ().
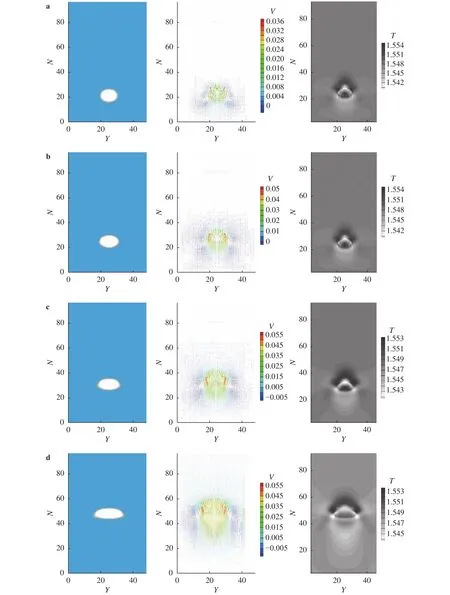
Fig. 3. The density, velocity vector, and temperature distribution of single bubble. a t=100; b t=300; c t=500; d t=900.
Figure 4(c) shows the change in the velocity of the single bubbles with different initial sizes. It can be seen that the initial bubble volume is larger, and the rising speed is faster in the first 200 time-steps. After the 300thtime-step, the volume of bubbles increases rapidly and the liquid buoyancy of bubbles increases.However, due to the deformation of bubbles, the resistance also increases. For the bubble having an initial radius of 4 lattice length, the velocity continues to increase rapidly at first and then becomes stable, while for an initial radius of 6 and 7, the bubble’s rising speed after the 400thtime-step appeared gentle and declining trend.
Figure 4(d) shows the Reynolds numbers change with time in bubbles with different initial radii during the rising process. The larger the initial radius, larger is the Reynolds number. The Reynolds number of the bubble with an initial radius of 4, keeps growing with the continuous increase in the rising velocity as the flow becomes more intensive. Reynolds number of the bubble with initial radius 5 reached a stable state after 700 time-steps. At this point, the bubble velocity is stable and the bubble shape reaches a final form. For the bubbles with initial radii 5 and 6,the Reynolds number decreases after 400 time-steps. The influence of the bubble shape change in the flow is be greater than that of the bubble velocity, and the intensity of the flow decreases.
Using the thermal imaging camera, the distribution of temperature of a single bubble in the tube is shown in Fig. 5. The bubble temperature is highest at the bubble center, and it decreases going from the inside to the outside. Taking the bubble at a fixed height on the same abscissa, a three-point position for temperature measurement, the bubble center temperature was found to be 103.31 °C, while the temperature outside bubble was lower than the internal temperature. By measuring the singlebubble temperature distribution data, shielding of the ambient temperature, wall effects on the single bubble and increasing the lowest temperature range, a more clear temperature distribution can be obtained.
The liquid in a beaker was heated to boiling followed by the measurement of single bubble temperature distribution in liquid with a density ratio of 2778:1 and subsequent comparison with the experimental results.
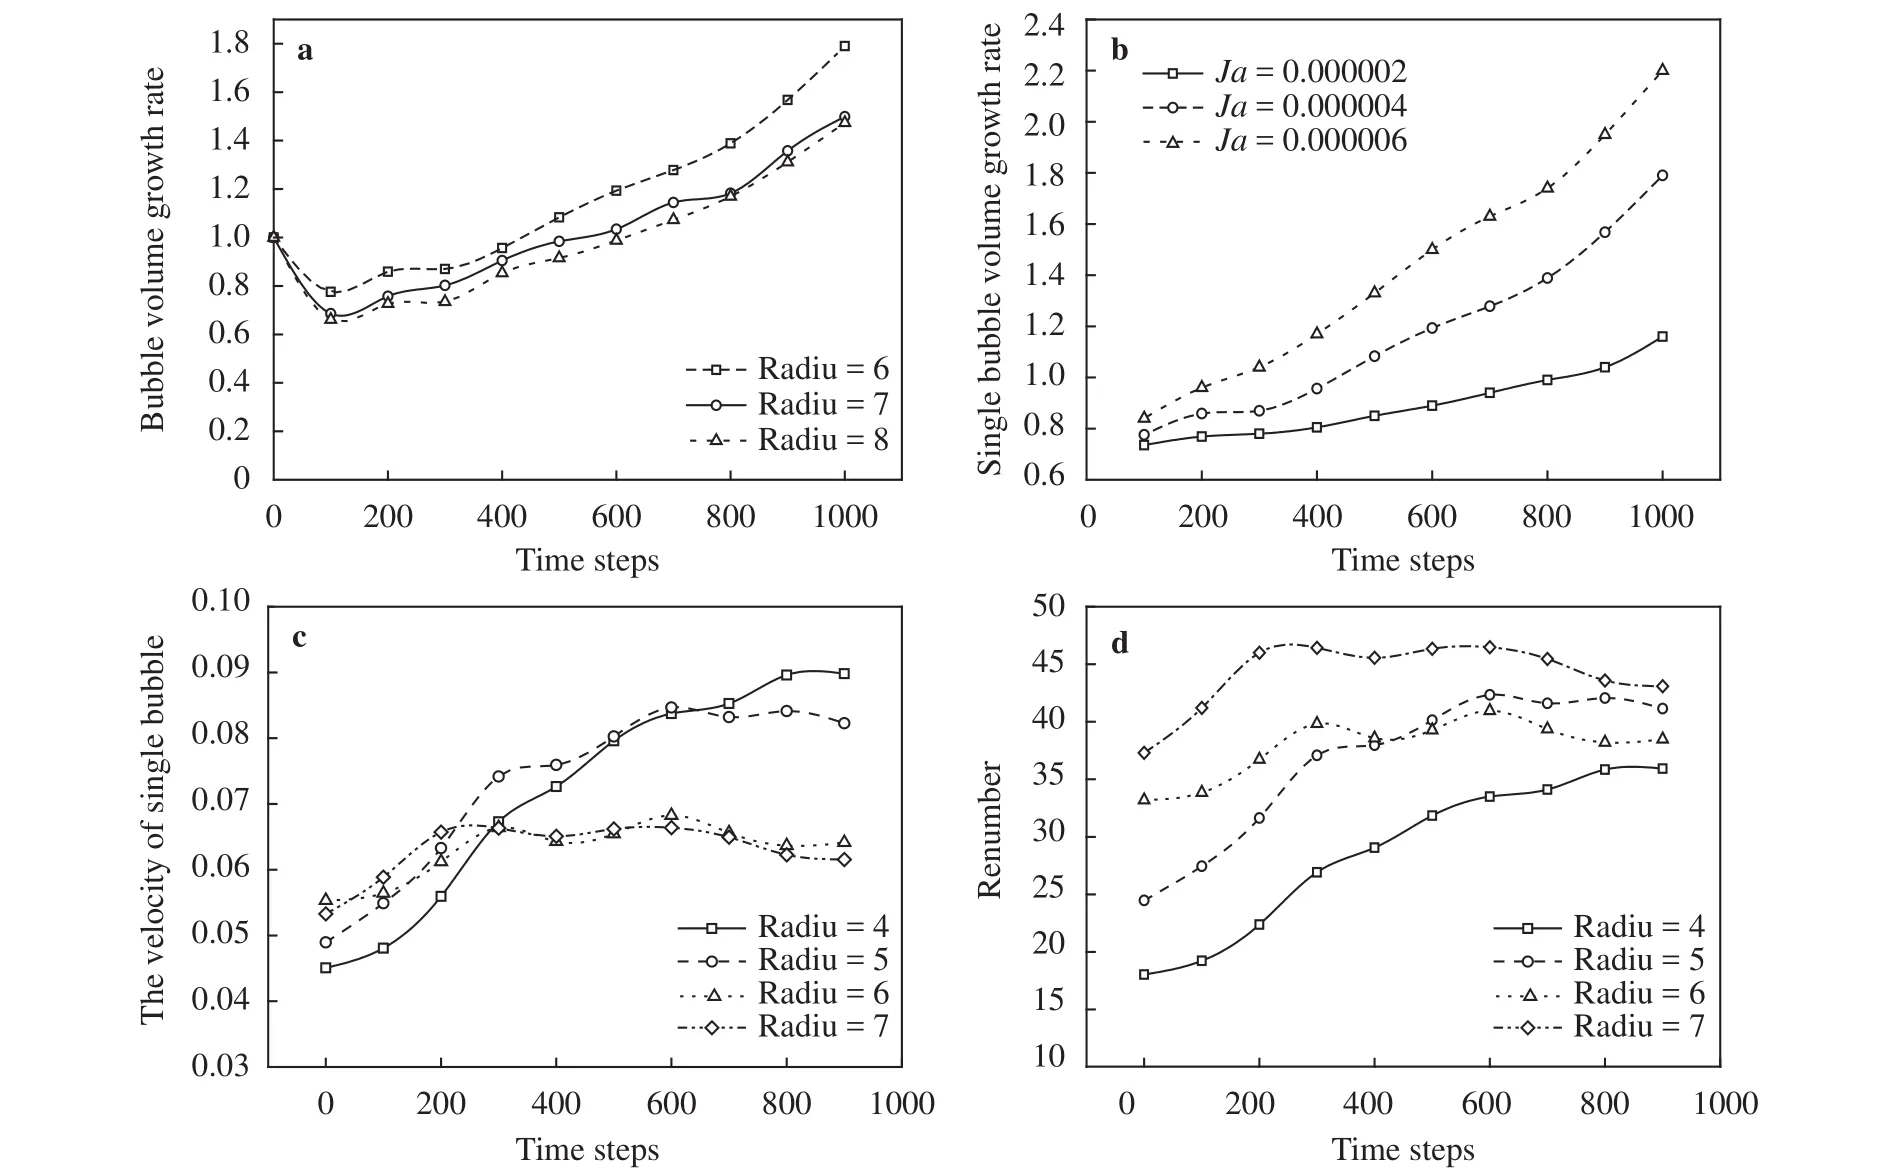
Fig. 4. a the initial bubble radius effect on bubble volume growth rate; b the Ja number effect on bubble volume growth rate; c the change of single bubble velocity in different initial radius; d the Reynolds number changes in different initial radius.

Fig. 5. The experimental measurement of single bubble temperature field analysis.
Figure 6(a), (b) shows the temperature distribution in the liquid in the beaker after heating. Since the density of liquid increases with temperatures high and low, the temperature distribution can be seen as different temperature liquid flow field and heat transfer field. The bubble at the center of the liquid was still analyzed at some points. The temperature at point A and the temperature at points B, C and D around the bubble were measured. The bubble was found to be entirely in the liquid orange zone. The average temperature of the surrounding liquid was about 98°C. When the temperature reaches 105°C, the boundary of gas and liquid show the red boundary, i.e., the temperature distribution inside the bubble is larger than at the boundary and the boundary temperature is higher than the temperature of the surrounding liquid. Point D is in the upper right corner of the bubble and the heating zone at the bottom. So the temperature is low. But the point B being in the red temperature zone within the fluid and C at the bottom of the high temperature fluid, the ambient temperature is higher than A point resulting in the temperature of the gas phase in the bubble being higher than the temperature of the surrounding fluid.
Compared to the simulation (black dashed line), as shown in Fig. 7(a) and (b), the experimental results (gray solid line) of single bubble vertical and horizontal temperature distribution,have a consistent trend and good match. In the horizontal direction, the bubble center temperature is highest which gradually decreases on both sides. In the vertical direction, the low temperature wake region appears at the bottom of the bubble, and the bubble center temperature is at the highest.
Table 1 show the experimental and simulation results of bubble average temperature. The difference between the horizontal and vertical directions is 0.01°C and 0.8067°C respectively,which verifies the correctness of the composite thermal model.
In practical engineering, the problem of large-density ratio two-phase flow is common, a multi-distribution function model based on large-density ratio model and thermal model was proposed, the temperature as an impact factor being added into describing the phase change distribution function. The simulation of flow under the common coupling of density, velocity, pressure and temperature is realized. Using a vapor-liquid system with 2778:1 density ratio to make experimental verification, the results show:
(1) Optimizing the interface distribution function, improving the accuracy of the differential scheme, and correcting the pressure iterative scheme can improve the stability of the large density ratio two-phase flow model effectively.
(2) The phase transition term should be added as source term into the distribution function controlling two phase order parameters to describe the temperature effect on the gas-liquid phase transition. The latent heat generated from the phase change should also be added as a source term into the temperature distribution function to replicate the movement of the flow under the common coupling of density, velocity, pressure and temperature.

Fig. 6. a, b Experimental and c simulated temperature distribution of a single bubble.

Table 1 Comparison of single bubble average temperature between LBM simulation and experimental results.
(3) The shape-change simulation result is consistent with the single bubble rising process in the experiment. The simulation and the experimental result of single bubble vertical and horizontal temperature distribution have a consistent trend and a good match, verifying the reliability of the model.
Acknowledgments
This research was supported by the National Natural Science Foundation of China (51609131), Shandong Provincial Natural Science Foundation of China (ZR2017MEE031), Weihai Science and Technology Development Plan (2017GNS18), and Shandong Provincial Higher Educational Science and Technology Foundation of China (J16LA61).
杂志排行
Theoretical & Applied Mechanics Letters的其它文章
- Continuum percolation of porous media via random packing of overlapping cube-like particles
- Traffic flow and safety analysis
- Air entrainment in a vertical dropshaft with limited air supply
- Intrinsic relationship of vorticity between modes A and B in the wake of a bluff body
- A visualized study of interfacial behavior of air–water two-phase flow in a rectangular Venturi channel
- Inlet flow disturbance effects on direct numerical simulation of incompressible round jet at Reynolds number 2500
