Aerodynamic Performance Optmization and Data Mining of a Low Pressure Exhaust Hood
2018-11-21
(Institute of Turbomachinery,Xi’an Jiaotong University,Xi’an,China E-mail:songlm@mail.xjtu.edu.cn)
Abstract:The design of exhaust hood is a typical high dimensional,expensive computational and black box problem.Multi-Point Search based Efficient Global Optimization(MSEGO)is proposed to solve this problem.MSEGO is used for the aerodynamic performance optimization of a low exhaust hood with non-axisymmetric outer flow guider.After optimization, the static pressure coefficient of the exhaust hood increases by 284.54%, and the aerodynamic performance analysis explains the reason of the improvement. Further, the analysis of variance (ANOVA) as the data mining technique is used to extract information of design space and analyze the influence of variables on the performance.Though aerodynamic performance analysis and data mining, it indicates that non-axisymmetric outer flow guider and the width of outer hood has a significant effect on the aerodynamic performance. Thereby, design lessons are derived and accumulated for the optimization of similar designs.
Keywords:Exhaust Hood,MSEGO Algorithm,Design Optimization,Data Mining
Nomenclature
MSEGO Multi-Point Search Efficient Global Optimization
GEI generalized expected improvement
Cspstatic pressure coefficient
Ctptotal pressure recovery coefficient
ANOVA analysis of variance
1 Introuduction
High efficiency and long operation life are two main design objectives of modern large power output steam turbines[1].As a crucial component between the last stage blade in a steam turbine and the condenser,the low pressure exhaust hood is designed to recover the leaving kinetic energy of the last stage turbine while guiding the flow from the turbine to the condenser.For a 30MW steam turbine,recovering one third of the turbine exit kinetic energy can improve the low pressure turbine stage output power by approximately 2.5%and the overall turbine power by 0.8%[2].Tindell et al.[3]showed that approximately 15-20%pressure recovery capability was lost in the exhaust hood.Some other data from Toshiba et al.[4]show that the loss level of the exhaust hood is the same as that of the stator and rotor blades in the low pressure steam turbine.In the exhaust hood,the large and strong swirl of the flow is widely considered to be the main cause of the loss[5].Zhang W.et al.[6]investigates the three-dimensional flow structure inside an exhaust hood model of a low-pressure steam turbine using a particle image velocimetry(PIV)velocity field measurement technique for the velocity field. Finzel C et al.[7]experimentally investigates the sensitivity of certain geometrical exhaust hood parameters on the pressure recovery of the whole exhaust system of low pressure steam turbines. The flow area in the horizontal joint plane is identified as the most sensitive geometrical parameter in the exhaust hood. Tindell et al.[3]numerically analyzed the effect of diffuser geometry on the static pressure recovery coefficient.The result indicates that the exit diameter of the diffuser was the key geometrical parameter.Burton et al.[8],Li Z.G.et al.[9],Shao S.et al.[10]and Beevers et al.[11]performed detailed studies on the flow behavior in the exhaust hood including the influence of the last stage turbine outflows.Yooh S[12]applied non-axisymmetric outer flow guider in an exhaust hood design and obtained performance improvement.The research indicates that a high performance exhaust hood design leads to an enhancement of the steam turbine efficiency.
Therefore,the design optimization of exhaust hood has been the subject of previous research YANG et al.[1]applied the third order response surface approximation model to the design optimization of the outer flow guider.Li[5]developed an automatic optimization platform for low pressure exhaust cylinders based on a neural network.The optimization of a exhaust hood diffuser has been performed by FU et al.[13],and they compared the effect on exhaust hood aerodynamic performance adopting different diffusers by numerical and experiment techniques.Zhu[14]proposed the meta-model based design optimization for the aerodynamic optimization design of the exhaust hood. However, the design optimization of exhaust hood is a high dimensional computationally expensive problem.All the above methods need a lot of computation time and the non-axisymmetric outer flow guider design is not considered in the design optimization.To achieve the global optimum of computationally expensive problems in a much cheaper way,it need a more advanced surrogate-based optimization method.
On the other hand,the design optimization of exhaust hood is also a black box problem.The optimization design method only obtains optimal design. The relations between design variables and objective function are indistinct.In order to analyze this relation,integrating data mining techniques is an effective way. Obayashi et al. [15, 16] applied data mining techniques such as analysis of variance and self-organizing maps to different aerodynamic designs,trade off information between contradicting objectives and the effect of design parameters on the objectives are explored.Oyama et al.[17]utilized proper orthogonal decomposition to extract useful design information of a transonic airfoil blade.Besides,Oyama et al.[18]combined scatter plot matrix orthogonal decomposition to analyze Pareto solutions.
In this paper,a Multi-Point Search based Efficient Global Optimization(MSEGO)is proposed,which can obtain the global optimal with less iterations.Then,combined with the MSEGO algorithm with the data mining technique of analysis of variance (ANOVA), 3D parameterization method and Reynolds- Averaged Navier-Stokes (RANS) Solver, a design optimization platform of a low pressure exhaust hood considering non-axisymmetric outer flow guider is established. Finally, the aerodynamic performance is improved and more design information is obtained.
2 Optimization Method
Based on Efficient Global Optimization(EGO)[19,20],a modified EGO algorithm named Multi-Point Search Efficient Global Optimization(MSEGO),which is characterized by multiple sampling at one time,is proposed.Starting with a small initial sample, a first rough surrogate model is generated.Then,using the objective value of the new multi points,the model is updated and the next evaluation is determined.This iterative process is performed until a termination criterion is met.This algorithm includes the Kriging model and multipoint infilling criterion.
2.1 Kriging model
Assume we have evaluated a deterministic function of k variables atnpoints,which are generated by Uniform Design Sampling(UDSB).The Kriging model predicted value is as follows:

In Eq.(1),the first is a global approximationμ;the second is a realization of a stochastic process with zero meane(x(i)),which represents a local deviation from the global model,calculated by quantifying the correlation of x with nearby points.The covariance matrix ofe(x(i))is given by Eq.(2).The non-Euclidean distance is given by Eq.(3).

wherekdenotes the dimension of design space,θhandphdenote the unknown correlation parameters,assumedRis the correlation matrix,the Kriging predictor value ofxis obtained from

wheredenotes the estimated value ofμ,rdenotes the correlation vector of lengthnbetween an untriedxand the sample data points.

In the Kriging model,the correlation parameterphis related to the smoothness of the function in coordinate direction h,andph=2.In addition,the uncertainty of(x)can also be evaluated through its mean squared error(MSE):
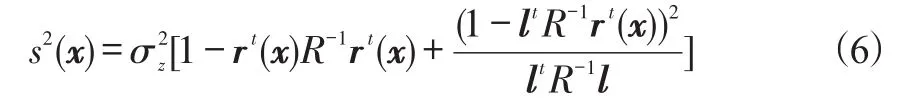
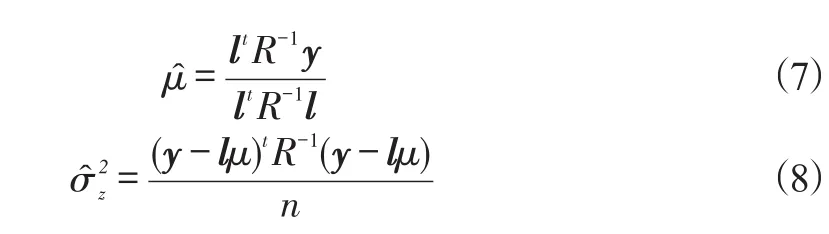
where,σ2zdenotes the process variance of the Kriging model.Usually,the value ofμandσ2zare estimated by expressions(7)and(8),more details can be found in reference[19].
2.2 Multi-Point Infilling Criterion
Traditional EGO algorithm use the Expected Improve(EI)as infill sampling criterion,which is proposed by Jones et al.[20].In this paper, we combine the maximum of generalized expected improvement(GEI)(g=0,1,2…10),the minimum of the Kriging response surface(fmin)and the maximum of variance(s),to obtain 13 new samples.Then,according to the distance of new samples,similar samples are filtered,which will be added per iteration to balance exploration and exploitation abilities.
In new infilling samples,the minimum of the Kriging response surface(fmin)and the maximum of the variance(s)can be calculated by the Kriging model.For 10 points obtained by maxGEI(g=0,1,2…10),it needs the GEI function to calculate.GEI uses thegparameter to tune the search behavior.A high g value tends to make the search more global and a low g value denotes a more local search[21].
Firstly,EI represents expected value of the potential improvement.The expression of EI is as follows:

sdenotes the mean squared error,denotes the prediction,Φandφdenote the cumulative distribution function and the probability distribution function,respectively.
GEI used thegparameter to tune the search behavior based on EI criterion.Ahighgvalue tends to make the search more global and a lowgvalue denotes a local search[21].
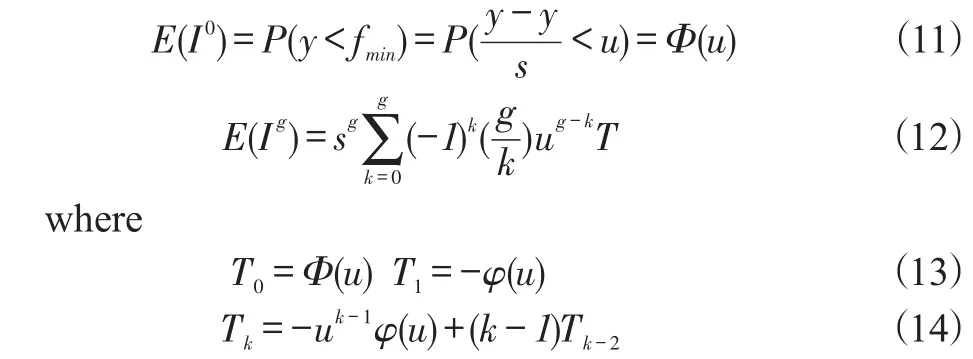
Figure 1 presents the sketch map ofs2(x)and GEI.Whengis smaller as in Figure 2(b), the point with maximum GEI values are usually obtained close to the position offmin;Whengis larger as in Figure2(c),the point with maximum GEI values are usually obtained close to the position of the maximum of the response surfaces2 max.Therewith,the differentgvalue enables the control over the search behavior of the algorithm.

Fig.1 GEI criterion
The sequence of MSEGO algorithm as presented by Figure 2.MSEGO uses this multi-points infilling criterion to improve the trade-off between exploration and exploitation.

Fig.2 Flowchart of the MSEGO
2.3 Function Test
In order to test the performance of MSEGO algorithm,four classical test functions are selected to solve the optimized values by MSEGO.The test functions are all nonlinear problems with multiple peak values. The results of the tests are summarized in Table 1,where EGO is the traditional algorithm.In addition,Table2 compares the total compute samples and iterations between MSEGO and EGO algorithms.In all tests,the MSEGO algorithm can achieve the global optimum,which is closer to analytical values than EGO with a maximum deviation of 0.7%.As for EGO,its deviations are usually larger than MSEGO and for the Shekel function,it failed to find the global optimum.Although the total number of samples are higher for MSEGO,the number of iterations reduces significantly. Due toparallel computation,it saves computation time.Thus,the MSEGO algorithm has a global search ability at low computational costs.

Tab.1 Tests on typical mathematical problems
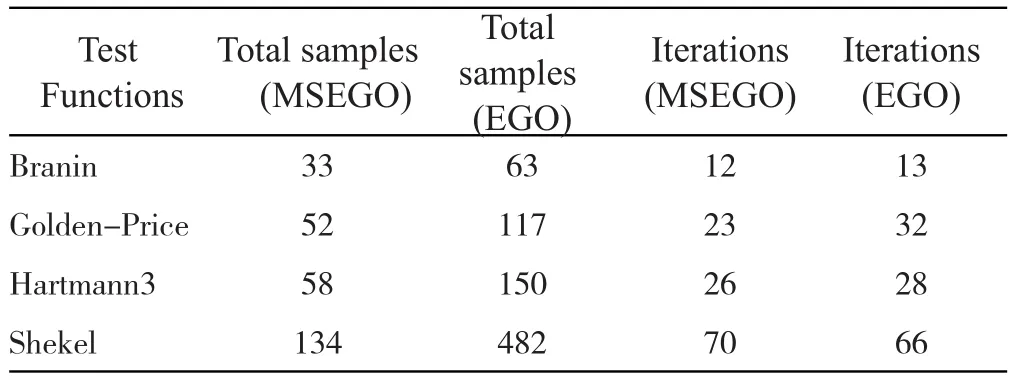
Tab.2 The total samples and iterations comparison of different algorithms
3 Aerodynamic Optimizaton of Exhaust Hood
3.1 Optimization Platform
By integrating data mining techniques,a RANS solver and the MSEGO algorithm, a design optimization method for a low pressure exhaust hood is presented in Figure 3.This platform includes an optimization algorithm module,variable resolver module, constraint handing module, performance analysis module and a data mining module.The new algorithm MSEGO is applied as the optimization algorithm.Unlike in conventional methods,data mining techniques are incorporated into the optimization process,which can explore the design space.

Fig.3 Design Optimization Platform
3.2 Parameterization Method and Design Variables
The parametrization methods determine the design space of the optimization problem.Figure 4 gives the 3D parameterization method with non-axisymmetric outer flow guider.Wherein,Hodenotes the outer hood height,Hidenotes the inner hood height,LoandLidenote the outer and inner hoods lengths,respectively.Wdenotes the outer hood half width.α1andα2denote the outer flow guider inlet and outlet angle,andβ1andβ2denote the inner flow guider inlet and outlet angle,respectively.bdenotes the width of exhaust diffuser outlet.HogandHigdenote the outer and inner flow guiders height.

Fig.4 3D parameterization method with non-axisymmetric outer flow guider
Here,the technique of a third-order Bezier curve is used for parameterization of the inner and outer flow guider profiles of the exhaust diffuser.Each curve is controlled by 4 control points and the initial points of inner and outer flow guiders(P1andP5)are fixed to connect with the last turbine stage.P4is determined byHoandb;P8is determined byHog.For an axisymmetric flow guider,only 6 design variables(α1,b,Hog,α2,P6,P7)are required.In this optimization,the non-axisymmetric outer flow guider has to be taken into account,which has different 2D profiles of the upper half and the lower half.Therefore,we select the upper,middle and lower three main curves including 18 design variables to control the profiles of outer flow guider.
The selected design variables are shown in Table 3.The outer hood heightHoand the outer hood lengthLoare fixed du-ring the optimization progress.In the optimization,8 design variables control the overall exhaust hood and inner flow guider,and the other 18 design variables along three main curves control the profile of non-axisymmetric outer flow guider.

Tab.3 Design variables
3.3 Objective Function
The static pressure coefficient is an important criterion to evaluate the aerodynamic performance.In the optimization of the exhaust hood,the optimization is maximizing the mass-averaged static pressure coefficient,which is obtained by means of the Eq.(15)and Eq.(16).
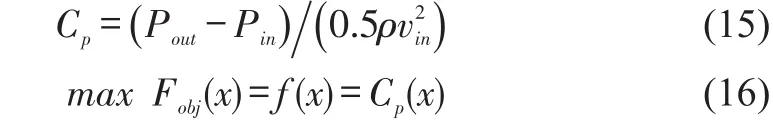
Where,PinandPoutrepresent the averaged inlet static pressure and the averaged outlet static pressure in the exhaust hood,respectively.ρandνinrepresent the stream density and flow velocity at the exhaust hood inlet.
3.4 Numerical Method
The aerodynamic performance of exhaust hood is evaluated by using the commercial CFD software ANSYS CFX.The grid generation is performed by ICEM.Figure 5 shows the computational domain and grid of the exhaust hood with the last stage and rotor tip clearance.The exhaust hood is discretized with an unstructured grid, and the last stage blades and rotor tip clearance are discretized with multi-block structured grid.The computational grid nodes are equal to 4.67 million.

Fig.5 Computational domain and grid of the exhaust hood with the last stage and rotor tip clearance
The solutions are obtained by solving the steady compressible RANS equations with the standardk-εturbulence model.The total enthalpy and mass flow rate were specified at the inlet boundary condition.The outlet boundary condition was placed downstream from the exit of the exhaust hood.The averaged static pressure was set at the outlet boundary.Table 3 shows the detailed boundary flow condition.

Tab.3 Working condition of the computation model
3.5 Optimal result
The MSEGO algorithm is inserted in the design optimization platform, and the design optimization of a low-pressure exhaust hood with non-axisymmetric outer flow guider is performed.After optimization,the static pressure coefficient of optimal design increases from 0.165to0.618,which is2.84times higher than reference design.In addition,the computation of exhaust is expensive,for one sample,it needs 11hours for one calculation.In the optimization,although the number of initial samples is larger,the MSEGO algorithm only needs two iterations including 10 samples to find the optimal design.Meanwhile,due to parallel computation,MSEGO is more efficient for solving higher dimensional problems,expensive and black box problems.After optimization by MSEGO,the aerodynamic performance of exhaust hood improves significantly.
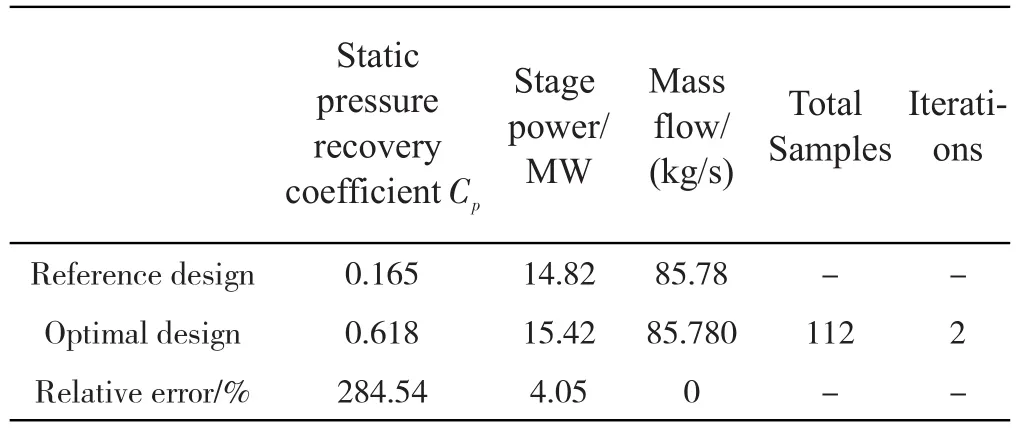
Tab.4 The overall performance comparison
4 Optimal Results Analysis
In this section,the detailed aerodynamic analysis for the optimization result is carried out as follows:First,the 3D profiles of the reference and the optimized exhaust hood are compared to analyze the shape features of the optimized exhaust hood.Figure 6 gives the 3D profile of inner flow guider and outer flow guider. The optimal design has non-axisymmetric outer flow guider, and the inner flow guider is much smoother.
Figure 7 gives the 2D profiles comparison.The width of the optimal exhaust hood increase significantly compared to the reference design,so it increases the flow area of the diffuser.Meanwhile,from 2D section profiles,the profiles of inner flow guider and outer flow guider are much smoother.Outer flow guider is a non-axisymmetric outer flow guider, which the flow channel of lower half is longer than upper half.It is helpful to organize the flow diffusing sleekly and to reduce the flow loss in the diffuser.

Fig.6 3D profile comparison of diffuser

Fig.7 2D profile comparison
Then,the detailed performance analysis of the reference and the optimized exhaust hood is compared to validate.The optimal result,which explains the reason of the improvement.The aerodynamic performance of the exhaust hood has an important influence on the capacity of the last stage.Figure 8(a)presents the pressure at the exit of last stage.The pressure of last stage decrease significantly compared to the reference design.It is beneficial to improve the overall turbine performance.Figure 8(b),(c),(d)show the static pressure distribution at different spans of rotor.After the optimization of the exhaust hood,it influences the aerodynamic performance of the last stage,especially at the trailing edge.At 5%span,the pressure of suction decreases after 90%Cax;at 50%span,the pressure of suction decreases after 70%Cax;at 95%span,the pressure of suction decreases between 0%~10%Cax and after 60%Cax.It indicates that the aerodynamic load increases.And according to output power,the optimal design increase 4.05%than reference.After optimization,the power capability of last stage increases and the aerodynamic performance of the last stage improves.
In order to analyses the aerodynamic performance of exhaust hood.Eq.(17)and Eq.(18)are the static pressure coefficient the total pressure coefficient expressions.


Fig.8 Pressure distribution
Where,PinandPt,inrepresent the averaged inlet static pressure and the averaged inlet total pressure in the exhaust hood respectively.PandPtrepresent the local static pressure and the local total pressure respectively.ρandνinrepresent the steam density and flow velocity at the exhaust hood inlet respectively.The static pressure coefficient represents the local static pressure recovery capability.The lager static pressure coefficient means the better static pressure recovery and the better aerodynamic performance.The total pressure coefficient represents the local total pressure loss.The larger total pressure coefficient means the more total pressure loss.
The exhaust hood diffuser is one of the most important components to affect the exhaust diffusion capability of the exhaust hood. The comparison of static pressure coefficient distribution on the exhaust hood diffuser wall between reference design and optimal design is provided in Figure 9. After optimization,the stagnation flow zone on the inner guider wall reduces.The static pressure on diffuser wall increase significantly.As for reason,the optimal design has the non-axisymmetric outer flow guider,in which the lower half is longer than the upper half.The profiles of flow guider are smoother especially the outlet width is wider.It increases the flow channel and the ratio of inlet and outlet area to improve the capacity of diffuser flow.
In order to analyses the inner flow in exhaust hood and indicate the reason of optimal design,we select four planes to give the static pressure coefficient distribution and surface streamlines.Figure 10 shows the location of four feature planes.
Figure 11 shows the streamlines and the total pressure coefficient contour distribution and at plane 1.The optimal design shows similar four vortices as reference expect for Vortex 1 and Vortex 5.In the upper half of optimal design,a new vortex(Vortex 1)appeared near the front wall,but the total pressure coefficient nearVortex 1 reduces than reference design.In reference design,the total pressure coefficient of high flow loss zones is near Vortex 2 and Vortex 3,it means that Vortex 2 and Vortex 3 are the main source of total pressure loss. After optimization,Vortex 2 and Vortex 3 are weakened significantly. Comparing with the lower half of exhaust hood,Vortex5disappears and the zone of back flow reduces after optimization.In all,the channel of lower half is longer than upper half in non-axisymmetric outer flow guider,so the diffuser flow zone increase.It improves diffuser flow.The overall total pressure coefficient of the optimal design is remarkably lower than that of the reference design.

Fig.9 Static pressure coefficient distribution on the exhaust hood diffuser wall
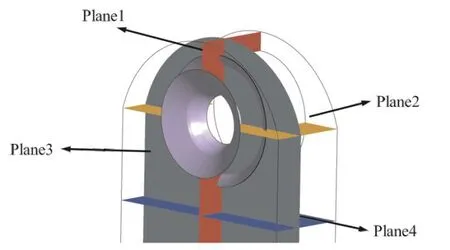
Fig.10 Typical planes location of the exhaust hood

Fig.11 Streamline and total pressure coefficient contour distribution at Plane 1
Figure 12 provides the total pressure coefficient contour distribution and streamline at plane 2.After optimization,though the vortex structure has no changed,Vortex 2 is significantly weakened.Hence,the total pressure loss of the optimal design is much lower than that of the reference design.According to design variables,this result is directly relative to the change of the outer flow guider height and the outer flow guider outlet angle after optimization.Moreover,due to non-axisymmetric design,the increase of the lower half outer flow guider height is unlimited to the upper half of volute.The increase of the diffuser outlet flow area is beneficial to improve the diffuser flow. The aerodynamic performance is improved.

Fig.12 Streamline and total pressure coefficient contour distribution at Plane 1
Figure 13 presents the total pressure coefficient contour distribution at the plane 3. For reference design, the flow loss of upper half outlet flow guider is more than that of lower upper half,and the flow loss of lower exhaust hood is lager. The threedimensional streamline in the exhaust volute is provided in Figure 14. The vortex system generated in upper half exhaust mixes to develop passage vortexes in lower half exhaust hood.Meanwhile,separation vortex develops in the lower half of diffuser.After optimization, non-axisymmetric outer flow guider increases the flow channel of lower half to improve diffuser flow.In addition,the optimal design increases the width of exhaust hood.So the interaction of passages vortexes at the both sides of volute is weakened and separation vortex nearly disappears.
Figure 15 shows the total pressure coefficient contour distributionand streamline at plane 4.According to Figure 15, it indicates that the interaction between two passage vortexes from both sides of the volute enhances the flow loss in the volute.After optimization,the outer hood width increases to increase the distance between the two vortices.It weakens the interaction between the two vortices. Although one side appears a new vortex,the flow loss is also low and the separation vortices disappear.Hence,the flow loss significantly decreases after optimization.The aerodynamic performance has improved.

Fig.13 Streamline and total pressure coefficient contour distribution at Plane 3

Fig.14 Streamline and total pressure coefficient contour distribution at Plane 3

Fig.15 Streamline and total pressure coefficient contour distribution at Plane 4
Finally, through detailed aerodynamic performance analysis,the optimal design has non-axisymmetric outer flow guider to improve the diffuser flow in exhaust hood. Moreover, the wider outer hood width of optimal design leads to reduces flow separation.
5 Data Mining
In order to explore design space and value the optimization,the analysis of variance(ANOVA)is used for the knowledge discovery of design space. The interactions among design variables and objective functions are detailed analyzed to validate the effectiveness of our developed aerodynamic design optimization method.
The detail expression of ANOVA is as follow[22].Let(x)denotes the estimated function value of the response surface,which obtained by Kriging model in this paper,x=[x1,x2,…xn]Tdenotes design variables,the total meana0and the total varianceδ2of(x)over the whole design space can be defined as:
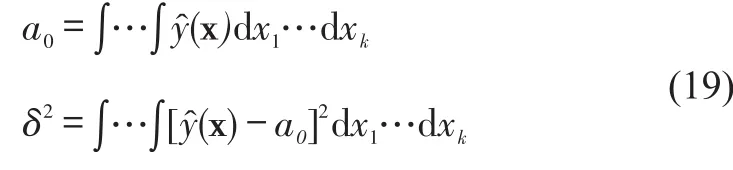
The effect ofxion(x)is usually broken down as follows:

Where,ai(xi)denotes the main effect ofenotes the related variance caused byxi.Similarly,anddenote the joint effect ofand the related variance,respectively.Usually,can quantitatively indicate the contributions of,are regarded as variance proportion.Thereby the significant variables are detected by variance proportion.Furthermore,the effect of design variablein a range can be represented according to the expressions aboutai(xi).
Firstly,the precision of the Kriging response surface is validated by ANOVA through cross validation[22]before the data mining process.Figure16 gives the results of cross validation plot,which shows that predict valuesand true valuesare distributed closely to the line.It indicates that these Kriging responses have good accuracy and validate the reliability of ANOVA.

Fig.16 Cross validation
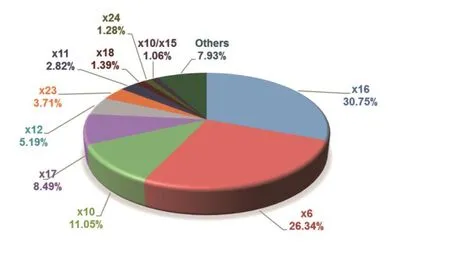
Fig.17 Variance proportion of significant design variables
Fig.17 presents the results of ANOVA analysis.When variance proportion is larger than1%or nearly1%,its main effect or joint effects are listed here and corresponding design variables are regarded as significant variables.Design variablesx16,x6,x10,x17,x12,x23,x11,x18andx24have significant effect on the aerodynamic performance.Among them,x6controls the outer hood half width.Due to non-axisymmetric outer flow guider design,x10andx16controls the width of exhaust diffuser outlet on main curve 1 and curve3;x11,x17andx23controls outer flow guiders height;x12,x18andx24controls outer flow guider outlet angle.The result of ANOVA indicates that the nonaxisymmetric design of outer flow guider and the width of exhaust hood are important for the design of exhaust hood.
Figure 18 presents the changing trends of the same significant variables for static pressure coefficient, which are selected by ANOVA. It is observed that the changing trends of variables is linear nearly expectx24.Especially,in this design space,the static pressure coefficient will increase when the outer hood half width(x6)increases and outer flow guiders height increases(x11,x17,x23).For controls outer flow guider outlet angle(x12,x18,x24),the change of the static pressure coefficient is different.This result is consistent with the aerodynamic analysis.So ANOVA validates the effectiveness of design optimization method.

Fig.18 Main effects of critical performance indicators
ANOVA can give the changing trend of every variable is obtained.The best value of every variable for objective function can be achieved from Figure 18.Thus,through ANOVA analysis,one optimal design can be offered by setting every variable as the best value.Finally,we obtain the geometry profile of this optimal design by parameterization method and compute aerodynamic performance by CFD. In Table 5, it compares optimal design obtained by ANOVA and reference design.Although the static pressure coefficient of ANOVA-based design a littler lower than optimal design,it is increases by 271.52%comparing with reference design.It indicated ANOVA can not only explore interactions between design variables and objective function,but also predict one optimal design roughly.
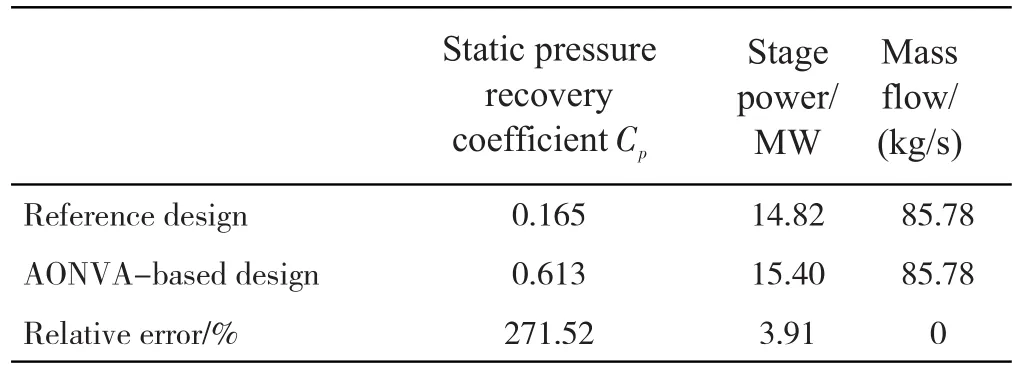
Tab.5 The overall performance comparison
6 Conclusion
A meta model-based design optimization and data mining method is proposed and programed by integrating the MSEGO algorithm,data mining techniques of ANOVA,3D parameterization method with non-axisymmetric outer flow guider,and RANS solver technique,which is applied in the aerodynamic optimization of a low pressure exhaust hood.The following conclusions are obtained:
1)A modified EGO algorithm named Multi-Point Search based Efficient Global Optimization(MSEGO)is proposed.Combined MSEGO,the aerodynamic optimization platform for the low pressure exhaust hood is established. The static pressure recovery coefficient of the optimal design is increased by 272.73%with respect to that of the reference design.Meanwhile,the output power of the last turbine stage is increased by 4.05%.
2)Optimal design has non-axisymmetric outer flow guider and the wider exhaust hood diffuser width,which can im-prove the diffuser flow.Detailed aerodynamic analysis indicates that the improvement of aerodynamic performance of the optimal design is mainly due to the improvement of the static pressure recovery capability of exhaust diffuser and the reduction of total pressure loss in exhaust volute; and the lower static pressure at the rotor blade outlet resulted by the improvement of the aerodynamic performance of the exhaust hood. It is benefiical to improve the efficiency of the overall turbine.
3)The data mining technique of ANOVA is used to explore the effects of design variables on aerodynamic performance.The data mining result is consistent with aerodynamic analysis,which indicate that the width of exhaust hood diffuser outlet,the outer flow guider height and the outer flow guider outlet angle have the most significant effects on the aerodynamic performance of the exhaust hood.It validates the effectiveness of design optimization and provide more design information.
