Investigation of TLP's hydrodynamic response with different tendon connection angles
2018-09-19YangYuAaronHardowarJianxingYuShuaiHaoXiaodongGaoa
Yang Yu, Aaron Hardowar, Jianxing Yu,*, Shuai Hao, Xiaodong Gaoa
b Collaborative Innovation Center for Advanced Ship and Deep-Sea Exploration, Shanghai 200240, China
Keywords:Tendon connection Irregular waves Regular waves Pitch Yaw
ABSTRACT This paper aims to investigate the hydrodynamic behavior of a tension leg platform (TLP) when the tendon connection angles are varied at 90°, 70°, 50°, and 30°. Three different types of loading conditions are applied to the TLP. Conditions include 100-year hurricane storm period, regular waves and no loading. The TLP displayed major response in the pitch degree of freedom. A maximum reduction of 14% in pitch rotation is achieved when 100-year hurricane storm conditions are applied to the TLP. This occurred in 0° loadings at 30° tendon connection angle as compared to 90° tendon connection angle. Reduction in pitch rotation is also achieved in the regular wave loadings. A maximum of 9% in pitch rotation is achieved during 0° wave loading at 30° tendon connection angle as compared to 90°. When the tendon connection angle is reduced from 90° to 30°, the natural frequency of the TLP increased both in pitch and yaw degrees of freedom by 2.55% and 2.40%, respectively.
As time moves on and the days become more advanced, the needs for deep water explorations cannot be ignored. Moving from shallow waters to deep waters increases complications in ocean structures. Deep water structures now have to adapt to water depth while withstanding terrain conditions such as waves, current and wind. Tension leg platforms (TLPs) have since proven efficient to stand in the gap to satisfy these demands.
Numerous researches were done on the hydrodynamic forces acting on platforms in deep sea along with responding behaviors of these structures. Tabeshpour et al. [1] investigated the dynamic analysis of TLP in both time and frequency domains.The time history of random wave was generated based on Pierson–Moskowitz spectrum and acted on the structure in arbitrary direction. The hydrodynamic forces were calculated using the modified Morison equation according to Airy's linear wave theory. The power spectral densities (PSDs) of displacements, velocities and accelerations were calculated from nonlinear responses. Also, numerical simulations were conducted by the method of nonlinear time domain coupled analysis on a scaled model by Zhu and Ou [2]. The platform motion and mooring forces subjected to wind and waves were investigated.The experimental analysis was compared to numerical analysis.The results indicated that the numerically simulated mooring forces agree well with the experimental results in static equivalent field, but show some difference in dynamic equivalent field;the numerically simulated platform motions coincided well with the experimental results. Chandrasekaran et al. [3] investigated the reduction in hydrodynamic responses by implementing perforated members to the tension leg platform’s columns subjected to wave forces. The findings of this research proved successful. It was seen that there was a significant reduction in the dynamic response of the TLP with the perforated columns. The response reduction was attributed to the increased viscous damping and added mass effects due to the presence of perforated members. Also, significant reduction in tether tension variations of TLP with perforated members found to improve safety against pullout since it reduced tension in the tethers. Li et al. [4] conducted similar dynamic response studies to investigate the response of different floating platform in the South China Sea.They conducted analysis on three different types of floating platform, semi-submersible, TLP, and spar, to investigate and compare their dynamic and global response. The researchers conducted their analyses on created hydrodynamic models using the three-dimensional (3D) potential theory. Gu et al. [5] investigated hydrodynamic responses of a TLP using mathematical methods. Chodnekar and Mandal [6] used modern software,ANSYS Workbench 14.5 to analyze the hydrodynamic response of a TLP floating offshore wind turbine (FOWT). Kurian et al. [7]conducted experiments in a TLP model to investigate the hydrodynamic response. The platform motions were measured using accelerometers and the tether tensions were measured using specially developed load cells. Soylemez and Yılmaz [8] used numerical methods to obtain hydrodynamic response data for the design of a tension leg platform to operate in the north-east of the Marmara Sea. Comparisons between the designs with two different drafts and the results of their spectral analysis were presented. With decreased draft of the platform, surge responses increased in the low frequency region. Since the differences between the surge responses of two different designs are not signi fi cant, the shorter platform was adopted for the location due to its low cost. Latif and Naeem Shah [9] conducted a study for the design of a tension leg platform column to operate in the Aribian Sea. After analyzing the structure, it was concluded that the offshore column design was safe for particular sea state.
The tension leg platform presented in this paper was adopted from the investigation done by Taylor and Jefferys [10].
The platform is symmetrical in geometry and consists of a deck supported by four simple vertical cylinders connected by pontoons. There are eight mooring tendons which are used to anchor the platform to the sea bed. Each column consists of two mooring tendons each. Figures 1 and 2 show the geometry of the tension leg platform presented in this research.
Four models are presented and compared. In model 1, the tendons are arranged at 90° to each other as seen in Fig. 3a. The responses for surge, pitch and yaw are calculated and presented.Responses in heave, sway and roll are not necessary in this research. There is no change in heave responses since this is a vertical response and changing the tendon connection angles will have little or no effect on vertical responses. In addition, sway and roll responses will reflect surge and pitch responses at a perpendicular hydrodynamic loading angle. The same calculations are done for the other three models, 2, 3, and 4 with tendon angles of 70°, 50°, and 30° respectively as shown in Fig. 3b-d. The analysis is done for 100-year hurricane storm period loadings with 0°, 22.5°, and 45° approach angles.
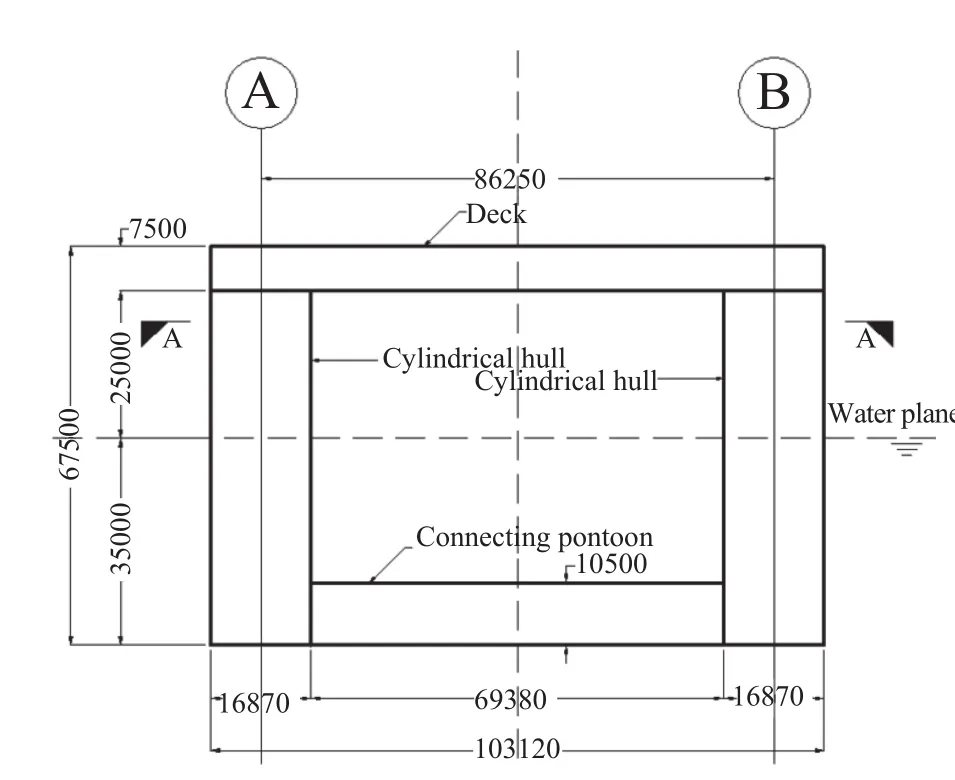
Fig. 1. Side elevation of platform (unit: mm).
In addition, a second set of analyses is done, repeating the same steps as mentioned above. In these analyses, the TLP is subjected to regular waves only. The results of pitch from these analyses are compared to the results of pitch obtained from the previous analyses to understand if similar response patterns are achieved. Only pitch response results are chosen to be compared because this is the only degree of freedom that displayed tangible reaction towards the changing of the tendon connection angles.
The design parameters used to model the TLP are displayed in Table 1 below and the design parameters used to model the tendon are displayed in Table 2 below.
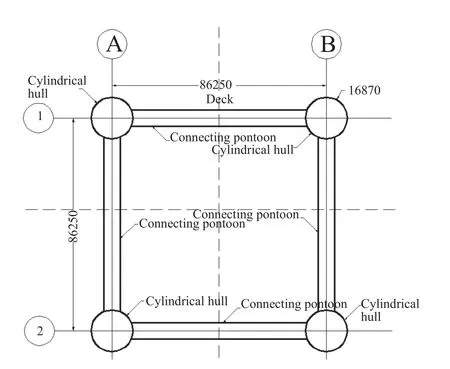
Fig. 2. Cross section A-A of the platform in Fig. 1 (unit: mm).
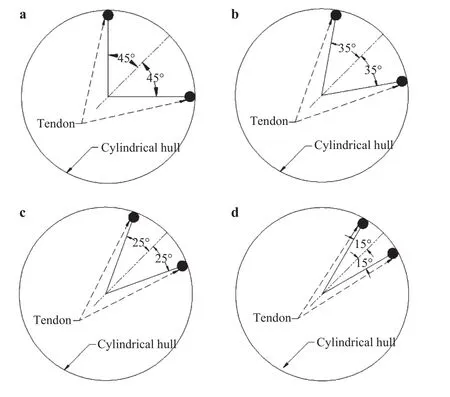
Fig. 3. Two tendons arranged at different angle under one vertical cylinder: a 90°, b 70°, c 50°, d 30°.
The present analysis is done in the time domain parameters.It uses the direct numerical integration of equations of motions including various kinds of system nonlinearities. The following equation describes the equation of motion for a fully coupled nonlinear model of a tension leg platform.

where x is the six degrees of motion, surge, sway, heave, pitch,roll, and yaw. The upper dot represents their velocity and upper double dot represents their acceleration. is the system mass matrix andis the system stiffness matrix.is the equivalent added mass of the hull at infinite frequency.C(,t) representsthe implicit time and motion dependent stiffness matrix from coupling tendon dynamics with the tension leg platform motion.represents the first and second order wave exiting forces.represents the radiation damping force, wherethe retardation function from radiation damping coefficient .represents the viscous force on Morison members of Hull, whereCDis the coefficient due to drag,Ais the surface area of the hull Morison member,
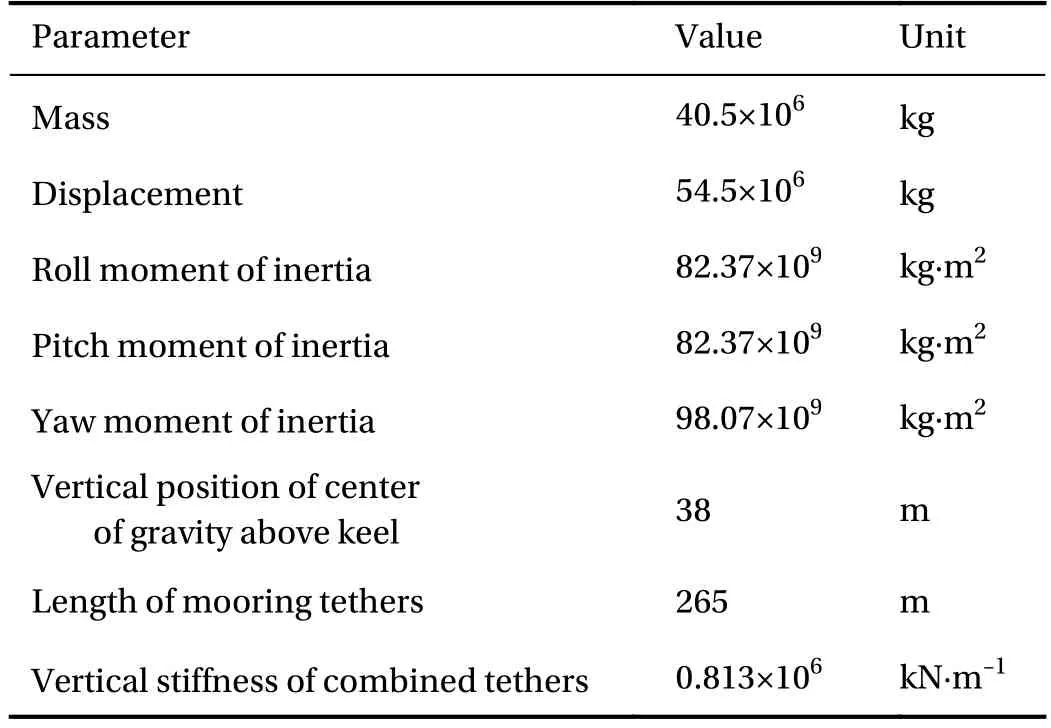
Table 1 Structural data for tension leg platform.
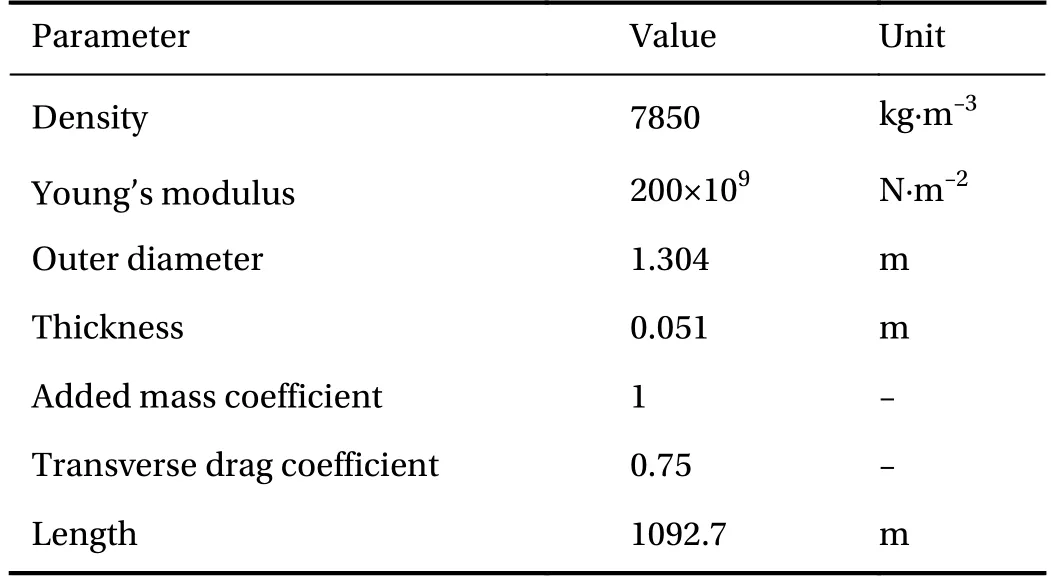
Table 2 Design parameters used to model tendons.
nis the fluid particle velocity normal to the member, and˙nrepresents the normal velocity of the Morison member.wind(t)represents the dynamic wind loading induced on the tension leg platform.represents the motion and time dependent forces from coupling the tendon/riser dynamics with the tension leg platform's motion.
The environmental conditions were adopted from a study by Yang and Kim [11] where they investigated the transient effects of tendon disconnection of a TLP. The environmental conditions modeled data from the Gulf of Mexico after the Hurricane Katrina catastrophe. For this research, the 100-year post-Katrina environmental criteria will be adopted. Wind, wave and current loadings are applied to the TLP in the same direction to achieve extreme loading scenario. The wave type analysis used is the JOHNSWAP wave type. Details of the wave, wind and current data can be seen in Table 3. From the regular wave analyses, the same amplitude and period are used from Table 3 to define the wave parameters.
At 0° loading angle, the calculations reveal a reduction in pitch response (RY) of the TLP as the tendon connection angle varies from 90° to 30°. It should be noted that pitch response follows similar time history pattern for all tendon connection angles. The maximum pitch response is observed in a similar time region and is considered as the basis for these findings. In Fig. 4, responses for 70°, 50°, and 30° are compared to responses obtained at 90° tendon angle connection. It is found that at 70°tendon angle connection; there is a 6% reduction in pitch. At 50°there is 10% reduction, and at 30° there is a 14% reduction. Results are shown in Table 4 below.
Therefore, from the calculations, it can be see that by reducing the tendon angle connection from 90° to 30°, the maximum pitch response can be reduced by 14% while the TLP experiences loadings at 0° angle. The average maximum pitch rotation observed is 0.1175°. Results are displayed in Table 4.
The yaw responses (RZ) remained similar throughout the varying of tendon angles from 90° to 30°. The response is quite miniscule and can be considered as null. The maximum averageresponse is just under 0.009°. Results are presented in Table 4.

Table 3 100-year hurricane environmental conditions.
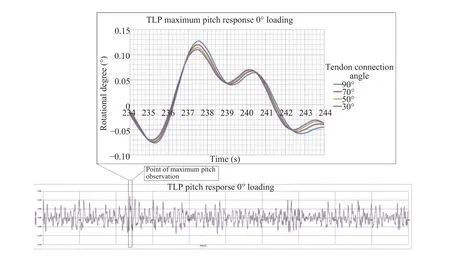
Fig. 4. Graphical representation of maximum pitch response at 0°approach wave angle.
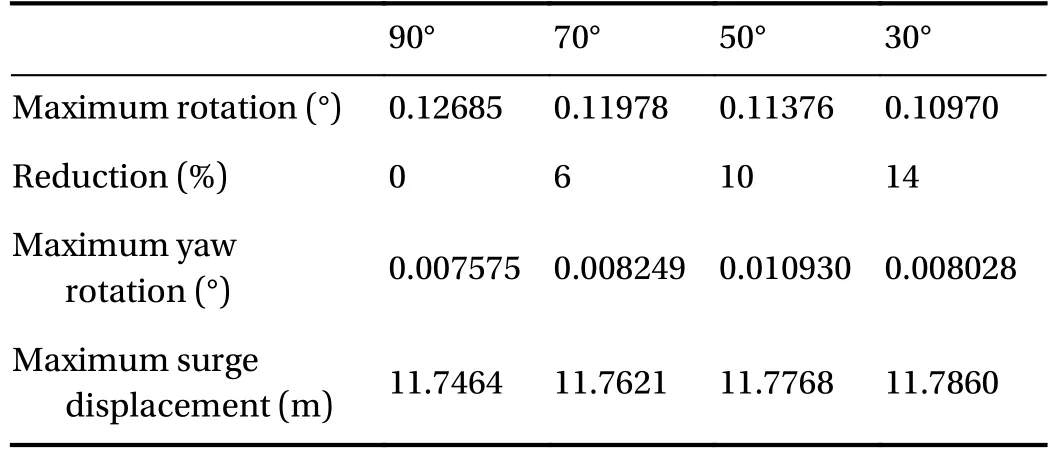
Table 4 Results for maximum response at 0° loading angle.
Similarly to sway response, the surge response (X) is not affected by the change in tendon angle connection. Changes observed are miniscule and considered null. The maximum average response is calculated to be 11.76 m. Maximum displacements for surge response can be seen in Table 4.
At 22.5° loading, the calculations for the TLP’s hydrodynamic response also reveal a reduction in pitch response (RY) when the tendon angle connection is varied from 90° through 30°. Similarly, as with pitch response at 0° loading, the pitch response here follows similar time history pattern for all tendon connection angles. The maximum response is also observed in a similar time region. In Fig. 5, similarly as before, responses for 70°, 50°,and 30° tendon angles are compared to the responses for 90°tendon angle. It is clear that, at 70° tendon angle, the TLP experiences a reduction in pitch response by 3%. At 50°, there is a 7%reduction and at 30° there is a 10% reduction.
Results are shown in Table 5 below. From the calculation, it is evident that a maximum pitch response reduction of 10% is achieved by reducing the tendon angle connection from 90° to 30° at 22.5° loading angle. The maximum average pitch rotation observed is 0.1322°.
The yaw responses (RZ) remains similar throughout the varying of tendon angles from 90° to 30°. The change in response is quite miniscule and is considered as null. The maximum average response is 1.547°. See Table 5 from yaw response results.
Similarly to the yaw response, the surge response (X) is not affected by the change in tendon angle connection. Changes observed are miniscule and considered null. Maximum average surge response is calculated to be 10.34 m. See Table 5 for surge response results.
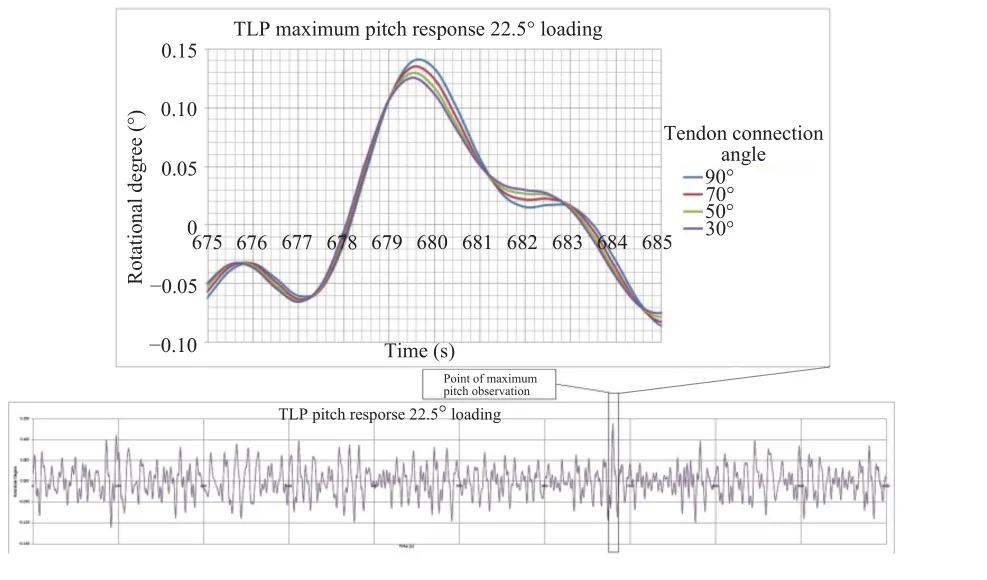
Fig. 5. Graphical representation of maximum pitch response at 22.5° loading angle.
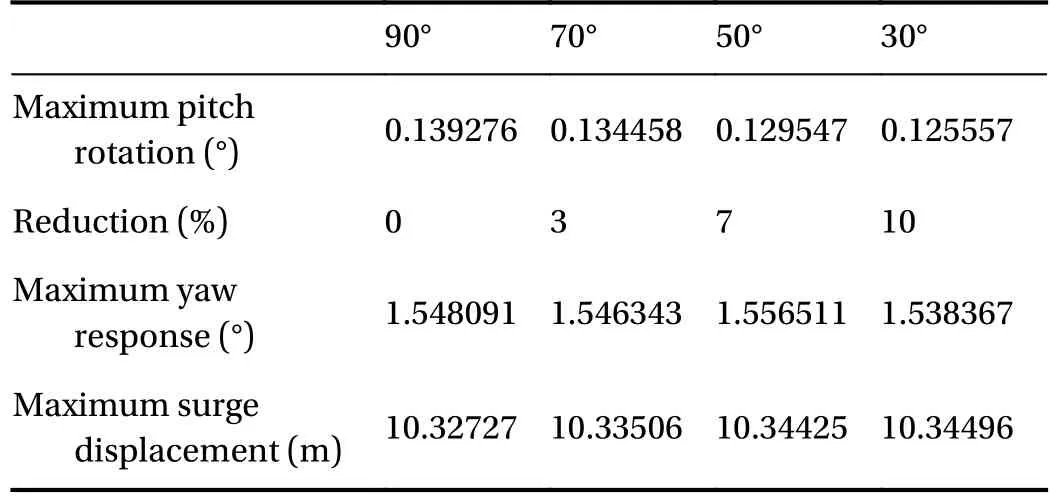
Table 5 Results of maximum response at 22.5° loading angle.
At 45° loading, the calculations for the TLP's hydrodynamic response also reveal a reduction in pitch response (RY) when the tendon angle connection is varied from 90° through 30°. Similarly, as with pitch response at 0° loading and 22.5° loading, the pitch response here follows similar time history pattern for all tendon connections angle. The maximum response is also observed in a similar time region. In Fig. 6, similarly as before, responses for 70°, 50°, and 30° tendon angles are compared to the responses for 90° tendon angle connection. It is evident that, at 70° tendon angle, the TLP experiences a reduction in pitch response by 1%. At 50°, there is a 2% reduction and at 30° there is a 3% reduction. Results are shown in Table 6 below. From the calculation, it is evident that a maximum pitch response reduction of 3% is achieved by reducing the tendon angle connection from 90° to 30° at 45° loading angle. The maximum average pitch rotation observed is 0.1278°.
Once again the yaw responses (RZ) did not have any tangible variation when tendon angle connections are varied from 90°through 30°. The changes in rotation are petite and not considered tangible. The maximum average response is 0.01151°.See Table 6 for rotational results in yaw motion.
As with the yaw response, the surge response (X) is not affected by the change in tendon angle connection from 90°through 30°. Once again, changes are minor and considered not tangible for the motives of this research. The maximum average displacement that is observed in the surge degree of freedom is 7.8274 m. See Table 6 for displacement results in surge motion.
It is quite clear that the method of changing the angles of the tendon connection affects the pitch response positively. Presented below are comparison analyses done for the pitch response of the different tendon angles at different loading angles.
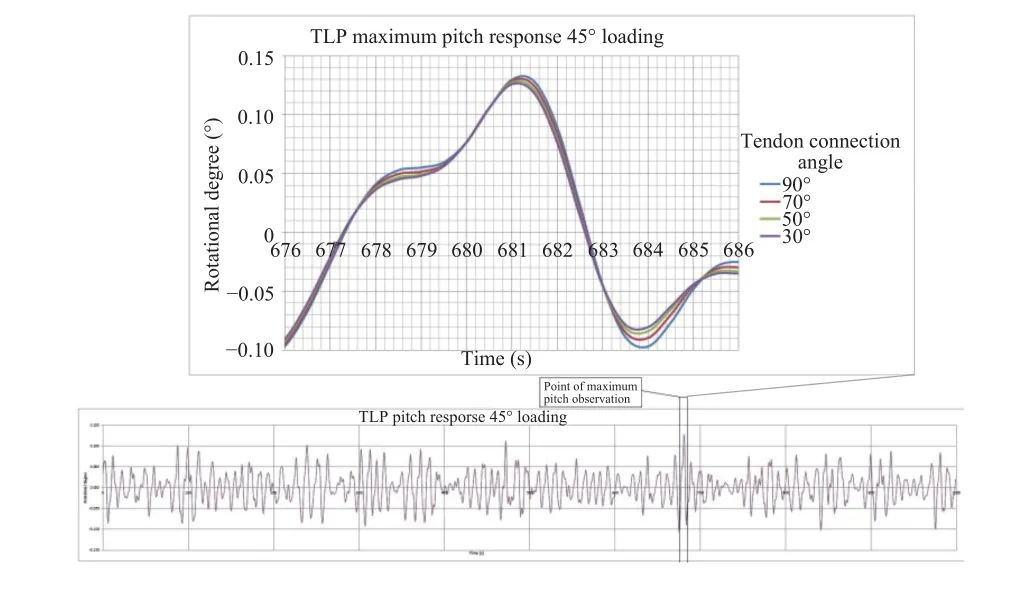
Fig. 6. Graphical representation of maximum pitch response at 45°loading angle.
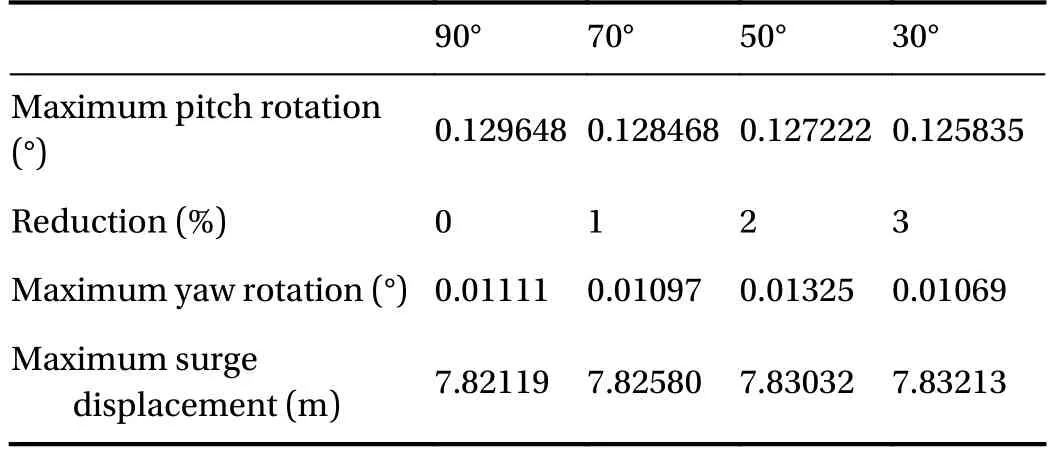
Table 6 Results of maximum response at 45° loading angle.
① The pitch response is reduced as the tendon angle connection reduces from 90° to 30° for all loading angles in Fig. 7.
② Response increases when loading angle is increased from 0°to 22.5° and then reduces when loading angle increases to 45°,except for when the tendon angles are connected at 30°. At this connection, the two responses are almost similar. The response at 45° loading remains greater than the response at 0° loading in all tendon angle variations in Fig. 7.
Regular waves are applied to the TLP to analyze and compare its reaction, in the pitch response, to its reaction in the 100-year storm period conditions. In this analysis, the only hydrodynamic loadings applied to the TLP are the regular waves.Wind and current loadings are not applied.
Under basic regular wave conditions, at 0° wave loading, the TLP displays variation in pitch response as the tendon angles varies from 90° through 30°. Similarly as before, responses for 70°, 50°, and 30° tendon angles are compared to the responses for 90° tendon angle connections. When tendon angle connection is reduced from 90° to 70°, the response reduces by 4%. As the tendon angle connection is reduced to 50°, the response is also reduced by 7%. Finally, at a tendon connection angle is reduced to 30°, the pitch response is reduced by 9%. From reducing the tendon connection angle from 90° to 30°, the pitch response is reduced by a total of 9%. Results are displayed in Table 7 and can be seen in Fig. 8.
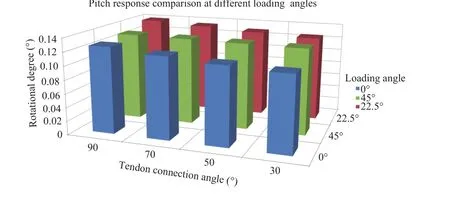
Fig. 7. Comparison of pitch response at different loading angles.
Likewise, as before, with 22.5° wave loading angle, the TLP displays variation in pitch response as the tendon angles varies from 90° through 30°. Once again, responses for 70°, 50°, and 30°tendon angles are compared to the responses for 90° tendon angle connections. When tendon angle connection is reduced from 90° to 70°, the response reduces by 3%. As the tendon angle connection is reduced to 50°, the response is also reduced by 5%.Finally, at a tendon connection angle of 30°, the pitch is reduced by 7%. From reducing the tendon connection angle from 90° to 30°, the pitch response is reduced by a total of 7%. Results are displayed in Table 7 and can be seen in Fig. 9.
Similar analyses are done for the various pitch responses resulting from variation of tendon angle connections from 90°through 30° at 45° loading angle. Once again, the reduction continues to increase as the tendon angle connection reduces.When reduced from 90° to 70°, a 3% reduction is achieved. When reduced to 50°, a 5% reduction is achieved and when reduced to 30°, a 6% reduction is achieved. Therefore, by reducing the tendon connection angle from 90° to 30°, the pitch response is reduced by 6%. Results are displayed in Table 7 and can be seen in Fig. 10.
It is evident when the TLP undergoes regular wave loadings,the pitch response decreases as the tendon angle connection decreases. Presented below are the comparisons observed in pitch motion as the tendon connection angles are varied through 90°to 30° under three directions of regular wave loading 0°, 22.5°,and 45°.
① The responses in pitch motion are reduced for all wave angle approach as the tendon angle reduces from 90° to 30° in Fig. 11.
② For each wave angle approach, the greatest pitch response is observed for head waves, and the least is observed for waves approaching at 45° in Fig. 11.

Table 7 Results for maximum pitch response under regular wave loading.
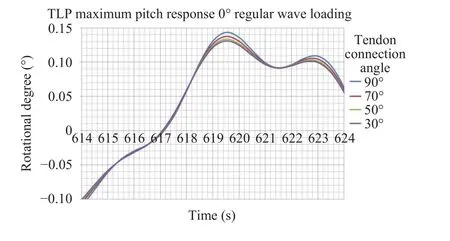
Fig. 8. Graphical representation of maximum pitch response at 0°regular wave loading.
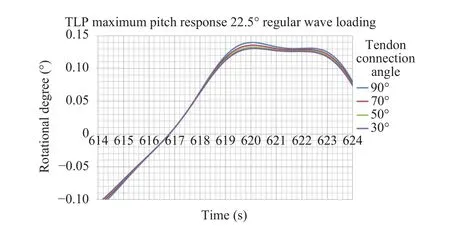
Fig. 9. Graphical representation of maximum pitch response at 22.5° regular wave loading.
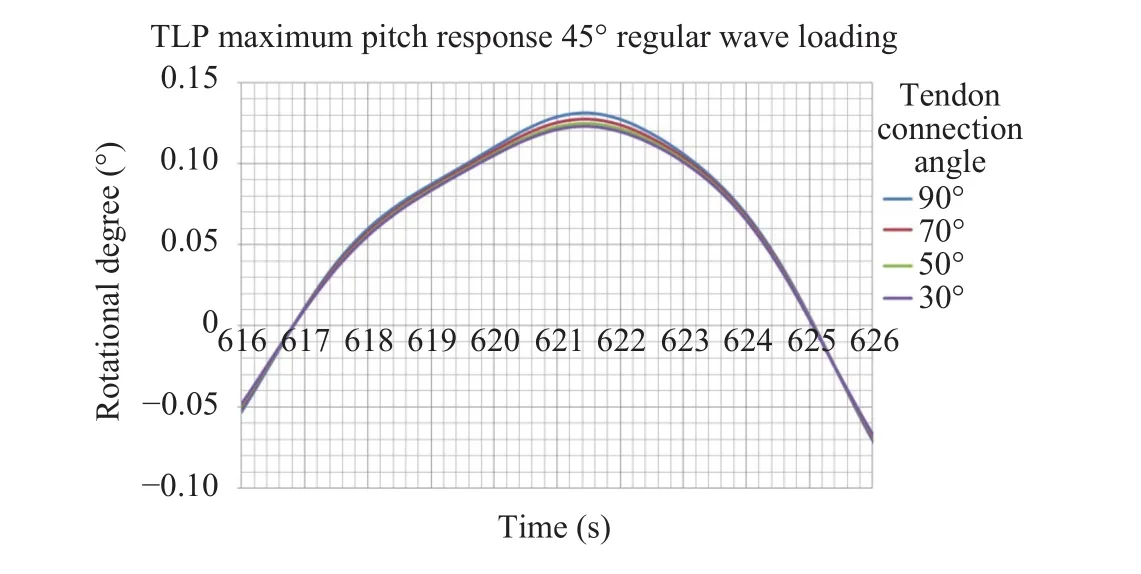
Fig. 10. Graphical representation of maximum pitch response at 45° regular wave loading.
③ As the tendon angle connection decreases, the variations of pitch reduction with respect to wave approach angle also decreases. This comparison is evident in the bar graph depicted in Fig. 11.
The natural motion of the tension leg platform is analyzed and the natural frequency is measured. The analysis is done for pitch, surge and yaw degree of freedoms. The natural motion of the tension leg platform at tendon connection angles of 90°through 30° is modeled and the natural periods are measured.From the following relationship:

wherefis natural frequency andTis natural period, the natural frequency for each response is calculated and compared.
Figure 12 shows the natural periods for pitch response at tendon connection angles 90° through 30°.
An initial displacement rotation of 0.1° is applied to the TLP model and the natural motion is observed for a 70 s time span.The first period is used to calculate the natural frequency of the pitch motion.
It is observed that the natural period reduces as the tendon connection angle reduces in Table 8 below for results. By reducing the tendon connection angle, the natural frequency of the TLP increases hence, adapting the capability to returning to its rest position at a faster rate.
There is no significant variance in the natural motion of the TLP in the surge degree of freedom. The natural period () observed is 210 s and the natural frequency () is 0.005. This remains the same for each response at different tendon angle connection as seen in Fig. 13.
Similarly to the pitch response, the natural motion in the yaw response displays variance as the tendon connection angles are variated. Figure 14 shows the natural response for the yaw degree of freedom for variation of tendon connection angle from 90° through 30°.
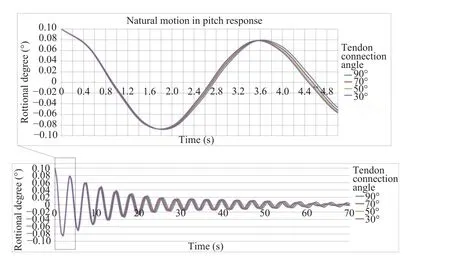
Fig. 12. Results of natural period for pitch response.

Table 8 Results of natural period (T ) and natural frequency (f) for pitch response.
The TLP is offset at a 0.3° rotation about the yaw degree of freedom and its natural motion is observed over a 500 s period as seen in Fig. 15. The first natural period is used to analyze the natural frequency about the yaw degree of freedom.
It is observed that the natural period reduces as the tendon connection angle reduces in Table 9 below for results. By reducing the tendon connection angle, the natural frequency about the yaw degree of freedom increases, giving the TLP the ability to return to its rest position at a faster rate.connection angle mostly in the pitch degree of freedom. No significant changes are observed in surge and yaw degree of freedoms. Motions about sway, roll and heave degree of freedoms are not analyzed in this research. The following findings are found:

Fig. 13. Results of natural period for surge response.
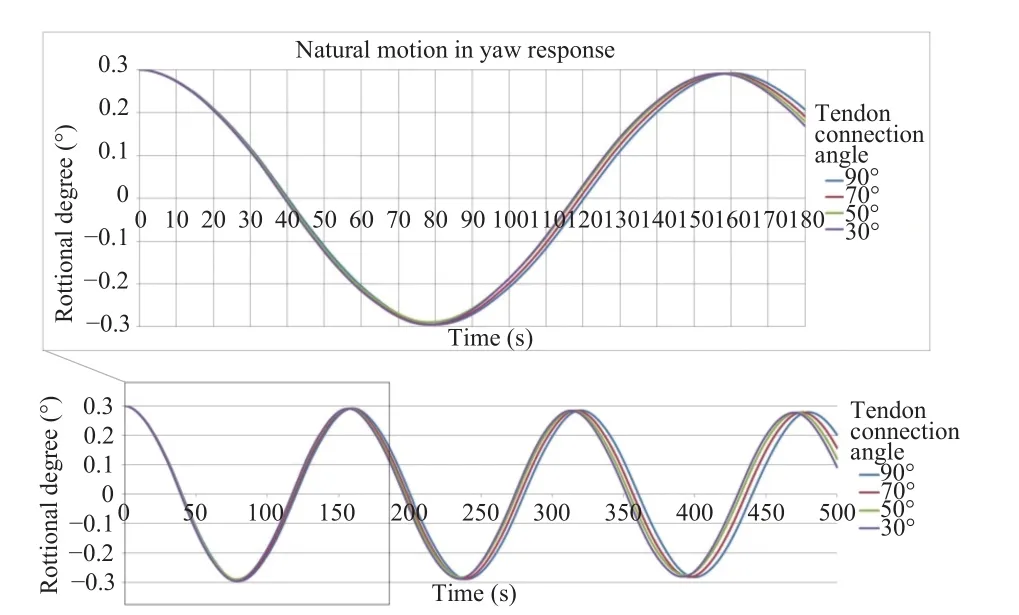
Fig. 14. Results of natural period for yaw response.The TLP displays sensitivity to the variance of the tendon

Table 9 Results of natural period (T ) and natural frequency (f) for yaw response.
① A reduction in pitch motion of 14%, 10%, and 3% is achieved when the tendon connection angles are reduced from 90° to 30°in 100-year storm criteria conditions approaching the TLP at 0°,22.5°, and 45°, respectively.
② A reduction in pitch motion of 9%, 7%, and 6% is achieved when the tendon connection angles are reduced from 90° to 30°in regular wave conditions only approaching the TLP at 0°, 22.5°,and 45°, respectively.
③ Responses in yaw and surge remain similar indicating that the reduction in tendon connection angles does not affect the TLP in any way with respect to these degrees of freedoms.
④ The natural pitch motion of the TLP experiences an increase in natural frequency as the tendon connection angle is reduced from 90° to 30°. The natural frequency increases from 0.275 to 0.282, accounting for a 2.55% increase in natural frequency.
⑤ The natural yaw motion of the TLP also experiences an increase in natural frequency as the tendon connection angle is reduced from 90° to 30°. The natural frequency increases from 0.00625 to 0.00640, accounting for a 2.40% increase in natural frequency.
⑥ The natural surge motion of the TLP does not experience any change in motion as the tendon connection angles are variated.Reduction of the tendon connection angle is proven to be efficient for the tension leg platform. It does not affect the normal motions of the platform in heave, surge, sway, and roll motions.However, it reduces rotational motion in the pitch degree of freedom and, in turn, increases natural frequencies in both pitch and yaw degree of freedoms.
Acknowledgements
The authors would like to thank Prof. Yu and his team for their support. The project was supported by the National Basic Research Program of China (Grant 2014CB046803), the National Natural Science Foundation of China for Youth (Grant 51609169), the National Natural Science Foundation of China(Grant 51779173).
杂志排行
Theoretical & Applied Mechanics Letters的其它文章
- Estimation of the effective properties of two-dimensional cellular materials:a review
- A data-based CR-FPK method for nonlinear structural dynamic systems
- Collinear micro-shear-bands model for grain-size and precipitate-size effects on the yield strength
- On the interaction between bubbles and the free surface with high density ratio 3D lattice Boltzmann method
- Principal and internal resonance of rectangular conductive thin plate in transverse magnetic field
- Piezoelectric energy harvesting from flexible delta wings
