On the trajectory of nonturbulent liquid jets in subsonic crossflows at different density ratios
2018-09-19MehdiJadidiAliDolatabadi
Mehdi Jadidi*, Ali Dolatabadi
Department of Mechanical, Industrial and Aerospace Engineering, Concordia University, Montreal H3G 1M8, Canada
Keywords:Primary breakup Liquid jet Density ratio Gaseous crossflow Spray trajectory
A B S T R A C T Numerical simulations using volume of fluid (VOF) method are performed to study the impact of liquid-to-gas density ratio on the trajectory of nonturbulent liquid jets in gaseous crossflows. In this paper, large eddy simulation (LES) turbulence model is coupled with the VOF method to describe the turbulence effects accurately. In addition, dynamic adaptive mesh refinement method with two refinement levels is applied to refine the size of the cells located at gas-liquid interface. Density ratio is changed from 10 to 5000 while other nondimensional numbers are kept constant. Large density ratios are considered in this paper since they are common in many practical applications such as solution precursor/suspension plasma sprays. Our simulations show that the penetration height, especially in the farfield, increases as the density ratio increases. A general correlation for the jet trajectory, which can be used for a wide range of density ratios, is developed based on our simulation results.
Breakup of liquid jet in a subsonic gaseous crossflow (LJIC)has various applications, for instance, in gas turbines, ramjets,augmentors, and thermal sprays [1-7]. It is a complex process that has been widely investigated experimentally and numerically over the past decades. Five non-dimensional numbers named as momentum flux ratio (q = ρjUj2/(ρcUc2)), crossflow Weber number (We= ρcUc2d/σ), liquid-to-crossflow density ratio (ρj/ρc), liquid Reynolds number (R ej= ρjUjd/μj), and crossflow Reynolds number (Rec= ρcUcd/μc), or viscosity ratio(μj/μc) have been defined to study the behavior of liquid jet in a crossflow [4, 8-10]. Here, ρ is density, U is velocity, d is liquid orifice diameter, σ is surface tension, μ is viscosity, and indexesj
and c stand for the jet and crossflow, respectively. In the present study, the effect of liquid-to-gas density ratio on windward jet trajectory, while other non-dimensional numbers are fixed, is investigated. In general, the density ratio strongly depends on the operating conditions and can change from small to very high numbers:
① 10 < ρj/ρc< 1000: liquid jet injected into high pressure gaseous crossflows (e.g. in gas turbine operating conditions ρj/ρc≈ 100);
② ρj/ρc≈ 1000: liquid jet injected into gaseous crossflows at normal temperature and pressure (NTP) condition;
③ 1000 < ρj/ρc< 100000: liquid jet injected into hightemperature atmospheric gaseous crossflows (e.g. in suspension and solution precursor plasma sprays which are used for generating fine micro-structured coatings) [9-15].
Most studies have focused on the trajectory of a liquid jet in a gaseous crossflow under NTP condition (≈ 1000) [1-3, 16-19]. Generally, under NTP condition, the jet trajectory is a strong function of the liquid-to-gas momentum flux ratio and the distance in the crossflow direction from the injector. Regarding liquid jet in high-pressure crossflow (10 << 1000), it is also demonstrated by a few experimental and numerical studies that the density ratio change does not alter the jet trajectory noticeably and the main parameters that control the jet trajectory are momentum flux ratio and the distance in the crossflow direction.For instance, Elshamy and Jeng [20] and Elshamy et al. [21] experimentally showed that increasing the gas pressure causes the jet trajectory to decrease slightly. In addition, Song et al. [22] and Eslamian et al. [23] reported that as the gas pressure increases the jet trajectory does not change significantly. Herrmann et al.[9] numerically studied the impact of density ratio on turbulent liquid jet in crossflow atomization. In their simulations,We,q,Rej, andRecwere fixed, and the density ratio was changed from 10 to 100. It was found that the increase in density ratio causes a slight increase in the jet penetration in both the jet and transverse directions. Li and Soteriou [10] also numerically studied the influence of density ratio on nonturbulent liquid jet in crossflow atomization (noting that, the nonturbulent liquid jet can be obtained from supercavitating nozzles or nozzles with a small length/diameter ratio [16, 17]). They fixed We, q, Rejand the liquid-to-gas viscosity ratio while the density ratio was increased from 1.7 to 845. They found that the jet trajectory is not significantly affected by the change of density ratio.
Although the liquid jet breakup in high-pressure crossflows(i.e. low density ratio cases) is studied well, the atomization of liquid jets in high-temperature atmospheric crossflows such as thermal plasmas (i.e. high density ratio cases) have not been understood so far [13]. It is worth mentioning that performing experimental studies and atomization tests in plasma crossflows is challenging due to plasma radiation intensity, plasma temperature, gas flow nonuniformity and oscillations, and etc., and the uncertainty of the results is high [13, 18]. To the best of our knowledge, there is no empirical and theoretical correlations in the literature to estimate the liquid jet trajectory in thermal plasma crossflows or in very high density ratio conditions. It should be noted that this correlation would be useful to the field of thermal sprays to control the deposition efficiency and improve the coatings quality.
At least two questions arise based on the literature: is the effect of density ratio on the jet trajectory always insignificant? If not, can a correlation be developed to estimate the jet trajectory in a wide range of density ratios, particularly at very high density ratio conditions? To answer these questions, the jet trajectory at different density ratio conditions should be numerically studied.We perform simulations, similar to the cases presented by Herrmann et al. [8, 9], where We, q, Rej, and Recare kept constant and the density ratio is independently changed. However, instead of implementing turbulent velocity profile at the orifice,plug-flow velocity profile is used. In this case, liquid atomization due to aerodynamic forces is focused and the effects of liquid turbulence and density ratio on the jet penetration and column structure would not be overlapped. In the following, numerical method and computational configuration (grid size, boundary conditions, and input values) as well as several qualitative and quantitative presentations of the breakup features are described.
In this study, the incompressible volume of fluid (VOF) solver in OpenFOAM version 1.7.1, which is a computational fluid dynamics (CFD) open source solver library [24], is used to model the primary breakup of the liquid jet in gaseous crossflow at different density ratios. It should be noted that, the benchmark tests show that VOF solver in OpenFOAM can properly simulate flows with high density ratios [25]. The momentum and volume fraction () conservation equations solved in the mentioned VOF model are given below:
Momentum equation

Volume fraction equation

where U is the velocity vector, t is time, p is pressure, and κ is the free surface curvature. The function α represents the volume fraction of the cell occupied by liquid. In other words, α = 0,0 < α < 1, and α = 1 correspond to a cell full of gas, a surface cell(i.e. the interface location), and a cell full of liquid, respectively.The free surface curvature is computed from the volume fraction, α, as

In the volume fraction equation, an extra artificial compression term (the third term) is defined to prevent the interface smearing[25, 26]. Ucis the vector of relative velocity normal to the interface

where n, φ, andfare the face unit normal flux, the face volume flux, and cell face area vector, respectively. The face unit normal is as follows

where δnis a small number to avoid zero value at the denominator of n. To solve the volume fraction equation, the multidimensional universal limiter with explicit solution(MULES) method is used [25, 26]. Furthermore, the pressureimplicit with splitting of operators (PISO) scheme is applied to compute the velocity and pressure fields using a geometricalgebraic multigrid (GAMG) solver [24]. For detailed formulations, the readers are referred to sources such as Deshpande et al. [25] and Rusche [26].
To capture the turbulence effects in the single phase regions accurately, large eddy simulation (LES) turbulence model is coupled with the VOF method. Similar to our previous studies[27, 28], the constant coefficient one-equation eddy-viscosity model is applied to estimate the sub-grid scale (SGS) stress tensor based on the SGS kinematic viscosity and turbulent kinetic energy (ksgs) as follows


where is the filter width and is calculated using the cube-root volume method [24]. The one equation eddy viscosity model was proposed by Schumann [29] and Yoshiawa and Horiuti [30]. In the work of Yoshiawa and Horiuti [30], the statistical results from the two-scale direct-interaction (DI) approximation were utilized to derive the SGS kinetic energy LES model. In addition,they recommended that ck≈ 0.1 and≈ 1 [30]. For detailed description as well as derivation of above equation, the interested reader is referred to Refs. [29-31]. It is also worth mentioning that, like other studies in this field [8-10, 28, 32], the interface is directly resolved in our simulations.
In our previous work [28], the numerical approach was validated against experimental data for a nonturbulent water jet in shear-laden air crossflow at the atmospheric condition. The computational domain and boundary conditions, which are similar to those of our previous study [28], are schematically shown in Fig. 1. The liquid is injected through a circular hole with diameter of 0.5 mm (which is considered as the liquid nozzle exit, d) located at the top of the domain. The coordinate system has they-axis in the liquid injection direction and thexaxis in the crossflow direction. Plug-flow profiles or uniform velocity boundary conditions are set for both gas and liquid inlets in the simulations. Furthermore, no-slip boundary condition is used for the top wall and inlet/outlet boundary conditions are imposed on the remaining boundary planes.
In our simulations, the crossflow Weber number, momentum flux ratio, crossflow Reynolds number, and liquid Reynolds number are assumed to be constant and equal to 330, 6.6,5.7×105, and 14079, respectively. These values are the same as those used in the work of Herrmann et al. [9]. To achieve the mentioned goals in the introduction part, three different cases with the density ratios equal to 10, 1000, and 5000 are investigated. The fluid properties and flow parameters for both phases are given in Table 1. It is worth mentioning that, to refine the size of the cells located at gas-liquid interface (i.e., whereis between 0.01 and 0.99), dynamic adaptive mesh refinement method (interDyMFoam solver in OpenFOAM [24]) with two refinement levels is used. The mesh is hexahedral and its size is about 0.1 mm at the initial time step (it reaches 25 μm near the liquid–gas interface). The total grid number is 20 million. Figure 2 illustrates the original mesh near the orifice as well as details of the mesh refinement near the liquid-gas interface. In the current study, the total calculation time for the cases with the density ratios equal to 10, 1000, and 5000, is 0.4, 1.27, and 2.81 ms, respectively. The numerical data is saved every 0.005 ms for the lowest density ratio case and every 0.02 ms for other cases. The maximum Courant number for the cases with the density ratios equal to 10, 1000, and 5000, are 0.48, 0.24, and 0.12, respectively.
To show the liquid jet trajectories, structures and atomization features at different density ratios, the isosurface of= 0.5 is illustrated in Fig. 3. The side view images, zoomed-in surfaces,and images from the incoming gas direction are shown in the first, second, and third rows of Fig. 3, respectively. As the liquid jet penetrates into the crossflow, it bends towards the crossflow direction. Clearly, the jet penetration and waves’ structure change by altering the density ratio. Figure 3 shows that, in general, an increase in density ratio causes the jet penetration to increase. Furthermore, when the density ratio increases the jet spread in transverse direction increases (i.e. spray area and plume width increase), which is consistent with the experimental observations [15, 20, 21]. Figure 3 also shows that as the density ratio decreases the onset location for liquid breakup and droplet formation is shifted towards the injection orifice, because of a rapid deformation of the liquid cross section. It is worth mentioning that, near the injection point, the column waves seem to be only on the windward surface at high density ratio, while they appear on the whole circumference of the liquid column at low density ratio. Moreover, for low density ratio case, more large structures of elongated ligaments are locally observed due to the growth of high-amplitude large-scale waves in downstream regions.
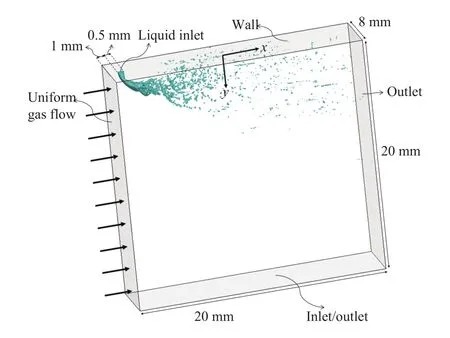
Fig. 1. Computational domain and boundary conditions.

Table 1 Jet and crossflow properties and inlet velocities.
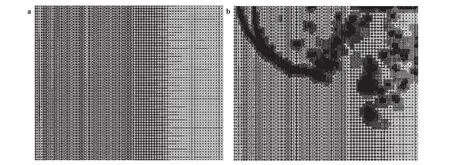
Fig. 2. Dynamic adaptive mesh refinement method, a original mesh and b mesh refinement at liquid–gas interface.
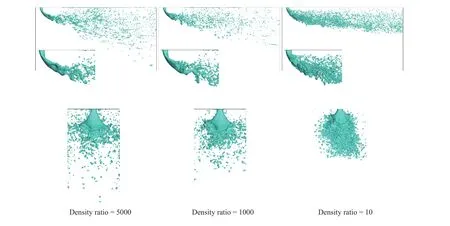
Fig. 3. Predicted liquid structure for different density ratios; from top to bottom: side view, zoomed-in view, and view from the incoming gas direction.
In Fig. 4, the spray windward trajectories, which are quantitatively extracted from our simulation results, are presented. For each case, using the same concept as described in our previous paper [28], an average of 50 images is taken and the spray trajectory is acquired from the averaged image. As clearly shown in this figure, by increasing the density ratio from 10 to 1000 the jet trajectory slightly increases (which is also consistent with the experimental observations) [20, 21]. However, increasing the density ratio from 1000 to 5000 results in a more noticeable increase in jet trajectory. Generally, it seems that the impact of density ratio is more significant in the farfield. The effect of density ratio change on the jet trajectory can be explained by the change in liquid column structure and the Stokes number (the ratio of droplet relaxation time to flow characteristic time). As discussed above, the liquid column is sustained contiguous longer at higher density ratio. In addition, as Leong et al. [33], Elshamy et al.[34], Herrmann et al. [9], and Li and Soteriou [35] explained in their articles, Stokes number has significant effect on the droplet trajectory after the column breakup point and also in the turbulent wake region behind the injected jet. Increasing the density ratio causes the droplet Stokes number to enhance [9].
Using MATLAB curve fitting tool, the following correlation is recommended based on our simulation results (R-square value is 0.974):

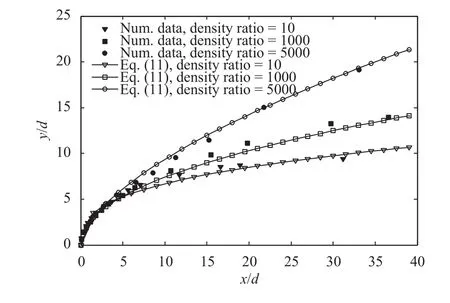
Fig. 4. Jet penetration height as a function of liquid-to-gas density ratio.
It should be noted that, unlike other empirical and theoretical correlations available in the literature (for example see Refs.[1-3, 7, 11, 12, 19, 20-23, 36]), the exponent of x/d in the above correlation is a strong function of density ratio. The jet trajectory correlation is usually in the form of, whereA,B, and C are constants. By employing the classical form of jet trajectory correlation, another equation with lower R-square value(= 0.9) is also recommended:

To evaluate the validity of our correlation for predicting the spray trajectory at different density ratios, the following two empirical correlations are used. These empirical correlations are obtained under specific test conditions explained below. In addition to the empirical correlations, two correlations obtained from numerical simulation of turbulent liquid jets in crossflows by Herrmann et al. [9] for density ratios equal to 10 and 100 are presented.Song et al. [37] (water and ethanol in air crossflow, air pressure: 0.1–0.6 MPa, air temperature: 300 K, and q: 20.6–206.8):

Ragucci et al. [38] (water and jet-A in air crossflow, air pressure: 1 and 2 MPa, air temperature: 300 K, q: 5–200, and We:10–400):

Herrmann et al. [9] (correlations based on numerical simulations of turbulent liquid jets in crossflows):

As shown in Fig. 5, the predictions of our correlation for density ratios equal to 10, 100, and 1000, are compared with those of the above correlations. As mentioned above, when the density ratio is relatively low, it does not have significant influence on the jet trajectory. Figure 5 shows that good agreement between the predictions of our correlation and the empirical correlation of Song et al. [37] is obtained. However, Figs. 4 and 5 show that, for large density ratio cases (e.g.= 5000), the difference between our numerical results and the experimental data of Song et al. [37] increases. In other words, the validity of the above empirical correlations is limited to a specific range of density ratios (i.e. where the density ratio is relatively low).Figure 5 also reveals that there is a significant discrepancy between the predictions of the above empirical correlations. As discussed by Lubarsky et al. [7] and Xiao et al. [39], liquid turbulence inside the injector is one of the main reasons that causes the mentioned inconsistency. In other words, the shape of liquid inlet velocity profile affects the liquid momentum and,therefore, the jet trajectory [7, 39]. In general, nonturbulent liquid jets with uniform inlet velocity profile, compared to turbulent liquid jets, penetrates less into the gaseous crossflows (see similar results in the work of Xiao et al. [39]). As presented in this figure, the jet trajectories obtained from numerical simulations of turbulent liquid jets in crossflows by Herrmann et al. [9] are higher than our numerical results (i.e. nonturbulent liquid jets where the inlet velocity profile is assumed to be uniform) and are matched with the prediction of empirical correlation of Ragucci et al. [38].
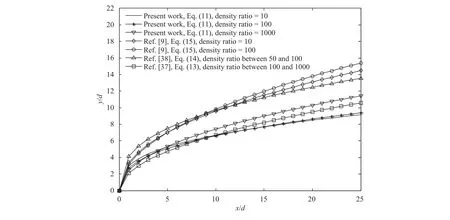
Fig. 5. Comparison between the predictions of our correlation and other empirical correlations for density ratio between 10 and 1000.
The VOF method is used to numerically study the influence of liquid-to-gas density ratio on the trajectory of nonturbulent liquid jets in subsonic gaseous crossflows. While momentum flux ratio as well as Weber and Reynolds numbers are kept constant,the density ratio is changed from 10 to 5000. It was shown that the liquid penetration height increases as the density ratio increases. Indeed, for high density ratio cases, the effect of density ratio on the jet trajectory is significant and should be taken into account. A correlation for estimating the jet trajectory at different density ratio conditions was developed in this study.
Acknowledgements
The authors would like to acknowledge the support provided by Concordia University.
杂志排行
Theoretical & Applied Mechanics Letters的其它文章
- Estimation of the effective properties of two-dimensional cellular materials:a review
- A data-based CR-FPK method for nonlinear structural dynamic systems
- Collinear micro-shear-bands model for grain-size and precipitate-size effects on the yield strength
- On the interaction between bubbles and the free surface with high density ratio 3D lattice Boltzmann method
- Principal and internal resonance of rectangular conductive thin plate in transverse magnetic field
- Piezoelectric energy harvesting from flexible delta wings
