An improved smoke-wire flow visualization technique using capacitor as power source
2018-02-13GaoLiu
N. Gao*, X.H. Liu
School of Aeronautics and Astronautics, Dalian University of Technology, Dalian 116024, China
Keywords:Smoke-wire visualization Capacitor Timing circuit
A B S T R A C T An improved smoke-wire flow visualization technique using a large capacitor as the power source was proposed. Electric current discharged from capacitors was used to heat a fine metal wire suspended in the flow field. The oil droplets attached to the wire were vaporized and smoke filaments followed the flow motions. A digital camera was used to record the images of the smoke filaments. The actions of discharging and camera shutter were triggered by signals from a microcontroller to ensure the accurate timing. Clear images of the streaklines were captured at a freestream velocity up to 12.9 m/s, much higher than the limits of the existing techniques.
Smoke-wire visualization technique introduces closely spaced streaklines in the flow of interests. It is easy to implement, low in cost and provides a straightforward view of the coherent flow structures. History and development can be found in a recent review by Nelson and Barbie [1] and are also summarized in Table 1 (Data from Refs. [2-23]). A functioning smokewire system typically includes a metal wire, a power source generating electric current, a camera and a light source. The metal wire is usually made of stainless steel, Nichrome or Tungsten.The strength, resistive heating characteristics and the diameter are the key factors to consider in selecting wire. The Reynolds number based on the free stream velocity and the wire diameter is suggested to be less than 20 to minimize the disturbances to the flow field [2]. The wire should also have a proper electric resistance to allow current of at least 0.5 Amperes to pass through the wire [24]. A direct current (DC) or an alternating current(AC) power supply can be used to heat the wire. It is desirable to heat the wire to a large temperature in a short amount of time, so that smoke with high density can be generated without damaging the wire.
It is also desirable to use a light source with a large luminous intensity to light up the smoke streaks and a small duration to“freeze” the turbulent structures. A neodymium-doped yttrium aluminium garnet (Nd:YAG) pulsed laser used for particle image velocimetry (PIV) measurements is ideal for this purpose as its pulse duration can be as low as a few nanoseconds. But PIV laser is high in cost and low in illumination volume. Flashes are low in cost and able to provide large illumination volume. The typical flash duration is about 20 μs for a strobescope and 50 to 150 μs for a commercial camera flash, e.g. Canon 600EX-RT [25].
A timing circuit was used to coordinate the actions of the power supply, camera shutter and light source so that clear images of the smoke filaments can be captured even the duration of the smoke filament was small [3,4,7,9,10,21]. An analog timing circuit developed by Batill and Mueller [3] includes NE555timing chips and a potentiometer to set the time interval between smoke generation and camera shutter. The resolution of the time interval setting was limited due to the manual operation. Moreover, the precision of the timing chips was susceptible to the ambient temperature and the supplied voltage. The largest free-stream velocity for investigations using an analog timing control circuit was 6.2 m/s [9].
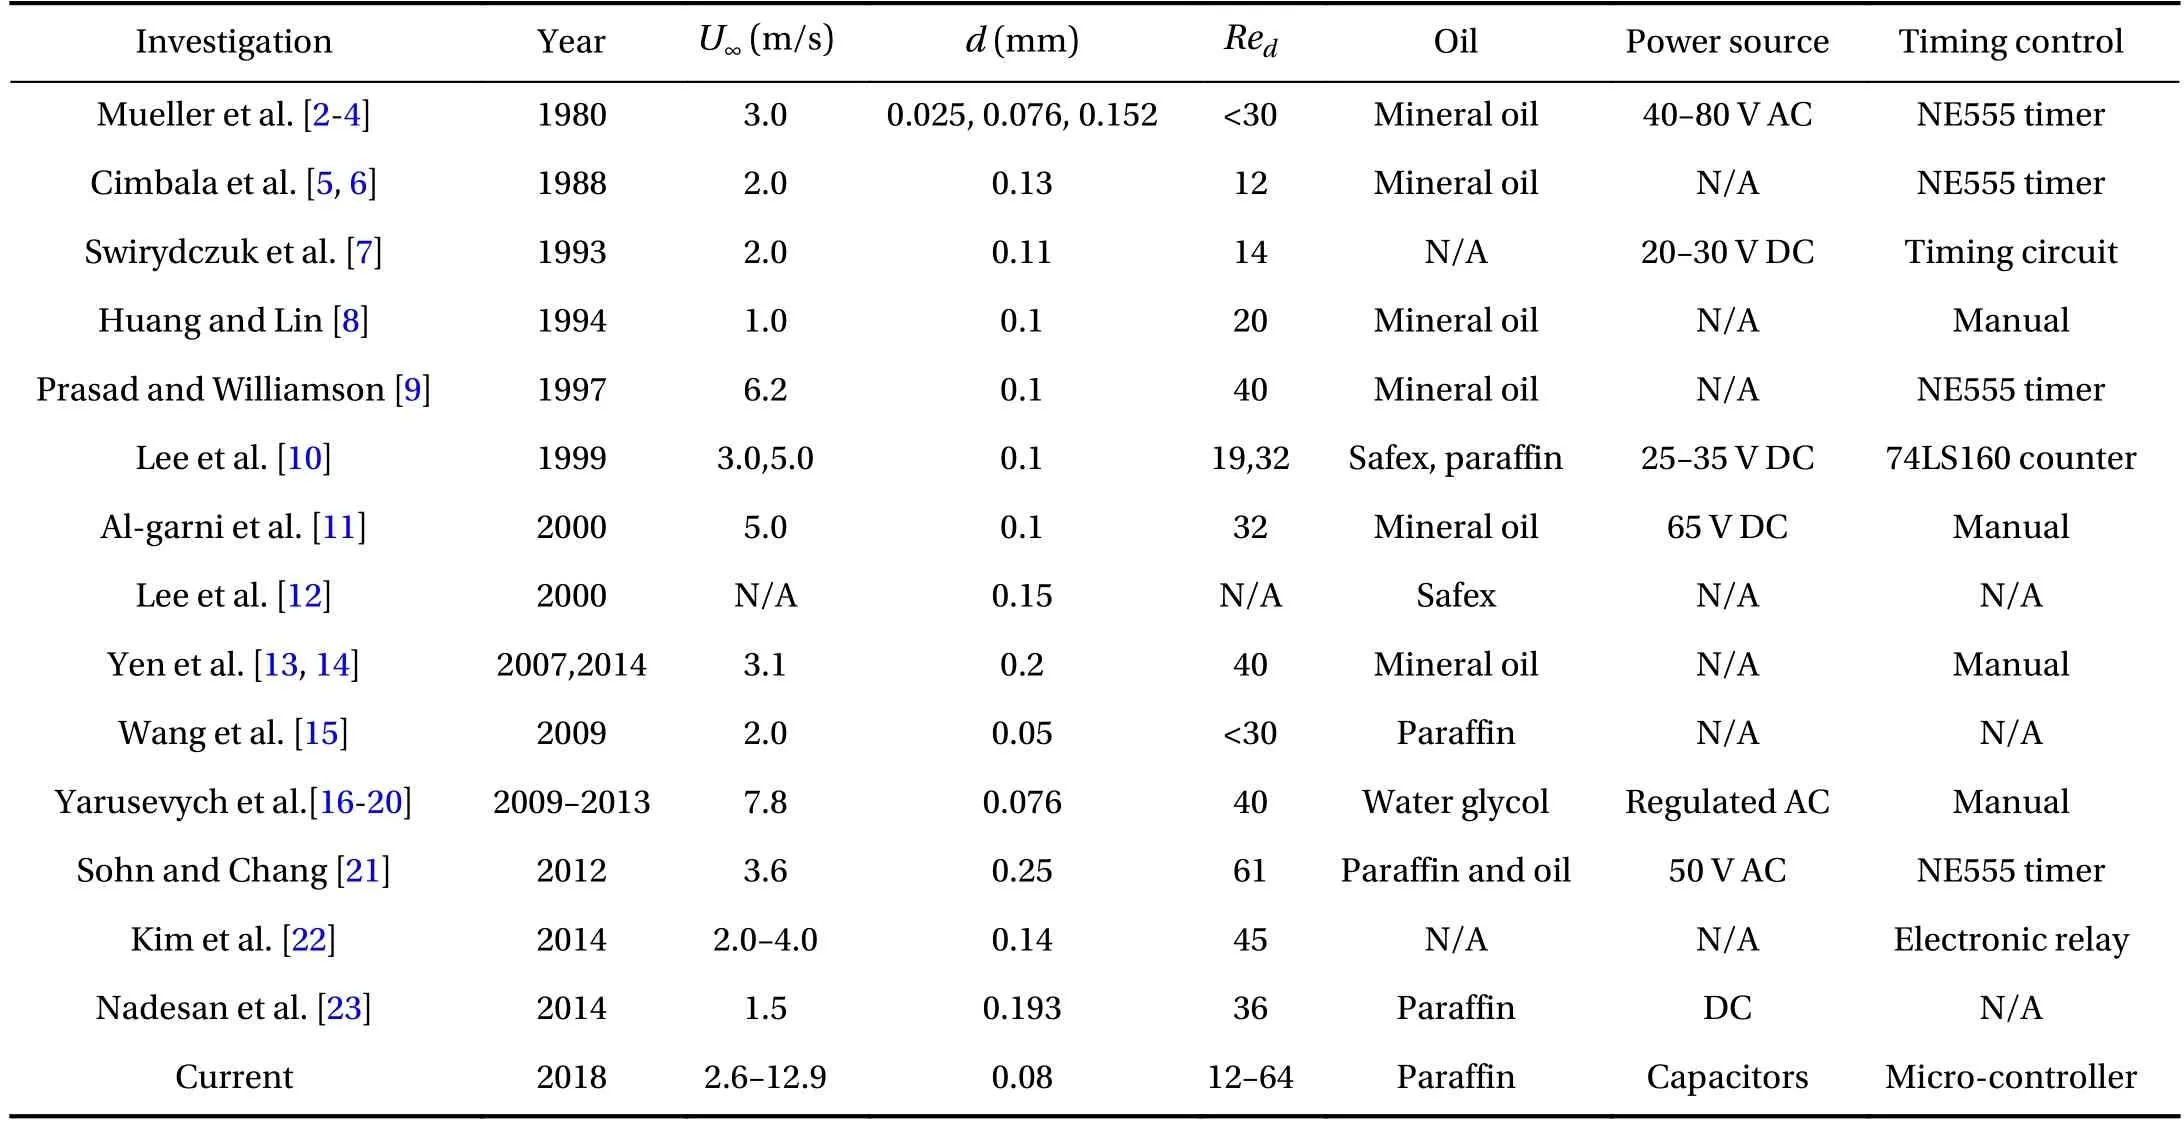
Table 1 Summary of the existing smoke-wire flow visualization technique.
Recently, Yarusevych et al. [16-19] studied the flow field downstream of an airfoil using the smoke-wire visualization technique. They brushed water/glycol mixture on a 0.076 mm diameter stainless steel wire suspended vertically through a wind tunnel with a small hanging weight attached to the lower end of the wire. A variable transformer regulated AC was used as power source. The voltage applied to the wire was adjusted manually. A digital single-lens reflex (DSLR) camera took four consecutive images after the power was applied to the wire. The velocity in their investigation was 7.8 m/s which was the largest in the literature using the smoke-wire visualization technique to the authors knowledge. They noted that it was not possible to visualize the flow with a free-steam velocity larger than 7.8 m/s because of the difficulties to capture a clear image and the short life of metal wire.
In this letter, we present an improved smoke-wire visualization technique using capacitor as power source that can increase the limit on the free-stream velocity to more than 10 m/s.The details of this technique is outlined in the next section, followed by visualizations of cylinder wakes at different velocities and the three dimensional flow structures over a backward facing step.
Two examples using the proposed smoke-wire visualization technique were given in this paper: cylinder wake and flow over a backward facing step. The visualization of cylinder wakes was conducted in a suction-type open-loop tunnel with a 300 mm ×300 mm × 700 mm square test section that was also used by Gao et al. [26]. The contraction ratio is 9:1, the turbulence intensity in the test section is less than 0.5%. A cylinder model with a diameter of 30 mm and a length of 290 mm was mounted horizontally in the center of the test section as shown in Fig. 1(a). A tungsten wire with a diameter of 0.08 mm and a length of 340mm was stretched vertically at 80 mm upstream of the rear surface of the cylinder along in the central plane of the tunnel. The background (far side of the wind tunnel) was painted using candlesoot paint to increase the contrast of the smoke filaments. The visualization was performed at free-stream velocitiesUofrom 2.6 m/s and 12.9 m/s, the corresponding Reynolds numbers (ReD=) are from 5100 to 25700. The Reynolds numbers based on wire diameter () are from 12 to 64.
The visualization of backward facing step flow was conducted in a blow-down type open-return tunnel that was also used by Li et al. [27]. Air went through a settling chamber (900 mm ×900 mm × 750 mm), a 750 mm long contraction section with a 9:1 area ratio and a 300 mm × 300 mm × 1000 mm (width, height,length) test section. The step was located at the bottom of the test section with a height (H) of 25 mm as shown in Fig. 1(b). The measurements were performed for a free-stream velocity ofUo=2.0 m/s and 6.0 m/s, corresponding to Reynolds numberReH=of 3310 and 9950, respectively. The free stream turbulence intensity was less than 0.8%. A 0.1 mm diameter 29.0 cm long stainless steel wire was stretched horizontally across the flow 25.0 mm (1.0H) downstream of the step while being at the same height of the step. The camera was situated over the top of the test section to capture the top view of the smoke streaks. Liquid paraffin was applied to the metal wire manually using a paint brush. A DSLR camera (Canon 5D mark II) was used to record the images. The camera was set in the mirror lock-up mode. The sensitivity was ISO-100, the aperture was F6.3 and the shutter speed was 1/200 s. A Canon 600EX-RT flash was used with 1/128 of its maximum power output, the flash duration was about 100 μs measured using an optical-to-electrical analog converter (Tecktronix P6701B). Two 2200 μF capacitors (a total capacitance of 4400 μF) were used as the power source to heat the wire. The capacitors were charged by a DC power supply to a pre-set voltage, typically 50 - 100 V. Current (typically 5 - 20 A)discharged from the capacitors passed through the metal wire vaporizing the oil beads attached to the wire. The typical time that the current decreased to 50% of its peak value was about 5 ms for a 40 cm long and 0.1 mm diameter stainless steel wire.
The actions of capacitor changing/discharging and camera shutter were coordinated using a digital timing control circuit included an ATmega16 micro-controller. The schematic of the controlling system is shown in Fig. 2. The micro-controller sent commands through three digital ports: port 1 for charging; port 2 for discharging, and port 3 for the shutter control. The last two ports were isolated using PC817 photo-couplers to prevent micro-controller and camera damages in case of a circuit failure,see Fig. 3.
The timing sequence diagram for the different actions is shown in Fig. 4. The working sequence was as follows: after the operator pressed the charging button, the solid-state relay was switched on and the capacitors were charged before the relay switched off in time durationt1; after the operator pressed the start button, the silicon-controlled rectifier (BTW69-800)switched on, current discharged through the smoke wire generating smoke streaks; at timet2after the start button being pressed, a triggering signal was sent to the camera shutter and opened the shutter; the camera then triggered the flash using a wireless triggering device to illuminate the smoke filaments at timet3after the shutter trigger. The timest1tot3were obtained by a trial-and-error approach.
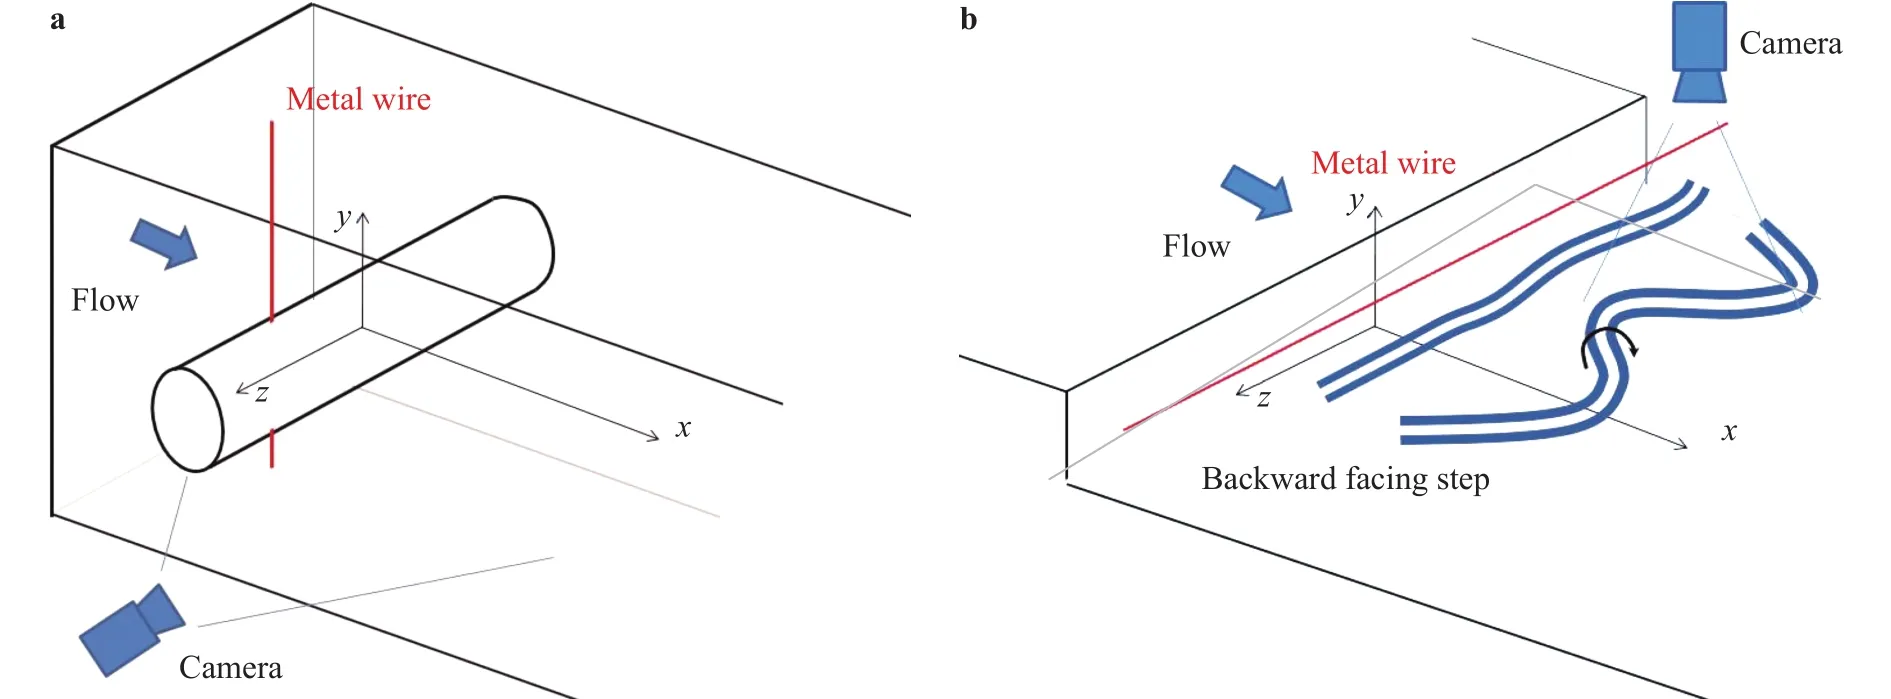
Fig. 1. Schematics of setups for a cylinder wake and b backward facing step flow experiments.
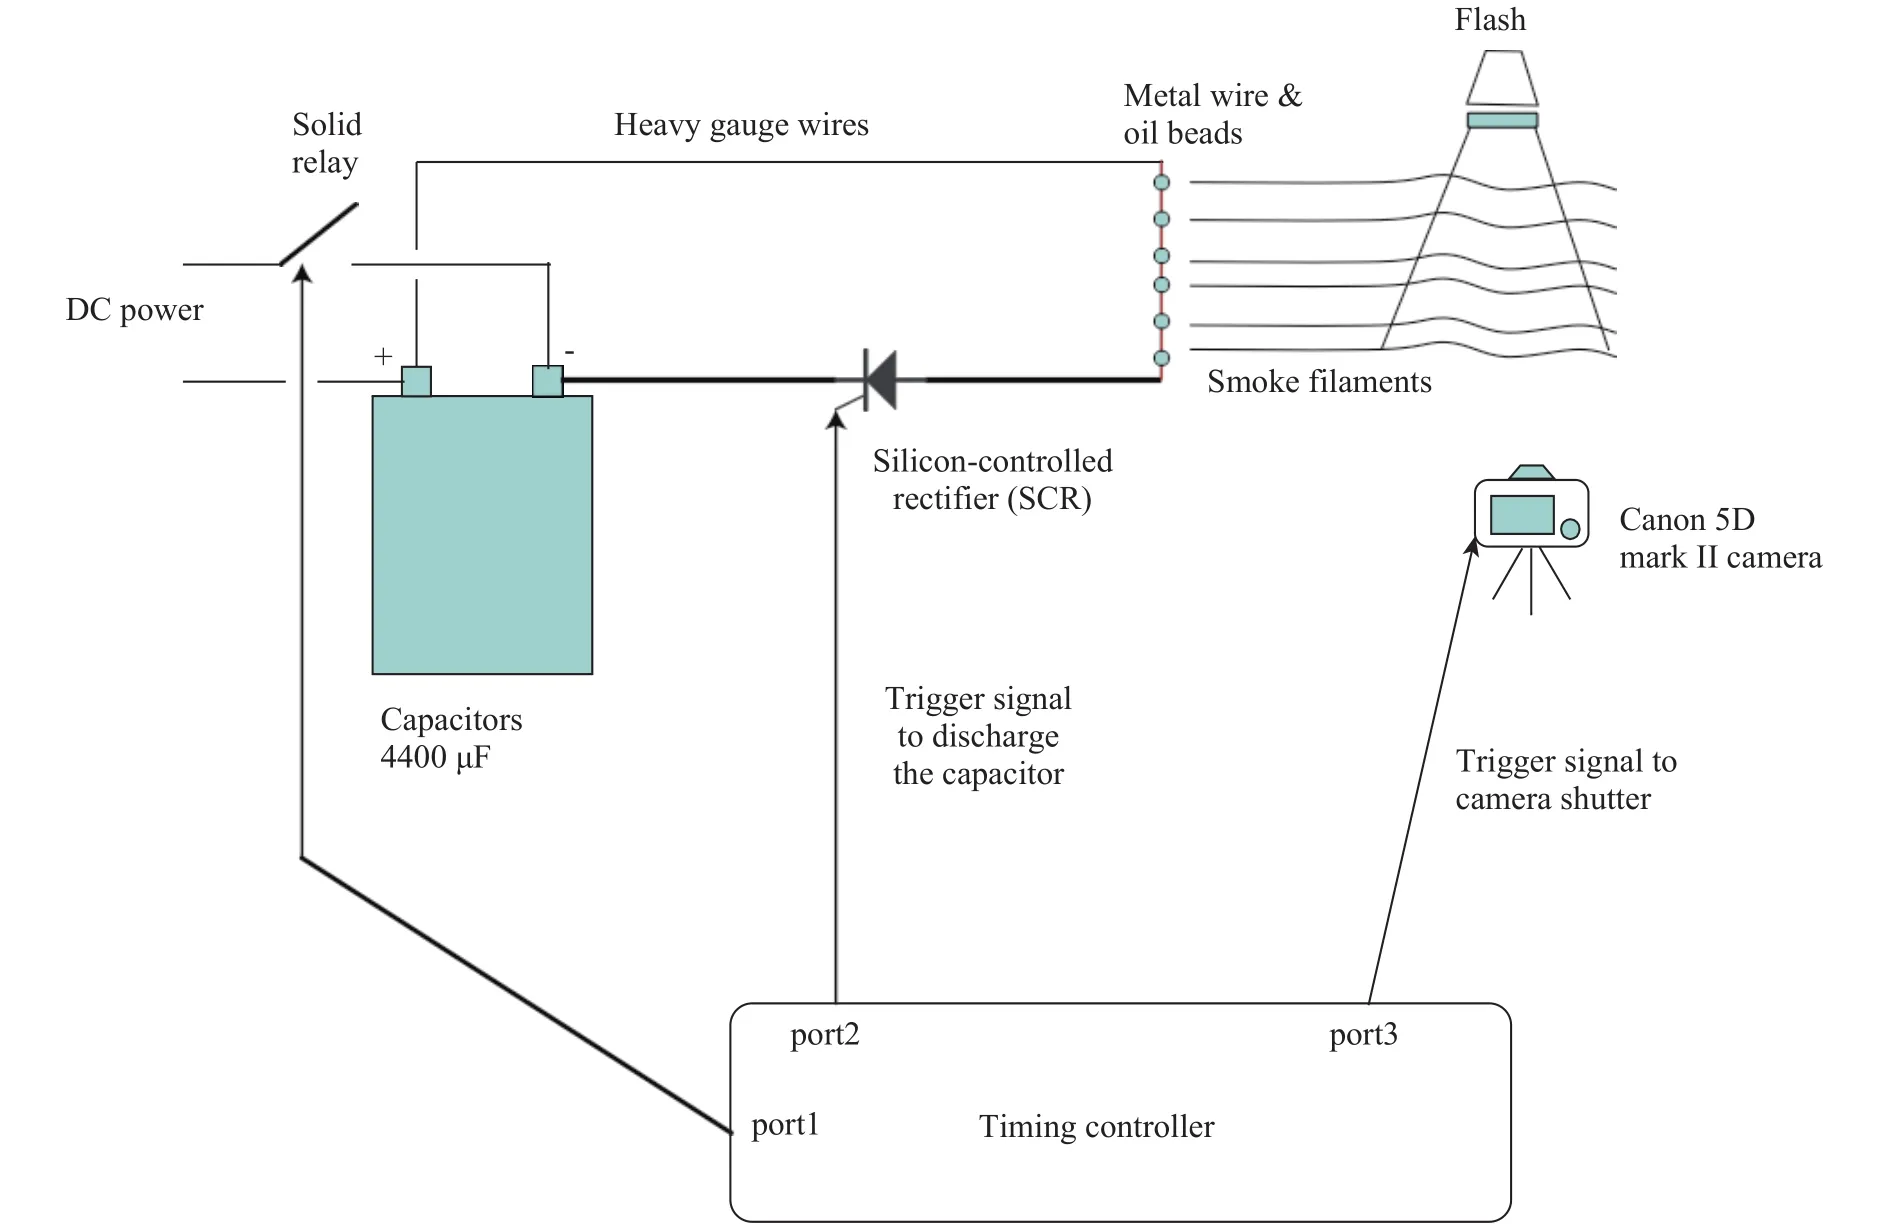
Fig. 2. Schematics of a novel smoke-wire visualization system.
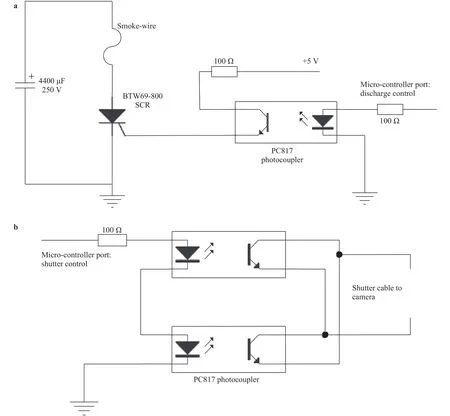
Fig. 3. Schematics of a port 2 (the circuit to discharge the capacitors) and b port 3 (the circuit for the shutter control).
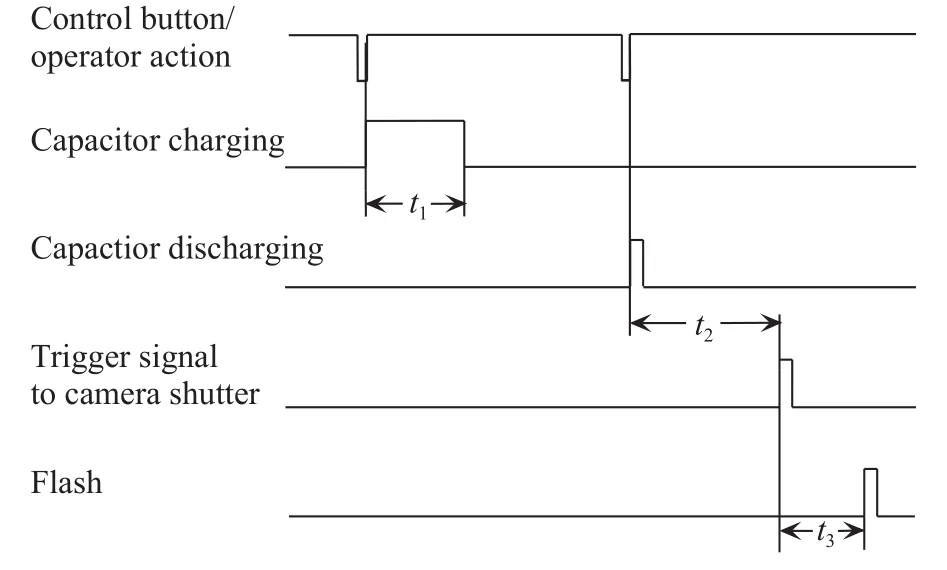
Fig. 4. Schematics of the timing-sequence for the controller.
The smoke-wire visualization of the wake behind a cylinder for a free-stream velocity of 2.6 to 12.9 m/s are shown in Fig. 5.TheReDis from 5100 to 25700. These images showed that closely spaced streaklines were produced downstream of the smoke wire. The width of the streaklines became larger as the freestream velocity increased, but this did not have a significant effect on the observation of the large scale structures in the wake.A separation region formed downstream of the cylinder and large-scale alternating structures can be seen in the wake. Smaller scale structures can also be clearly identified in the wake. The streaklines in the wake blurred slightly in the case withReD=25700, likely because the flash duration was relatively long in this case. The quality of visualization decreased when the free-stream velocity was larger than 12.9 m/s. The disturbances from the smoke wire itself made the width of the streaklines grow in a much quicker way and the motion of the smoke filaments during flash further blurred the image.
The advantages of using a light source with a large volume were demonstrated in the visualization of the flow over a backward facing step, as shown in Fig. 6. Flow structures due to Kelvin–Helmholtz (KH) instability can be clearly seen in the initial part of the laminar separated flow (Fig. 6(a)). Structures with much larger scales rolled up and these structures engulfed the KH structures. Both types of structures were fairly two dimensional in the low Reynolds number flow and the boundary layer upstream of the separation appeared to be laminar. Three dimensional structures with much smaller spanwise length scales were evident in the high Reynolds number flow (Fig. 6(b)), suggesting the flow underwent a transition. There appeared to be one or more spanwise coherent motions in the high Reynolds number turbulent separated flow but were not obvious. There appeared to be spanwise coherent smoke streaks far down streams of the separation point that might be linked to the shedding motion.
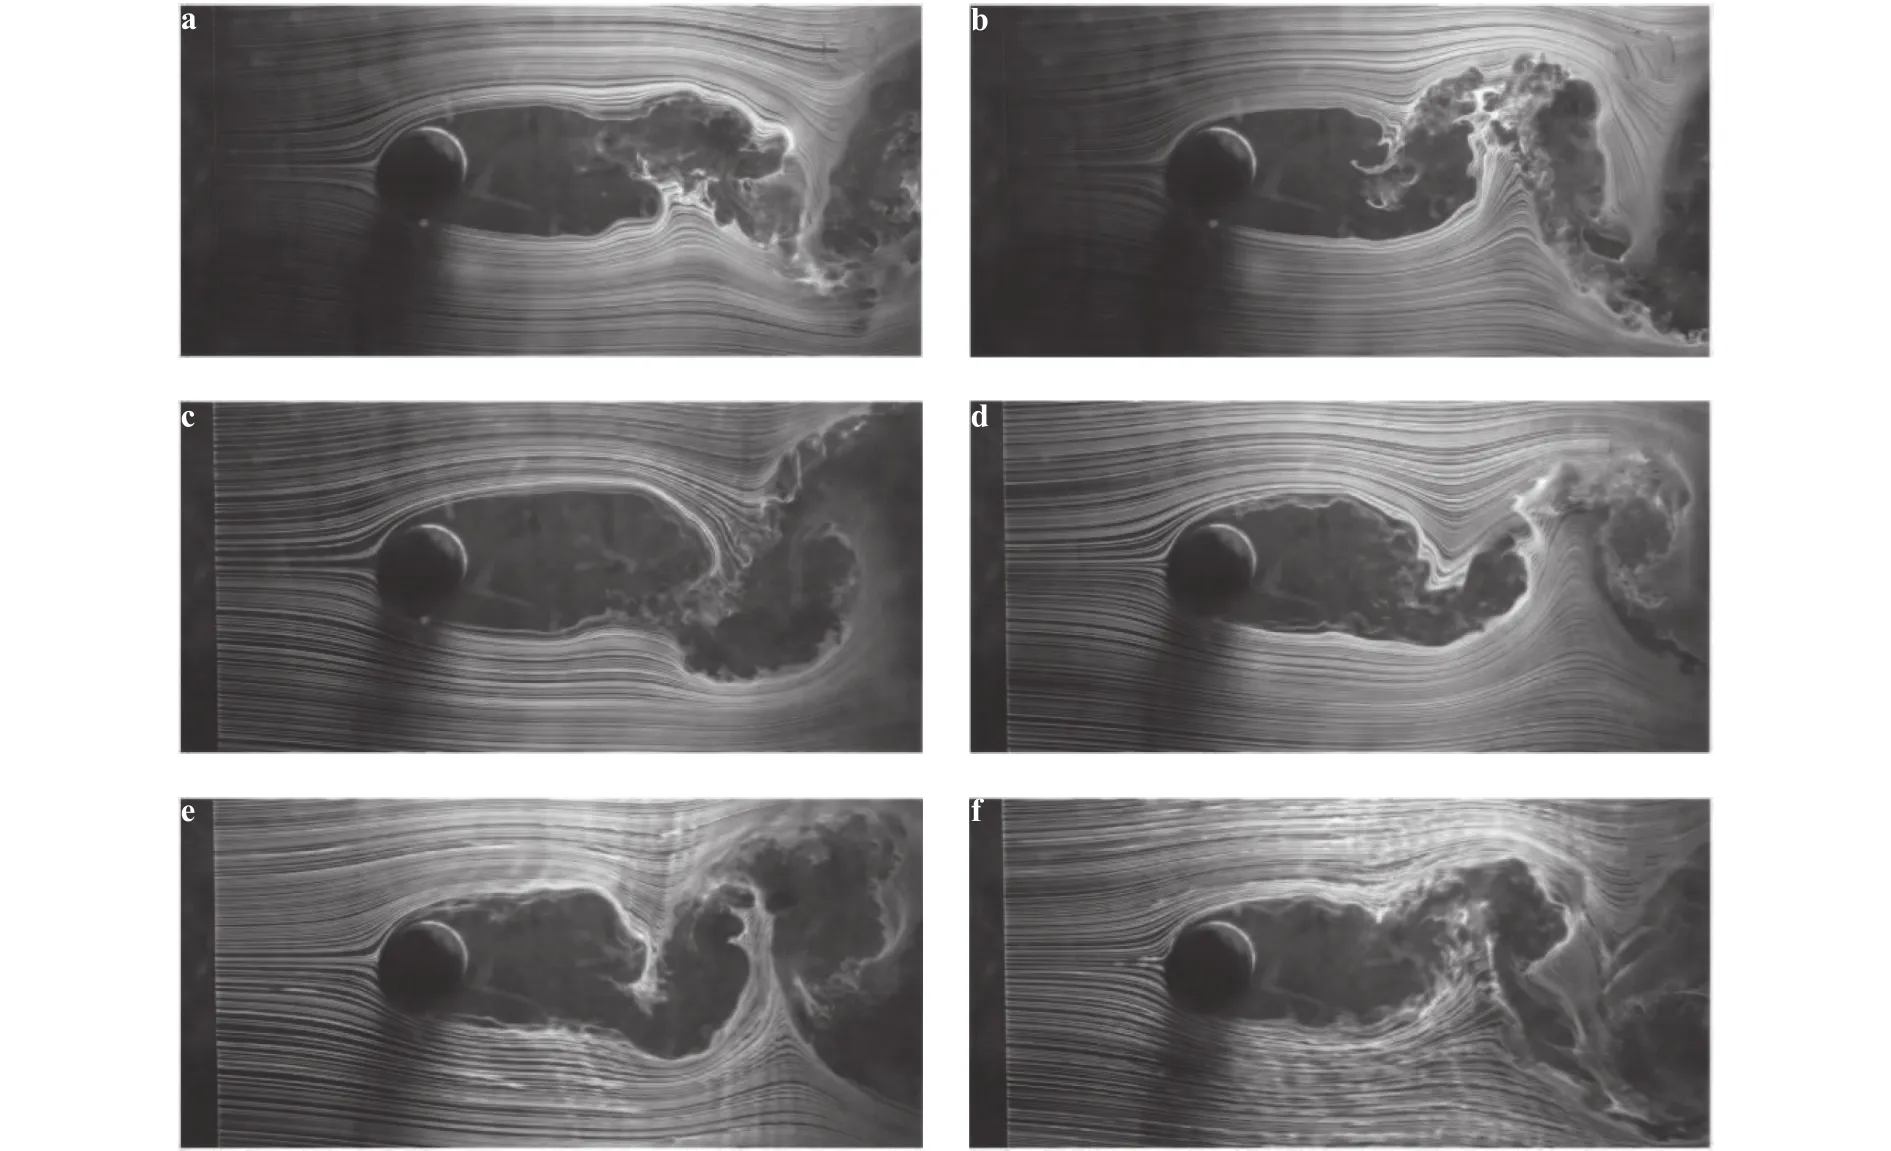
Fig. 5. Smoke-wire visualization of the wake behind a cylinder for a free-stream velocity a Uo = 2.6 m/s, b Uo = 3.9 m/s, c Uo = 5.2 m/s, d Uo =7.8 m/s, e Uo = 10.5 m/s, and f Uo = 12.9 m/s, the corresponding Reynolds number ReD is 5100, 7770, 10360, 15540, 20920, and 25700, respectively.
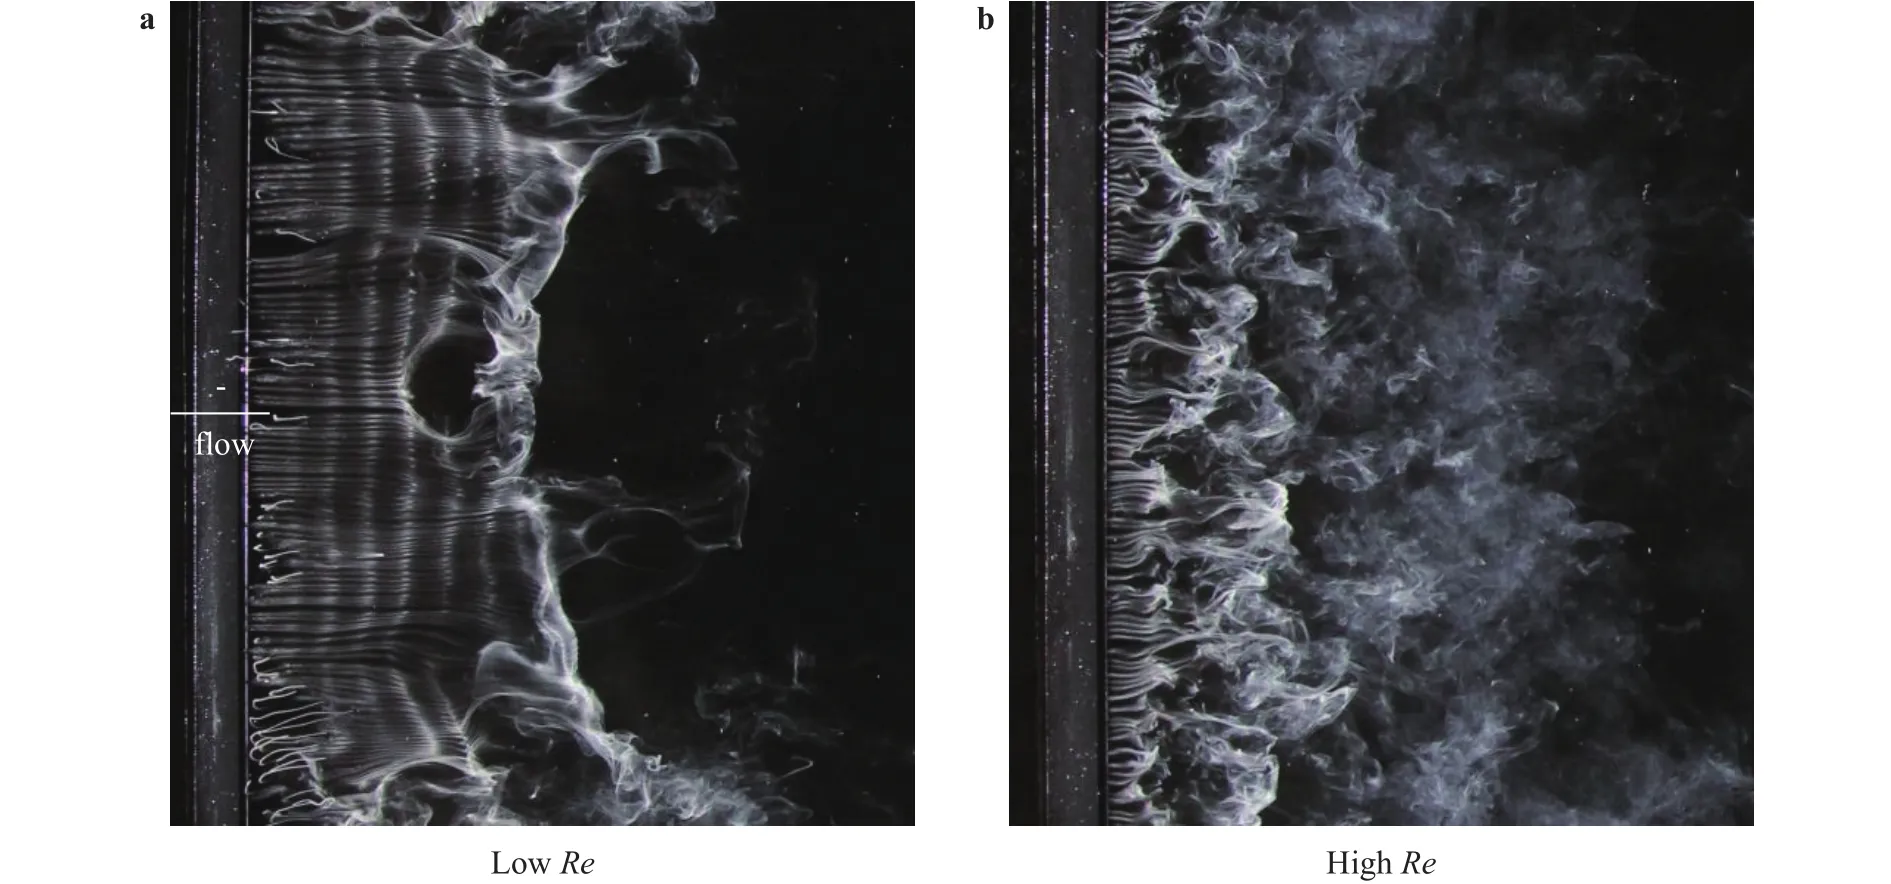
Fig. 6. Top view of a backward facing step flow for a Uo = 2.0 m/s (ReH = 3310) and b Uo = 6.0 m/s (ReH = 9950)
An improved smoke-wire flow visualization technique was proposed in this paper. Electric current discharged from capacitors was used to heat a fine metal wire stretched in the flow field.The oil beads attached to the wire were heated and smoke filaments were generated. A DSLR camera was used to record the image. The actions of discharging and camera shutter were triggered by signals from an ATmega16 micro-controller. Clear images of the smoke streaks at a free-stream velocity as large as 12.9 m/s were acquired. The volumetric light source provides better views of the coherent motions in comparison to the regular PIV measurements using a single light sheet.
Acknowledgements
This work was supported by the National Natural Science Foundation of China (91752101 and 11572078).
杂志排行
Theoretical & Applied Mechanics Letters的其它文章
- Data-driven computing in elasticity via kernel regression
- The effects of mean sea level rise and strengthened winds on extreme sea levels in the Baltic Sea
- New interpretation of specific sign of Reynolds stress in the boundary layer on a flat plate
- Head-on collision between two hydroelastic solitary waves with Plotnikov-Toland's plate model
- Linear, nonlinear dynamics, and sensitivity analysis of a vibratory ring gyroscope
- Structure-preserving approach for infinite dimensional nonconservative system
