基于第一性原理计算的铁电材料BaTiO3相关振动光谱指认
2015-12-29刘天慧王春海刁传玲罗能能勇戚泽明王玉银田光善荆西平
安 炜 刘天慧 王春海 刁传玲 罗能能 刘 勇戚泽明 邵 涛 王玉银 焦 桓 田光善 荆西平
(1北京大学物理学院,北京100871;2北京大学化学与分子工程学院,稀土材料化学及应用国家重点实验室,北京100871;3陕西师范大学化学化工学院,陕西省大分子科学重点实验室,西安710119;4中国科技大学,国家同步辐射实验室,合肥230029)
基于第一性原理计算的铁电材料BaTiO3相关振动光谱指认
安 炜1刘天慧2,3王春海2刁传玲2罗能能2刘 勇2,3戚泽明4邵 涛4王玉银4焦 桓3田光善1,*荆西平2,*
(1北京大学物理学院,北京100871;2北京大学化学与分子工程学院,稀土材料化学及应用国家重点实验室,北京100871;3陕西师范大学化学化工学院,陕西省大分子科学重点实验室,西安710119;4中国科技大学,国家同步辐射实验室,合肥230029)
通过固相反应烧结法在1400°C下烧结4h合成了BaTiO3陶瓷,并用X衍射确定了其为四方晶系.进行了拉曼谱和红外谱的测量,并采用洛仑兹函数以及四参数方法分别对上述光谱进行了拟合.基于第一性原理的计算,并考虑了横模纵模劈裂,对拉曼和红外光谱进行了指认.为了更好地分析振动模式,所有振动模用群论的对称坐标进行了分解.在12个光学模中,仅具有拉曼活性的B1模式是O4和O5沿着z轴的相对运动.A1模式和E1软模式是从立方BaTiO3相的F1u模式劈裂出来的,对于四方相BaTiO3的铁电性有着重要作用,其体现在A1(1)模式造成了铁电z轴的极化,E1模式导致了大介电常数.这两个模式都可以看成是Ti原子相对于O6八面体笼子沿着z轴或者是xy平面的振动.
第一性原理计算;拉曼模式;红外模式;介电性质
1 Introduction
Investigationonsolidstatedielectricmaterialsisoneofthe mostimportantresearchfieldsinmaterialsciences.1Duetothe developmentofthemicrowavecommunicationtechnology,the microwavedielectricceramics,whichcanbeusedinresonator, filter,antennaandsoon,havedrawnmanyattentionsinthepast twodecades.2Basedonthedielectrictheory,thevibrationalmodes ofthedielectricceramicshavesignificantinfluenceontheirdielectricproperties,thusdeepunderstandingonthevibrational modesofthematerialsisveryimportant.Tostudytheinfluences ofthevibrationalmodesonthedielectricproperties,farinfrared (FIR)reflectivespectrawerefirstlyanalyzedusingthefourparametersemiquantum(FPSQ)modelbyPetzelt3andWakino4etal.in1980s,referringtothematerialsK2SeO4,Ba(Zn,Ta)O3-BaZrO3andsoon,andtheseauthorsindicatedthemodecontributionstothedielectricpropertiesforthesematerials.Subsequentlyusingthree-parameterortheFPSQmodels,5Fukudaetal.6havefittedtheFIRvibrationalspectraofBaSm2Ti5O14,BaTi4O9, Ba(Zn1/3Nb2/3)O3andsoon.Henceforth,basedonthesame approach,manymicrowavedielectricceramics,suchas Ba6-3xSm8+2xTi18O54,7CaSmAlO4,8(Mg1-xZnx)Al2O49andsoonhave beeninvestigated.10,11However,inalltheabovework,authorsdid notgivethedescriptionsofthevibrationalmodesanddidnotestablishthelinksbetweenthesevibrationalpatternsanddielectric properties.Inourpreviouswork,wehavestudiedtheRamanand FIRspectraforsomedielectricmaterials,e.g.Ba(Mg1/3Ta2/3)O3,12,13MgTiO3,14,15Ba(Mg1/2W1/2)O3,16andBa(Mg1/3Nb2/3)O3.17Wenotonly analyzedthemodecontributionstothedielectricpropertiesfor thesematerials,butalsoassignedanddescribedthevibrational patternsbasedonthefirst-principlescalculations.
Ferroelectricsareonetypeofthespecialdielectricmaterials, havingvariousapplicationsinelectronics.18,19BaTiO3,theprototypeofferroelectrics,hasalreadyattractedlotsofresearchersto discovertheoriginofitsferroelectricpropertiesandthemechanismbehindthepara-ferroelectrictransformation.20-22Among thesereports,investigatingcorrelationsbetweenthevibrational modesandtheferroelectricpropertiesisoneoftheimportant aspects.ByusingFIRreflectivespectrum,Luspinetal.23have assignedthesoftmodeincubicphase(hightemperaturepolymorph)andfurtherverifiedthatthephasetransitiondownto tetrahedronphaseisessentiallydisplacivetype,ratherthanthe order-disordertype.TheRamanspectrumofthesinglecrystal BaTiO3(tetragonalphase)haslongbeenmeasuredandassigned basedonthesymmetryanalysisbyDiDomenicoetal.24Besides, inWada'srecentwork,25theFIRspectraofthepolycrystalline BaTiO3materials(bothpowderandcolloidalcrystals)havebeen measuredandfittedbytheFPSQmodeltoextrapolatethedielectricbehaviorinterahertz(THz)region.Also,withtheadvance ofthedensityfunctionaltheory(DFT)first-principlescalculation approach,lotsofcalculatingworkforBaTiO3hasbeenconducted onsomeaspects,suchassurfacestructurerelaxation,defectand impurity,nanoBaTiO3structureandsoon.26-30InEvarestov'svery recentwork,31thefrequenciesofvibrationalmodeswerecalculatedbyvariousoffunctionalsinDFTframeworkandtheassignmentstotheRamanandFIRspectrawereconductedaccordingtotheirsymmetries.However,thestudiescombiningthe vibrationalmodecalculationswiththeassignmentsofthemeasuredRamanandFIRspectraareraretothebestofourknowledge.AlthoughstudiesbothonthemeasurementsoftheRaman aswellasFIRspectraandthetheoreticalcalculationsforthe vibrationalmodescanbefound,butnormallythemeasuringwork andcalculatingworkwereconductedseparatelybydifferent authors.Additionally,theresearchesondescribingthevibrational patternsofBaTiO3andestablishingtherelationsbetweenthe vibrationalpatternsandtheferroelectricbehaviorarestillscarce.
Inthepresentwork,themethodswepreviouslyused12-17forthe microwavedielectricceramics,wereappliedfortheferroelectric ceramicBaTiO3.HerewesynthesizedtheBaTiO3ceramicsample withthepuretetragonalphase.Thesymmetrycoordinatesofthe materialwereobtainedthroughgrouptheoryanalysesandthe vibrationalmodeswerecalculatedbythefirst-principlescalculations.Andthenthevibrationalmodeswererepresentedbythe linearcombinationsofthesymmetrycoordinatesandthevivid cartoondescriptionsofallthevibrationalmodeswereillustrated. TheRamanandFIRspectrawereanalyzedbyLorentzfittingand theFPSQmodel,respectively.Basedonthecalculatedfrequencies ofthetransverseopticalmodes,thevibrationalpeaksinthe RamanandFIRspectrawereassigned.Thecontributionsofthe assignedmodestothedielectricpropertieswerecalculatedand analyzedcombiningtherealspacevibrationalpatterns.Theresults showthattheE(1)softmode(24.0cm-1)ismainlyresponsibleto thelargepermittivityofBaTiO3andtheA1(1)mode(177.6cm-1) causesitsferroelectricpolarization.
2 Experimentalandtheoreticalmethod
TheBaTiO3ceramicsamplewassynthesizedbyconventional solidstatereactions.BaCO3(99%,analyticalreagent,AR,Beijing FineChemicalCompany,China)andTiO2(99%,analyticalreagent,AR,BeijingChemicalReagentCompany,China)wereused asstartingreagents,whichwereweighedinappropriateratioand mixedbygrindingwithanagatemortarandpestle.Theground powderwasfirstlycalcinedat1200°Cfor2h,andthensintered onaPtplateat1400°Cfor4h.Priortothesintering,thepowder wasre-groundandpressedintoadisk.Thesintereddiskhastherelative density of98%measured using theArchimedesprinciple.
A Rigaku D/max-2000 X-ray diffractometer(XRD,Tokyo, Japan)w ith Cu Kαsource,operated at100 kV and 40mA,was used for the phase identification.The patternwas recorded in the 2θrangeof5°-90°w ith astep sizeof0.02°and ascan rateof6 s· step-1.The cellparameters and atom coordinateswere refined by Rietveld refinement using the software TOPAS(version 3).32A Horiba/Jobin Yvon laser Raman analyzer LabRAM HR 800 (Longjumeau,France)was used for Ramanmeasurement(100-1000 cm-1),inwhich a He-Ne laser sourcewith thewavelength of 632.8 nm and a grating w ith 1800 line·mm-1was applied.FIR reflective spectrum in the range from 100 to 4000 cm-1was collected on a Bruker IFS 66(Karlsruhe,Germany)Fourier transform infrared spectrometer,in which a Globar source,a 2 cm-1resolution,and a 12°incidentanglewere applied.The spectrum was recorded in vacuum and an Aumirrorwasused asa reference during the data collection process.For the FIR spectrum measurement,one surfaceof thediskwascarefully polishedwith fineα-Al2O3powdersuntilmirror-like surfacewasachieved.Dielectric properties in microwave frequency were determined using the method suggested by Hakki and Coleman33and modified by Courtney34using a network analyzer(N5230A,Agilent,Palo Alto, CA).A lternating current(AC)impedance analyzer(6500B, Wayne Kerr Inc.,Shenzhen,China)was employed formeasuring the dielectric properties in the frequency range of 1 Hz-1MHz. Prior to themeasurements,the Ptelectrodes on the two opposite surfaces of the disk were prepared by coating the Pt pastew ith two Ptw ires follow ing 800°C heating for10m in to burn off the organic components in the paste.A ll the measurements were carried outat room temperature.
The first-principles calculationsw ithin the framework of the density functional theory were performed using the CASTEP packaged35implemented in Materials Studio 5.0.The localdensity approximation(LDA)was used throughoutall the calculations. Thenorm-conserving pseudopotential in theCASTEPdatabaseand the valence electron configurations of 5s25p66s2,3d24s2,and 1s22s22p4for Ba,Ti,and O were selected,respectively.To ensure the convergence of the ground-state totalenergy,the cutoff energy of the plane-wave basiswas set to be 650 eV and the 6×6×6 Monkhurst-Pack k-meshwith(0.25,0.25,0.25)origin shiftwas adopted.We set the convergence tolerance as10-8eV·atom-1.For geometrical optim ization,both the cell parameters and internal atomic coordinateswere relaxed,using a force tolerance of 0.01 eV·nm-1.The frequenciesand theatom movementsof theoptical vibrationalmodes can be obtained from the phonon calculation based on the linear responsemethod using the tetragonalunitcell of BaTiO3.
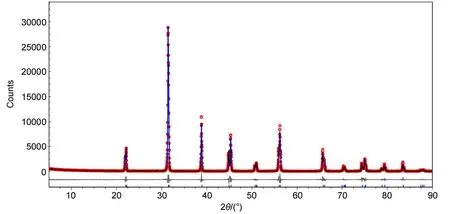
Fig.1 Observed(cycles)and calcu lated(line)XRD patterns,aswellasdifference profile(linebelow the pattern),for the Rietveld structureanalysisof the BaTiO3samp le(color online)
3 Resu lts and d iscussion
The XRD pattern of the BaTiO3ceram ic sample and the Rietveld refinement results are illustrated in Fig.1.The TOPAS refinementwas carried outbased on the tetragonalstructuremodel of BaTiO3(ICSD#161340)36w ith a spacegroup P4mm(No.99) and the cell parameters a=0.39988(2)nm and c=0.40222(4)nm. In this databasemodel,allatom(Ba 1a,Ti1b,O1 1b and O2 2c) areat the specialsites.Except the coordinatesof the Baatom(1a site),the coordinatesof allotheratomswere refined and they are given as:Ba 1a(0.0000,0.0000,0.0000),Ti1b(0.5000,0.5000, 0.4973),O1 1b(0.5000,0.5000,0.9604),and O2 2c(0.5000, 0.0000,0.4928).Other refined results are listed in Table 1.The satisfied refinement quality confirmed that the BaTiO3ceramic sample isa pure phase.
The refined cell parameters and the atom coordinatesmentioned abovewere used as the initialstructure for the geometric optimization.The optimized cell parameters are a=0.40089074 nm,c=0.40089073 nm and the optimized atomic coordinatesare Ba 1a(0.000000,0.000000,0.000000),Ti 1b(0.500000, 0.500000,0.502872),O1 1b(0.500000,0.500000,0.00276725), and O2 2c(0.500000,0.000000,0.50275432).Compared w ith the ICSD database and the previous DFT calculation in literature,31our results are verified and indicate that the LDA functional is able to describe the crystal structure.We have also tested thegeneralized gradient approximation(GGA)functionals which show slightly large lattice parameterw ith a relative difference of 1.2%,therefore,to simplify the calculation,the LDA functional was used afterwards.The tetragonal BaTiO3structure is depicted in Fig.2,inwhich eightBaatomsare located at the cornersof the celland a TiO6octahedron is located at the center.There are five types of vibrational atoms labeled from 1 to 5 constituting the BaTiO3formula.Except the O2 2c site,each structuralatom site isequivalent to one type of the vibrationalatoms:Ba 1a➝1,Ti 1b➝2,O1 1b➝3;while theO2 2c site issplit into two typesof the vibrationalatoms:4 and 5.The vibrationalmode parameters were calculated w ith the above geometrically optimized structure parameters.
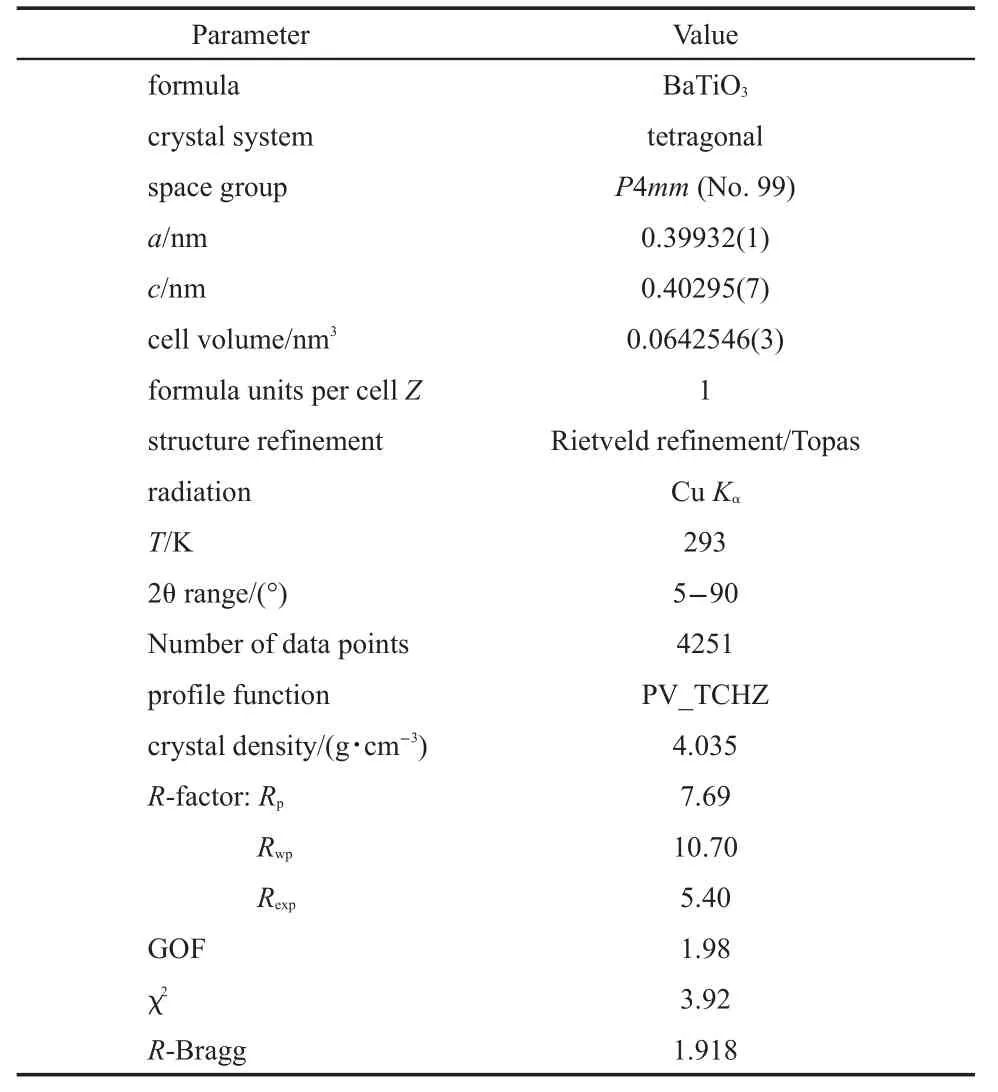
Table1 Crystallographic data of BaTiO3derived from the Rietveld refinementof XRD data

Fig.2 Tetragonalstructureof BaTiO3(color online)
BaTiO3unit cell contains 5 atoms,leading to 15 vibrational modes.Excluding 3 acousticmodes,there are12 opticalmodes. According to the group theory analysis implemented in the Billbao Crystallographic CenterWebsite(www.cryst.ehu.es),37the 12 optical vibrationalmodes of BaTiO3can be represented as follows:

where R and IR denote Raman and IRmodes,respectively,while A1and B1denote the non-degeneracymodes,E denotes the double degeneracymodes.Ifwe consider double degeneracymode E as onemode,the BaTiO3opticalvibrationalmodes include 8Raman activemodes(3A1,1B1,4E)and 7 IR activemodes(3A1,4E).In addition,another A1mode and a double degenerate E mode constitute the acoustic modes of BaTiO3.In order to make the discussion concisely,we adoptone index number to distinguish the differentmodes in the same symmetric category[e.g.4E(R,IR) modeswere represented as E(1),E(2),E(3),and E(4)],and two index numbers to distinguish each submode of the degeneracymodes [e.g.E(1)=E(11)+E(12)].For simplicity,wewould denote“the optical vibrationalmode”as“vibrationalmode”or“mode”in the follow ing context.Also,sinceweonly care about the normalmode (q=0),the“vibrationalmode”or“mode”meansnormalmode.
To further scrutinize the above vibrationalmodes,we employ the symmetry coordinates for each in-equivalent type of the vibrationalatoms.The Cartesian coordinates of the displacements foreach atom are denoted as xi,yi,and zi,where the subscript i is consistentw ith the atom number shown in Fig.2.The symmetry coordinatesare represented by the lower case letters.The different non-degenerate symmetry coordinates are distinguished by one index number,while the doubly degenerate symmetry coordinatesaredenoted by two index numbers,e.g.e(j)=e(j1)+e(j2). The(unitary)normalized transformations between the Cartesian coordinates and the symmetry coordinates are represented by equations from(2.1)to(2.15)and their vividly schematic illustrationsare shown in Fig.3.

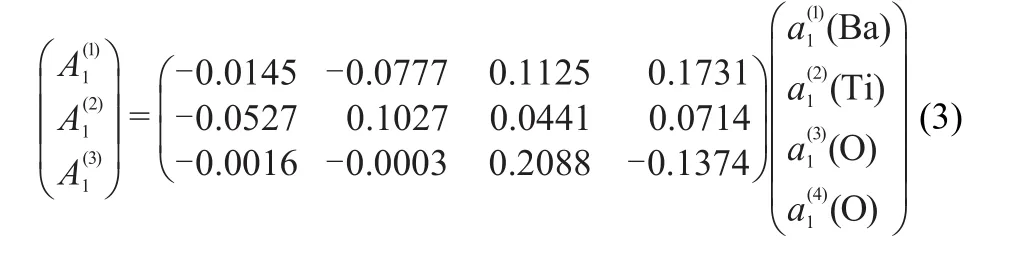
With the aid of the symmetry coordinates,the vibrational modes forboth Raman and IR active can be further represented by the linear combination w ith differently weighted symmetry coordinatesw ithin the same symmetric category,12-17shown in the transformationmatrices from(3)to(5)((5)in Scheme 1).TheA1and E modes involve the displacements of all the atoms in BaTiO3,while the B1mode refers to the displacementsof the O2 atom only.Combining all the symmetry coordinatesw ith heavier weightsand ignoring the lighterones foreach vibrationalmode, we can schematically illustrate the main feature of each vibrationalmode.All the 12modesare represented in Fig.4,inwhich the direction and length of the arrow stand for the maximum displacementof vector foreach atom.It is the same as the symmetry coordinates a1and b1thatall thenon-degeneratemodes A1and B1are polarized along z direction,while all the degenerate E modes vibrate on xy-plane consistentwith their e symmetry coordinate components.In general,the displacements of the Ba and Tiatomsare smalldue to their largermassand themovementsof the O atomsare responsible for themostof the vibrations.

Fig.3 Sketchesof the symm etry coordinates(color on line)

It isworthmentioning that the Raman and IR activemodesare mutually exclusive for thematerialsw ith centrosymmetric space groups,while for thematerialsw ith non-centrosymmetric space groups,some of the Raman and IR activemodes aremutually inclusive.38BaTiO3hasnon-centrosymmetric spacegroup(P4mm), thus its A1and E vibrationalmodesareactive forboth Raman and IR,which is quite different from thematerials we previously studied,such as Ba(Mg1/3M2/3)O3(M=Ta,Nb)(P3m1),12,13,17MgTiO3inwhich their Raman and IRmodesareexclusive due to their centrosymmetric spacegroup. In otherwords,the Raman activemodeswould be polar vibrations or non-polar vibrations,but the IR modesmust be polar ones. Fig.4 clearly shows thatboth the A1and E modesof the tetragonal BaTiO3arepolarvibrations,but the B1mode isRaman activeonly, due to itsnon-polar feature.

Scheme 1 Transformationmatrice(5)
Based on the above discussion,we know thatall themodesof BaTiO3are Raman active ones.Wemeasured Raman spectrum of the BaTiO3ceramic sample in the range from 70 to 1000 cm-1,illustrated in Fig.5,which is in a good agreementw ith other literature data for polycrystalline,microcrystalline,nanocrystalline and ceramic samplesof BaTiO3.39-46However,the feature of this spectrum isquite different from thoseof othermaterialsmeasured in our previouswork,such as Ba(Mg1/3M2/3)O3(M=Ta,Nb),12,13,17MgTiO3,14,15and Ba(Mg1/2W1/2)O3.16In our previous work,the Raman spectrahad flatbaselinesand sharp peaks[their fullwidth at halfmaximum(FWHM)was less than 30 cm-1],while the spectrum of BaTiO3has uneven baseline and broad peaks(some peaks have FWHM larger than 100 cm-1).The softmode E(1)of the tetragonal BaTiO3may affect the baseline of the spectrum,23and in thisnon-centrosymmetric spacegroup,thepolarmodes(A1and E)can be split into transverse optical(TO)modes and longitudinaloptical(LO)mode,47whichmay be the reason tow iden the peaks.
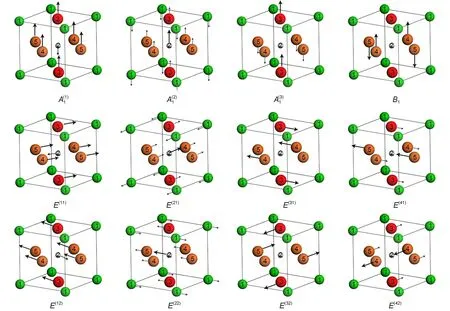
Fig.4 Sketchesof theopticalvibrationalmodes(color on line)
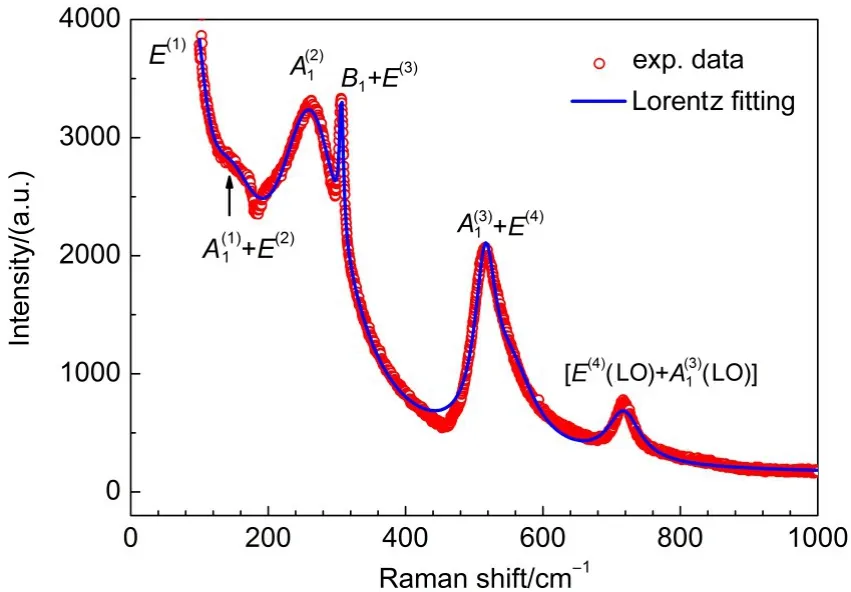
Fig.5 Raman spectrum of BaTiO3in the rangeof 70 to 1000 cm-1(color online)
The Lorentz fittingsare adopted to extract the peak frequencies and the related FWHMs in the Raman spectrum,and the fitting results are listed in Table 2.For achieving the best fitting,the Lorentziansat554.6 cm-1wasset tomimic the asymmetric shape of the peak by consulting Venkateswaran'swork.47Since our tetragonal BaTiO3sample is ceram ic disk,the anisotropy of the Ramanmodes does notperform,as the results,each Raman peak may containmore than one vibrationalmode.In thiswork,only 6 Raman peakswere obtained by our Lorentz fittings,although the tetragonal BaTiO3has8 Raman activemodes.Due to lack of spectrum data at low frequencies(<100 cm-1),the frequency position(~88 cm-1)for the softmode E(1)may have relatively large error.Since the peak shapeof the Raman spectrum isaffected by various factors,such as defects,impurities,temperature,pressure, grain size and so on,the Lorentz fitting results in Table 2may have some deviations from other literature.
According to our previous work,12-17the vibrationalmodes obtained by the DFT calculations corresponded to the related TO modes in the vibrational spectra and themode assignmentswere mainly based on themode frequency sequence given by the DFT calculations.However,due to the presence of the softmode,the mode sequence at low frequencies for BaTiO3isnotaccurate.For example,the lowest frequency obtained by our DFT calculation is122.9 cm-1corresponding to the A1mode,while in the reference,24themode with the lowest frequency(36 cm-1)showed E symmetry.A lso,amore accurate computational result from theworkof Evarestov and Bandura31indeed showsan imaginary frequency. Compared our DFT resultsw ith the Ref.31,though the detailed value is different formode frequencies,the sequence of themode frequencies is consistent.Additionally,for the tetragonal BaTiO3, the splitting of the TO and LO modesmakes the assignments more difficult.DiDomenico etal.24havemeasured the polarized Raman spectra of the single-domain tetragonal BaTiO3on differentdirections,and based on these polarized spectra,they have given quite reliable symmetric assignments to the Ramanmodes of the tetragonal BaTiO3.Therefore,we assigned all the six Raman peaksbased on the calculatedmode frequency under the restriction of themode symmetry given in DiDomenico's polarized spectra,and the resultsare represented in Table 2 and labeled in Fig.5,which are in a reasonable agreementw ith the literature reported assignments.24,39-46
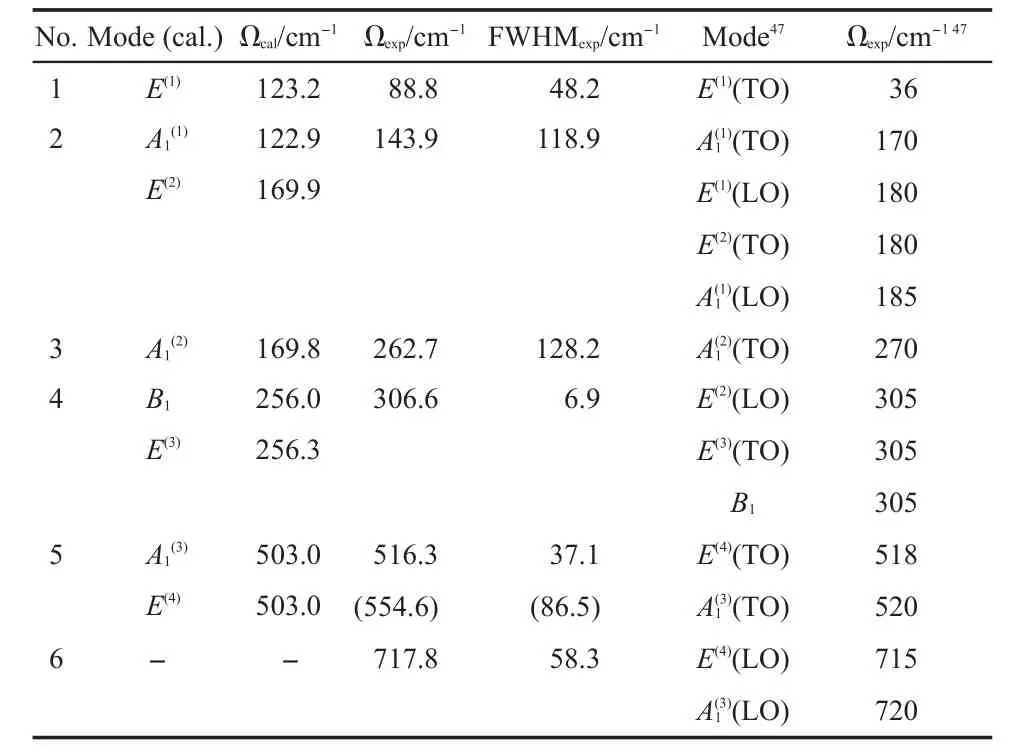
Table 2 Parametersof the Raman activemodes
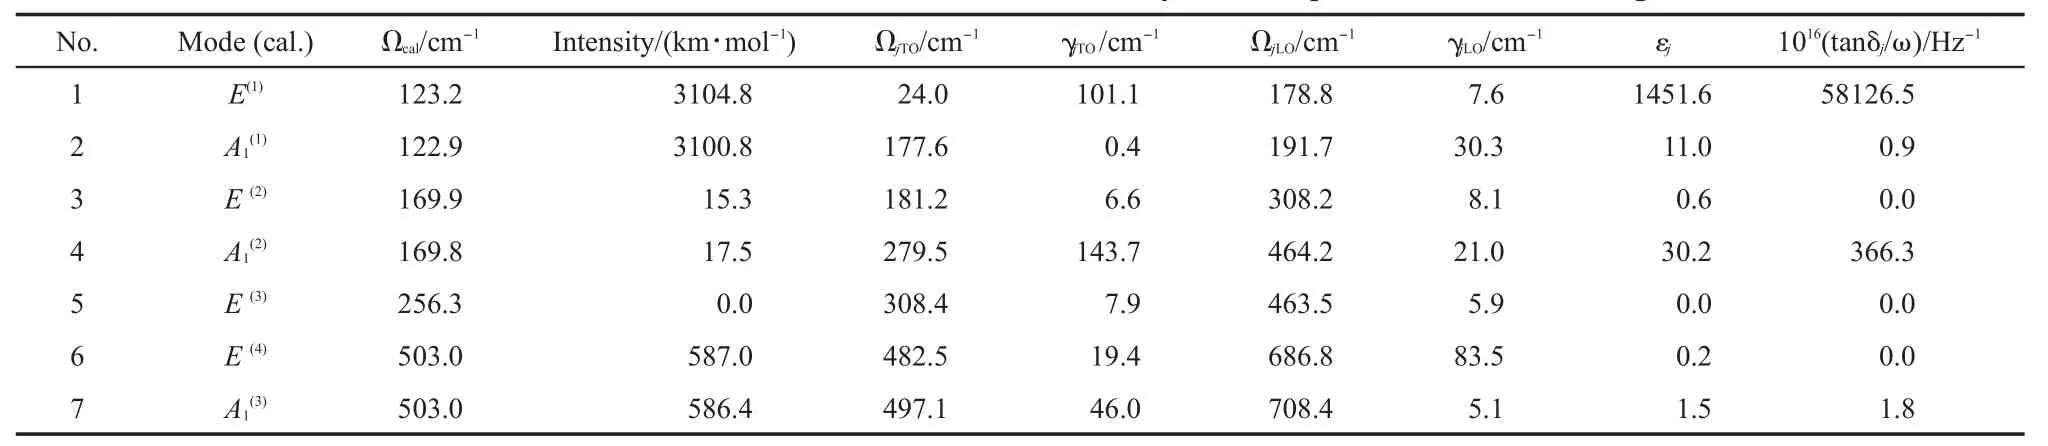
Table3 Parametersof the IR activemodesderived by the four-parametermodel fitting
According to the assignments,we can access the know ledge thathow the atoms vibrate in the real space foreachmode.The Raman-active-onlymode B1and nearly IR silentmode E(3),which have some similarity on vibrations,areassigned to the sharp peak at~306.6 cm-1.Considering the O6octahedron,the non-degeneracy B1mode can bemainly described as the O4 atoms vibrating against the O5 atomsalong z axis or thew ing-flapping vibration of the O4-O5 plane perpendicular to z axis.Since thismode shows no obvious change of the dipolemoment,it is a non IR active mode.While the double-degeneracy E(3)modemainly refers to the O3 atoms vibrating against the O4 atoms along x axisor against the O5 atoms along y axis and they also can be described as the w ing-flapping vibration of the O3-O4 plane perpendicular to x axisor thatof theO3-O4 plane perpendicular to y axis.Thismode involvesonly slightchangeof the dipolemoment,thus it results in a nearly silent IR mode(see the data in Table 3).The high frequencymodesand E(4)areassigned to the peak at516.3 cm-1, both of which also have some sim ilarity on vibrations.Themode can be described as the vibration of theO3-O3 axisagainst theO4-O5 planealong z axis in theO6octahedron;while the E(4)mode can be described as the vibration of the O5-O5 axis against the O3-O4 plane along x axisor the O4-O4 axisagainst the O3-O5 plane along y axis.
Except the B1mode,all the othermodes for the tetragonal BaTiO3are IR active ones,thus the FIR reflective spectrum isa complement of Raman spectrum for further understanding the vibrationalmodes of BaTiO3.The FIR reflective spectrum we measured is shown in Fig.6(a):themain panel shows the FIR details in the range from 100 to 1200 cm-1and the insetshows the data in them id-infrared range from 500 to 4000 cm-1,respectively.The profileof our IR reflective spectrum agreeswellw ith the data in literature for polycrystalline samples.25,48,49Moreover, themain feature of the spectrum for single crystalsamples for the tetragonal BaTiO3,nomatter whether they are polarized in ferroelectric axis or not,can be captured from that for our powder sample.23,50Taking into accountof the TO and LO splitting,the FIR reflective spectrum for the tetragonal BaTiO3is contributed by 3A1(TO)+3A1(LO)and 4E(TO)+4E(LO).
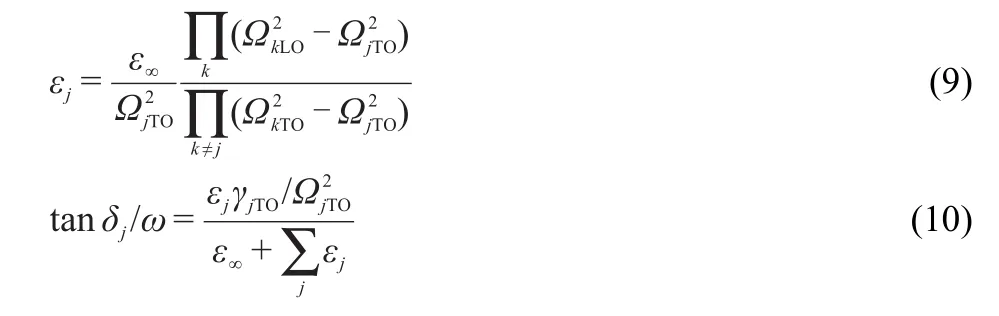
By using the FOCUS program,we fit the FIR reflective spectrum based on the FPSQ model.5In this FPSQ model,the complex dielectric function is described as:

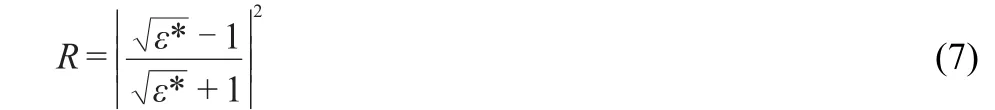
whereε∞denotes the opticalpermittivity,n is the totalnumberof the IR active vibrationalmodes,ΩjTO,γjTOandΩjLO,γjLOrepresent the frequenciesand damping factors of the j th transverse and longitudemodes of the vibrations,respectively,ωis frequency.The complex permittivityε*is related to the IR reflectivity(R),based on the follow ing Fresnelequation:
Since the peaks related to the A1and E modesare overlapped in the spectrum for our ceram ic sample,the FPSQ fitting is quite cumbersome.Itwasmentioned above thatall the A1modesvibratealong z axis and E modes are on xy-plane,thus the total reflectivity(R)can be separated into the reflectivity on xy plane(Rxy) and thatalong z axis(Rz):25

Both Rxyand Rzcan be calculated using Eq.(7)independently,as been done for the single crystal sample in literature.50Therefore, theoverlapped A1and E modes can be fitted separately.
The parameters of all the IRmodes extracted from the best fitting of the FIR reflective spectrum are listed in Table3,which are in agood agreementw ith the literature data for single crystal tetragonal BaTiO3.50In addition,the real and imaginary permittivities(ε'andε")were calculated based on themode parameters and shown in Fig.6(b)and Fig.6(c).According to themode frequenciesand intensitiesobtained by the DFT calculationsand the mode symmetry deduced from our FIR spectrum,the IR spectrum was assigned.The assignments are listed in Table 3 and also labeled in Fig.6,which arewell consistentwith theRaman spectrum assignments shown in Table 2 and Fig.5.Even the FWMHs, which are the representationsof the damping factors,are in agood agreementwith the IR and Raman data.Moreover,theassignment based on the IR spectrum has better resolution than that of the Raman one for the overlapped peaks.The assignments in this work are alsowell consistentw ith reported work.25,48,49
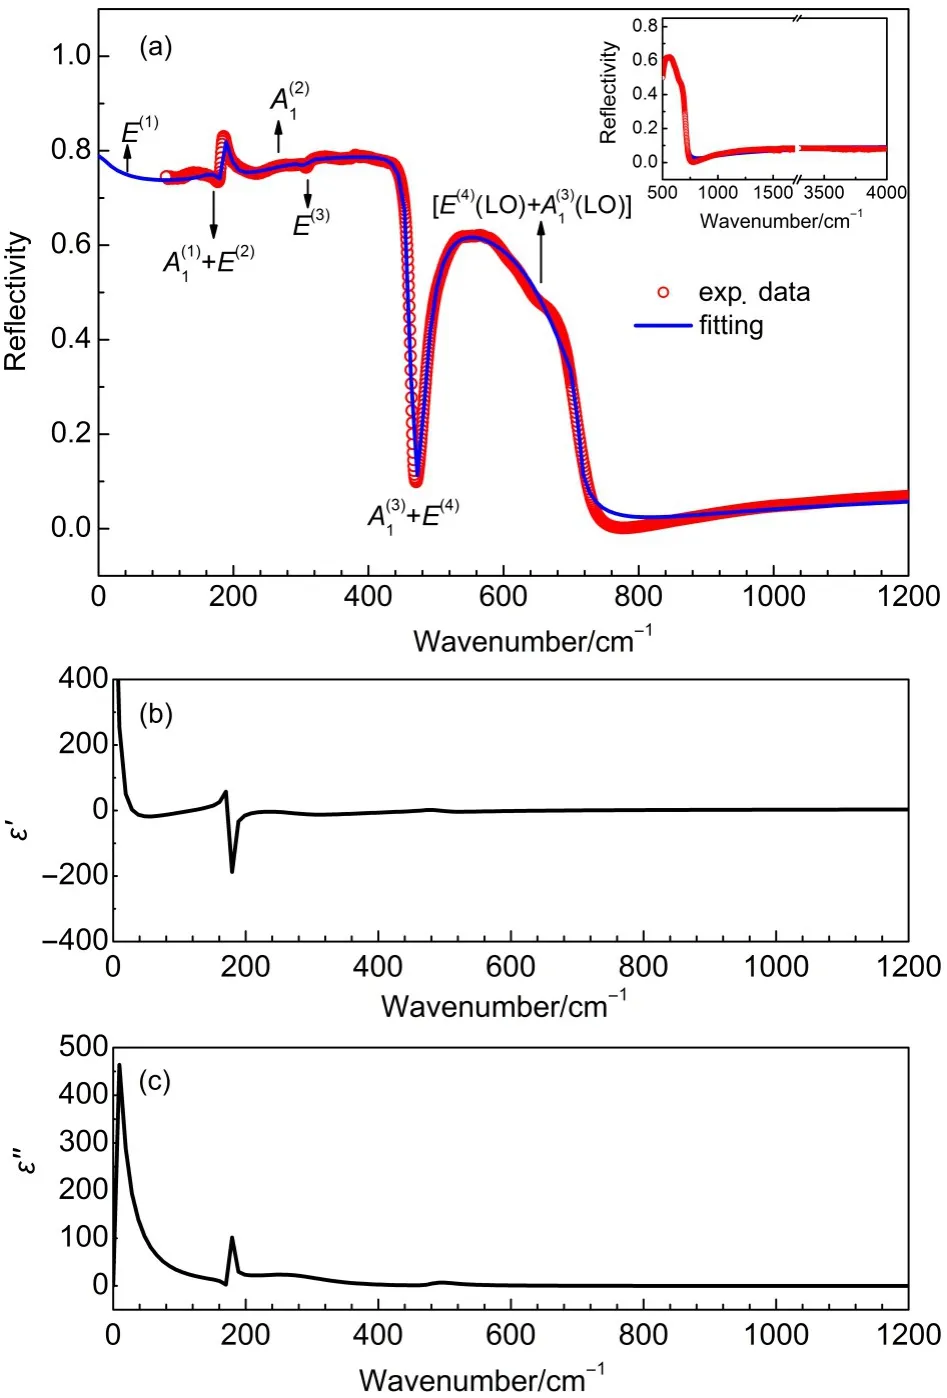
Fig.6 Fitting resu lts for the FIR reflective spectrum of BaTiO3using the four-parametermodel(a),ε'spectrum(b),andε'' spectrum(c)(color online)
The contributions of each IR active mode to the dielectric properties(permittivityεjand dielectric loss tanδj/ω)in themicrowave frequency range can be calculated by the follow ing equations:51,52
The calculated results are listed in Table 3.The data indicate that the E(1)mode at the lowest frequency has the largest contributions to bothεjand tanδj/ω,severalmagnitudes larger than other modes.Except the abnormal E(1)mode,εjand tanδj/ωfor the other modes have the sim ilar values tomost ceram icmaterial.Comparatively,themode at279.5 cm-1have relatively large valuesofεj,to all the restmodes.
As shown in Fig.4,the soft E(1)mode can be described as the vibration of the O6octahedral cage against the inner Tiatom almostalong x or y axis in the TiO6octahedron,which gives rise to a significantdipolemoment change and leads to huge dielectric permittivityεj.Quite similar to E(1)mode,themode can also be considered as the vibration of the O6octahedral cage against the inner Tiatom,but it is along z axis instead of xy plane.The vibration of the mode,another large contributor toεjand tanδj/ω, can be viewed as the vibration of the TiO6octahedron againstBa atom along z axis.The E(2)mode,a less contributor to the dielectric properties,has similarly vibrational pattern to the mode,but the vibration of the TiO6octahedron againstBa atom on xy plane.
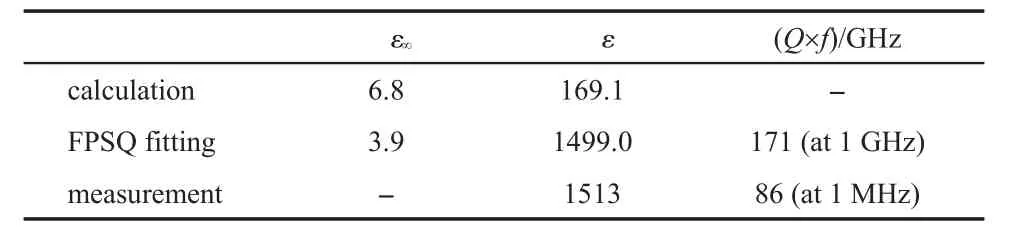
The dielectric property parameters,such as the optical permittivityε∞,the static permittivityε,and the quality factor Q×f can be obtained notonly from the FPSQ fittings,butalso from the DFT calculations,and the microwave or the AC impedance measurements,which are comparatively listed in Table 4.By the FPSQ fitting data,ε∞was calculated fromε∞(xy)andε∞(z)follow ing the equation(11),εand Q×f of BaTiO3were calculated by the equations(12,13),respectively.

For the DFT first-principles calculation,the values ofε∞andε were obtained based on pure mechanical phonon information which contains no splitting of TO and LO.Due to the large di-electric loss,themicrowavemeasurementswere failed because of absence of the resonance peak.Themeasured dielectric parameters listed in Table 4were obtained by the AC impedancemeasurements.
Tab le4 Dielectric property param etersdeduced from the variousmethods
The data in Table4 indicates that the valuesof the permittivity obtained by the FPSQ fitting and ACmeasurementare in a good agreement w ith each other.The perm ittivity of the tetragonal BaTiO3ismuch larger than that of non-ferroelectricmaterials (usually it is less than 200),thus BaTiO3is considered as the ferroelectrics.The large permittivity ismainly contributed by the E(1)softmode,and the A1(1)modealso hasquite large contribution. These twomodesactually are degenerated from the F1usoftmode of thehigh temperature cubic BaTiO3,which controls the cubictetragonal phase transition of BaTiO3.With a decrease of temperature to the phase transition temperature(or Curie temperature),the vibration of the triple degeneracy F1umode along z axis is partially frozen and themode is separated to themode and the E(1)mode,which cause the ferroelectric featuresof BaTiO3:(i) the appearance of the A1(1)mode leads to the crystal polarization along the c direction(z axis);(ii)the E(1)mode keeps itssoftmode behavior corresponding to the large perm ittivity on the a or b direction(x or y axis).These featuresare consistentw ith the dielectric propertiesmeasured for the single crystal sample of Ba-TiO3in early time.50,53The permittivity obtained by the DFT calculation is clearly larger than the values calculated for the nonferroelectricmaterials(<100),13,14,16,17which indicates that the DFT calculations can reveal the ferroelectric characters of thematerials.However,the calculated permittivity ismuch less than the FPSQ fitting value and the ACmeasured value.Aswe know,the large perm ittivity ismainly contributed by the E(1)softmode,it is thought that the error is large for the CASTEP package to deal with the softmodes.Since themicrowavemeasurements(in GHz) are notapplied,the datameasured in MHz are listed in Table 4. For the Q×f,the FPSQ fitting gave the value at GHz,which is related to the anharmonic vibration of the lattice;while the AC measurement gave the value at MHz,which corresponds to conductance of charge carriers.53,54We cannotmake comparison between the two Q×f values in Table 4,but it can be seen that these two valuesaremuch smaller than those for the non-ferroelectricmaterials(>105GHz)we previously studied.12-17Although the ferroelectricmaterialshave an advantageof large permittivity, they also havea disadvantageof large dielectric loss.
4 Conc lusions
BaTiO3ceram ic disk was synthesized and sintered by using conventional solid state reactions at1400°C for 4 h.The pure tetragonalphaseof the disk was confirmed by the XRD data refinement.Based on the group theory analysis,the symmetry coordinates of the tetragonal BaTiO3were obtained and all the vibrationalmodes were presented by the linear combinations of symmetry coordinates.The A1and E modesare both Raman and IR active,while the B1mode is Raman active only.The Raman and the FIR reflective spectrameasured in thiswork were fitted by Lorentz function and the FPSQmodel,respectively,and the assignmentsof these vibrational spectrawere conducted based on the DFT calculationsandwith theassistanceof the literature data. For the assignments,the TO and LO splittingsof the polarmodes were considered.The E(1)softmode at the lowest frequency can be described as the vibration of the Tiatom againstO6octahedral cage in the TiO6octahedron on xy plane,which is themostcontributingmode to the large permittivity and dielectric loss.Themodehas the similar vibrational feature to the E(1)mode,but it is along z axis,and it is correlated to the crystalpolarization along z axis.Raman-active-only B1mode can be viewed as thew ingflapping vibration of the O4-O5 plane perpendicular to z axis in the O6octahedron.Both theand E(1)modes are degenerated from the triple degeneracy F1umodeof the cubic BaTiO3.Though the DFT calculation causes some errors for dealing w ith soft mode,itstillservesa good reference to understand the characters of the vibrationalmodes and themechanism of dielectric propertiesof thematerials.
(1)Moulson,A.J.;Herbert,J.M.Electroceramics;Chapman and Hall:London,1990;pp 182-241.
(2)Vanderah,T.A.Science 2002,298,1182.doi:10.1126/ science.1078489
(3)Petzelt,J.;Kozlov,G.V.;Volkov,A.A.;Ishibashi,Y.Zeitschrift Fur Physik B-Condensed Matter1979,33,369.
(4)Wakino,K.;Murata,M.;Tamura,H.J.Am.Ceram.Soc.1986, 69,34.doi:10.1111/jace.1986.69.issue-1
(5)Gervais,F.;Piriou,B.Phys.Rev.B 1974,10,1642.doi:10.1103/ PhysRevB.10.1642
(6)Fukuda,K.;Kitoh,R.;Awai,I.J.Am.Ceram.Soc.1994,77, 149.doi:10.1111/jace.1994.77.issue-1
(7)Qin,N.;Fan,X.C.;Wu,S.Y.;Chen,X.M.J.Appl.Phys.2007, 101,0641036.
(8)Fan,X.C.;Mao,M.M.;Chen,X.M.J.Am.Ceram.Soc.2008, 91,2917.doi:10.1111/jace.2008.91.issue-9
(9)Zheng,C.W.;Fan,X.C.;Chen,X.M.J.Am.Ceram.Soc. 2008,91,490.doi:10.1111/jace.2008.91.issue-2
(10)Chen,Y.C.;Cheng,H.F.;Liu,H.L.;Chia,C.T.;Lin,I.N. J.Appl.Phys.2003,94,3365.doi:10.1063/1.1597969
(11)Lin,I.N.;Chia,C.T.;Liu,H.L.;Cheng,H.F.;Freer,R.; Barw ick,M.;Azough,F.J.Appl.Phys.2007,102,0441124.
(12)Wang,C.H.;Jing,X.P.J.Am.Ceram.Soc.2009,92,1547.doi: 10.1111/jace.2009.92.issue-7
(13)Wang,C.H.;Liu,G.H.;Jing,X.P.;Tian,G.S.;Lu,X.;Shao,J. J.Am.Ceram.Soc.2010,93,3782.doi:10.1111/jace.2010.93. issue-11
(14)Wang,C.H.;Kuang,X.J.;Jing,X.P.;Lu,J.;Lu,X.;Shao,J. J.Appl.Phys.2008,103,074105.doi:10.1063/1.2903913
(15)Wang,C.H.;Jing,X.P.;Feng,W.;Lu,J.J.Appl.Phys.2008, 104,034112.doi:10.1063/1.2966717
(16)Diao,C.L.;Wang,C.H.;Luo,N.N.;Qi,Z.M.;Shao,T.;Wang, Y.Y.;Lu,J.;Shi,F.;Jing,X.P.J.Am.Ceram.Soc.2013,96, 2898.doi:10.1111/jace.12429
(17)Diao,C.L.;Wang,C.H.;Luo,N.N.;Qi,Z.M.;Shao,T.;Wang, Y.Y.;Lu,J.;Wang,Q.C.;Kuang,X.J.;Fang,L.;Shi,F.;Jing, X.P.J.Appl.Phys.2014,115,114103.doi:10.1063/1.4868226
(18)Scott,J.F.Ferroelectric Memories;Springer:Berlin,2000.
(19)Waser,R.Nanoelectronicsand Information Technology: Advanced Electronic Materialsand NovelDevices;W iley-VCH:Weinheim,2003.
(20)Slater,J.C.Phys.Rev.1950,78,748.doi:10.1103/ PhysRev.78.748
(21)Devonshire,A.F.Phil.Mag.(Series7)1949,40,1040.doi: 10.1080/14786444908561372
(22)Anderson,P.W.Phys.Rev.1950,78,341.
(23)Luspin,Y.;Servoin,J.L.;Gervais,F.J.Phys.C:Solid State Phys.1980,13,3761.doi:10.1088/0022-3719/13/19/018
(24)DiDomenico,M.;Wemple,S.H.;Porto,S.P.S.;Bauman,R.P. Phys.Rev.1968,174,522.doi:10.1103/PhysRev.174.522
(25)Wada,S.;Yasuno,H.;Hoshina,T.;Kakemoto,H.;Kameshima, Y.;Tsurum i,T.;Shimada,T.J.Eur.Ceram.Soc.2006,26, 1807.doi:10.1016/j.jeurceramsoc.2005.09.091
(26)Xie,Y.;Yu,H.T.;Zhang,G.X.;Fu,H.G.;Sun,J.Z.J.Phys. Chem.C 2007,111,6343.doi:10.1021/jp0658997
(27)Rakotovelo,G.;Moussounda,P.S.;Haroun,M.F.;Legare,P.; Rakotomahevitra,A.;Rakotomalala,M.;Parlebas,J.C.Surf. Sci.2009,603,1221.doi:10.1016/j.susc.2009.03.006
(28)Borstel,G.;Eglitis,R.;Kotomin,E.;Heifets,E.J.Crystal Grow th 2002,237,687.
(29)Dawson,J.A.;Harding,J.H.;Chen,H.;Sinclair,D.C.J.Appl. Phys.2012,111,094108.doi:10.1063/1.4711099
(30)Evarestov,R.A.;Bandura,A.V.;Kuruch,D.D.J.Comput. Chem.2013,34,175.doi:10.1002/jcc.23115
(31)Evarestov,R.A.;Bandura,A.V.J.Comput.Chem.2012,33, 1123.doi:10.1002/jcc.v33.11
(32)Karlsruhe,A.TOPASV3.1:General Profile and Structure Analysis Software for PowderDiffraction Data;BrukerAXS Inc:Karlsruhe,2005.
(33)Hakki,B.W.;Coleman,P.D.IEEE Trans.M icrowave Theory Tech.1960,8,402.doi:10.1109/TMTT.1960.1124749
(34)Courtney,W.E.IEEETrans.Microwave Theory Tech 1970,18, 476.doi:10.1109/TMTT.1970.1127271
(35)Segall,M.D.;Lindan,P.J.D.;Probert,M.J.;Pickard,C.J.; Hasnip,P.J.;Clark,S.J.;Payne,M.C.J.Phys.:Condes. Matter.2002,14,2717.
(36)Xiao,C.;Jin,C.;Wang,X.Mater.Chem.Phys.2008,111,209. doi:10.1016/j.matchemphys.2008.01.020
(37)Kroumova,E.;Aroyo,M.I.;Perez-Mato,J.;Kirov,A.;Capillas, C.;Iyantchev,S.;Wondratschek,H.Phase Transitions2003,76, 155.
(38)Poulet,H.;Mathieu,J.P.Vibration Spectra and Symmetry of Crystals,1sted.;Science Publishers Ltd.:Elk Grove Village, 1976;pp 127-273,475-545.
(39)Hoshina,T.;Kakemoto,H.;Tsurum i,T.;Wada,S.;Yashima,M. J.Appl.Phys.2006,99,054311.doi:10.1063/1.2179971
(40)Cho,W.S.;Hamada,E.J.Alloy.Compd.1998,266,118.doi: 10.1016/S0925-8388(97)00446-5
(41)Naik,R.;Nazarko,J.J.;Flattery,C.S.;Venkateswaran,U.D.; Naik,V.M.;Mohammed,M.S.;Auner,G.W.;Mantese,J.V.; Schubring,N.W.;M icheli,A.L.;Catalan,A.B.Phys.Rev.B 2000,61,11367.doi:10.1103/PhysRevB.61.11367
(42)Hayashi,H.;Nakamura,T.;Ebina,T.J.Phys.Chem.Solids 2013,74,957.doi:10.1016/j.jpcs.2013.02.010
(43)Li,R.J.;Wei,W.X.;Hai,J.L.;Gao,L.X.;Gao,Z.W.;Fan,Y. Y.J.Alloy.Compd.2013,574,212.doi:10.1016/j. jallcom.2013.04.203
(44)Yuzyuk,Y.Phys.Solid State 2012,54,1026.doi:10.1134/ S1063783412050502
(45)Zhang,W.H.;Chen,L.;Tao,Y.T.;Zhang,W.H.;Chen,J.; Zhang,J.X.Physica B:Condensed Matter2011,406, 4630.doi:10.1016/j.physb.2011.09.046
(46)Pavlovic,V.P.;Krstić,J.;Šćepanović,M.J.;Dojčilović,J.; M inić;Blanuša,J.;Stevanović,S.;M itić,V.;Pavlović,V.B. Ceramics International2011,37,2513.doi:10.1016/j. ceramint.2011.03.064
(47)Venkateswaran,U.D.;Naik,V.M.;Naik,R.Phys.Rev.B 1998, 58,14256.doi:10.1103/PhysRevB.58.14256
(48)Ostapchuk,T.;Petzelt,J.;Savinov,M.;Buscaglia,V.;M itoseriu, L.Phase Transitions2006,79,361.doi:10.1080/ 01411590600892047
(49)Spitzer,W.G.;M iller,R.C.;Kleinman,D.A.;Howarth,L.E. Phys.Rev.1962,126,1710.doi:10.1103/PhysRev.126.1710
(50)Servoin,J.L.;Gervais,F.;Quittet,A.M.;Luspin,Y.Phys.Rev. B 1980,21,2038.doi:10.1103/PhysRevB.21.2038
(51)Dias,A.;Paschoal,C.W.A.;Moreira,R.L.J.Am.Ceram.Soc. 2003,86,1985.doi:10.1111/jace.2003.86.issue-11
(52)Lage,M.M.;Matinaga,F.M.;Gesland,J.Y.;Moreira,R.L. J.Appl.Phys.2006,99,0535105.
(53)Kingery,W.D.;Bowen,H.K.;Uhlmann,D.R.Introduction to Ceramics,2nd ed.;JohnWiley&Sons:New York,1976;pp 939,968-969.
(54)Kuang,X.;Jing,X.;Tang,Z.J.Am.Ceram.Soc.2006,89, 241.doi:10.1111/jace.2006.89.issue-1
AssignmentforVibrationalSpectraofBaTiO3Ferroelectric CeramicBasedontheFirst-PrinciplesCalculation
ANWei1LIUTian-Hui2,3WANGChun-Hai2DIAOChuan-Ling2LUONeng-Neng2LIUYong2,3QIZe-Ming4SHAOTao4WANGYu-Yin4JIAOHuan3TIANGuang-Shan1,*JINGXi-Ping2,*
(1SchoolofPhysics,PekingUniversity,Beijing100871,P.R.China;2StateKeyLaboratoryofRareEarthMaterialsChemistry andApplications,CollegeofChemistryandMolecularEngineering,PekingUniversity,Beijing100871,P.R.China;3KeyLaboratoryofMacromolecularScienceofShaanxiProvince,CollegeofChemistryandChemicalEngineering, ShaanxiNormalUniversity,Xi'an710119,P.R.China;4NationalSynchrotronRadiationLaboratory, UniversityofScienceandTechnologyofChina,Hefei230029,P.R.China)
ABaTiO3ceramicwassynthesizedusingaconventionalsolid-statereaction,andsinteredat1400°C for4h.ThepuretetragonalphasewasconfirmedbyRietveldrefinementoftheX-raydiffractiondata.The Ramanspectrumandthefarinfrared(FIR)reflectivespectrumwereobtainedandanalyzedusingLorentzfitting andthefour-parametersemi-quantummodelfitting,respectively.TheRamanandFIRspectrawereassigned basedonfirst-principlescalculations,andconsiderationofthesplittingofthetransverseopticalmodesand longitudinalopticalmodes.Allthevibrationalmodeswererepresentedbylinearcombinationsofthesymmetry coordinatesdeducedbygrouptheoryanalysis.Amongthe12opticalmodes,theRaman-active-onlymode,B1, canbeviewedasthewing-flappingvibrationoftheO4-O5planeperpendiculartothez-axisintheO6octahedron.TheA1(1)modeandtheE(1)softmodearesplitbythetriplydegenerateF1umodeofcubicBaTiO3,resultingintheferroelectricpropertyoftetragonalBaTiO3.TheappearanceoftheA1(1)modeleadstocrystal polarizationalongthez-axisandtheE(1)modecausesthelargepermittivity.Thesetwomodescanbedescribed asvibrationoftheTiatomagainsttheO6octahedralcagealongthez-axis[A1(1)]andonthexy-plane[E(1)].
First-principlescalculation;Ramanmode;IRmode;Dielectricproperty
O649
icle]
10.3866/PKU.WHXB201504144 www.whxb.pku.edu.cn
Received:February14,2015;Revised:April12,2015;PublishedonWeb:April14,2015.
∗Correspondingauthors.TIANGuang-Shan,Email:tiangs@pku.edu.cn;Tel:+86-10-62754231.JINGXi-Ping,Email:xpjing@pku.edu.cn; Tel:+86-10-62754188.
TheprojectwassupportedbytheNationalNaturalScienceFoundationofChina(21071009,21371015).
国家自然科学基金(21071009,21371015)资助项目
©EditorialofficeofActaPhysico-ChimicaSinica