氧气在碱溶液中结构与扩散系数的分子动力学模拟
2015-12-29吕页清郑诗礼王少娜
吕页清 郑诗礼 王少娜 杜 浩 张 懿
(1中国科学院过程工程研究所,湿法冶金清洁生产技术国家工程实验室,绿色过程与工程重点实验室,北京100190;2中国科学院大学,北京100049)
氧气在碱溶液中结构与扩散系数的分子动力学模拟
吕页清1,2郑诗礼1王少娜1杜 浩1,*张 懿1
(1中国科学院过程工程研究所,湿法冶金清洁生产技术国家工程实验室,绿色过程与工程重点实验室,北京100190;2中国科学院大学,北京100049)
采用分子动力学方法对不同温度(25-120°C)及碱浓度(1:100-1:5,摩尔比)下NaOH和KOH溶液中的氧气进行了模拟.本文考察了NaOH及KOH溶液中溶剂-溶剂、氧气-溶剂及氧气-溶质的径向分布函数,并采用爱因斯坦方程从均方位移曲线中计算得到了氧气及溶质离子的扩散系数.结果显示随着碱浓度的升高,氧气扩散系数逐渐减少;在相同条件下,氧气在NaOH溶液中扩散系数小于在KOH溶液中的扩散系数;溶质离子扩散系数的变化规律与氧气一致.通过与现有实验结果对比,发现了分子动力学方法的可靠性及用于研究实验受限领域的优越性.
分子动力学模拟;氧气;NaOH;KOH;扩散系数
Received:December 24,2014;Revised:April7,2015;Published onWeb:April7,2015.
∗Corresponding author.Email:hdu@ipe.ac.cn;Tel:+86-15011585837.
The projectwassupported by the NationalNaturalScience Foundation of China(51274179)and National Key Basic Research Program of China (973)(2013CB632601).
国家自然科学基金(51274179)和国家重点基础研究发展规划项目(973)(2013CB632601)资助
©Editorialoffice of Acta Physico-Chimica Sinica
1 In troduc tion
Diffusion of oxygen in alkaline solution isof greatsignificance in many processes.For example,the diffusion of oxygen in alkaline solution isan importantconsideration in designing alkaline full cells,in which the current is usually lim ited by diffusion of the reacting gas through theelectrolyte phase to active siteson the surface of the electrode.1,2Also,the self-diffusion coefficientof oxygen,an importantoxidizing agent inmany alkaline leaching processes,3-6is crucial in controlling the thermodynam ics and kinetics of the oxidation of metal compounds.7However,systematicmeasurement of oxygen diffusion in alkaline solutions over an extended temperature and concentration range is quite limited.2The diffusion coefficientof dissolved gases in electrolyte solution can be estimated by the empirical formula,amodification of the Eyring absolute reaction rate theory,proposed by the Ratcliff and Holdcroft.8
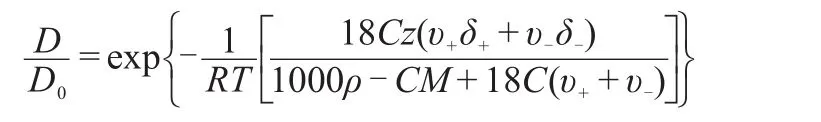
where D and D0are the diffusion coefficients in the electrolyte solution and purewater,respectively.R is the gas constantand T is the temperature of the solution.v+and v-are the numbers of positive and negative ionspermole of electrolyte,C ismolarity of electrolyte,M iselectrolytemolecularweight,ρis density,z is the number of particlesw ith which a gasmolecule interacts,and δ+andδ-are freeenergy perturbation parameters characteristic of the ionsand the dissolved gas.This theory hasbeen found to be viable for several simple gas-electrolyte systems at low concentrations,8,9but failsathighmolarities,10due to the dramatic change of physiochemicalproperties of concentrated electrolyte solutions, creating significantdeviations.
It is known that the solubility of oxygen in alkaline solution is quite low,therefore,the direct experimental measurement of diffusion coefficients isquite challenging.Up to date,only limited resultshave been reported,1,2,7,10-12andmostof these resultswere focused on theself-diffusion coefficientofoxygen at25°C.Tham etal.10have obtained the diffusion coefficientof oxygen in KOH solution foraw ider range of temperature(25-100°C).However, they noticed thatw ith the increase of temperature,the concentration of dissolved oxygen became too low to be accurately measured.Meanwhile,the diffusivity of O2in alkaline solution at temperature above 100°C hasnotbeen reported.Further,mostof the experiments are conducted in the KOH solutions,and fewer have been focused on NaOH solutions over an extended temperature and concentration range,and obtaining such datawould provide valuable information of researcherworking in relevant subjects.
With the fast increase in computational power,molecular modeling isbecoming an attractiveapproach for studying transport properties in regions where experimental data are not available or difficult to be obtained.And molecular dynam ics (MD)simulation isa fundamental tool thatcan be used to explore water/water,water/ion,and ion/ion interactions,which is central to understand the transport properties.For example,Thapa and Adhikari13simulated the binary m ixture of oxygen gas and extended simple point charge(SPC/E)waterw ith oxygen as solute andwateras solventatdifferent temperatures288,293,298,302, and 306 K usingmolecular dynam ics simulation.Self-diffusion coefficients of both the solvent and the solute had been determ ined and were found to agree wellw ith experimental results. Takeuchiand Okazaki14calculated the self-diffusion coefficients of O2and N2in amorphous polyethylene and at temperatures of 250 to 300 K above glass transitionsof the systems.Behaviorof themodels obtained w ithin the time scale of usualMD simulations agreeswellw ith experimentalobservations for amorphous polymers above glass transition temperatures.Muller-Plathe et al.15obtained coefficients for the diffusion of the penetrantmolecules,including CO2,O2,and N2,in polypropylene from their mean-square displacements(MSDs).The agreementw ith experimental results,where available,is satisfactory.A relation between the penetrant's diffusion coefficient and its size frequently observed in experiments is confirmed.Surprisingly,little work has been done on the diffusion coefficient of oxygen in NaOH and KOH solutions over an extended temperature and concentration range,especially in view of thew ide application of oxygen diffusivity inmany fields.Therefore,the propertiesof the oxygen in the concentrated alkali hydroxide solutions w ill be studied in this paperby usingmolecular dynam ics simulation.
In the presentpaper,the interactionsbetween oxygenmolecules and other species in alkaline solutionshave been systematically examined and discussed based on MSD analysis results.Further, the self-diffusion coefficientsof oxygen in concentrated solutions at25,60,100,and 120°C,have been calculated to provide supplementary reference to understand the physiochemicalbehavior of oxygen in alkaline solutions.
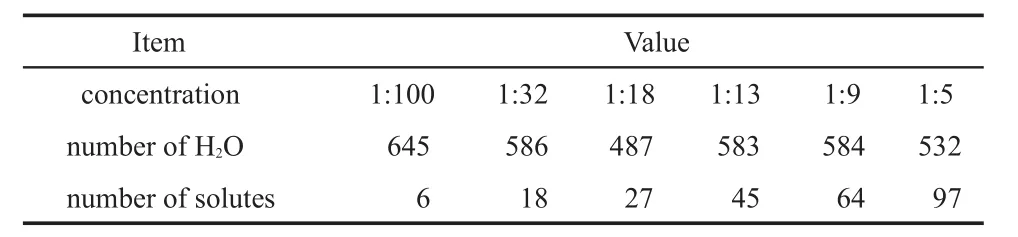
Table1 Concentration and number of solventand solute m oleculesused in the sim ulation
2 Sim u lation details
DL_POLY_214 program16was used for the simulation.The behavior of oxygenmolecules in NaOH and KOH solutionsw ith different concentrations has been exam ined.The number of moleculesused in thesimulations is reported in Table1.Forbetter statistics average,six oxygenmolecules have been put into the simulation box.The SPC/E watermodel was used.The intermolecular interaction between particles has been approximated by the Lennard-Jones interaction and electrostatic interaction expressed as:

where,qiand qjare the charges of i th and j th atom(or ion),respectively;rijis the distance between the i thmoleculeand the j thmolecule,andσandεare the size parameter and energy parameter,respectively.The parameters for theO2,17-20NaOH,and KOH solution are listed in the Table 2.The potential parameters for unlike pairsare expressed via the Lorentz-Berthelotmixing rules:

Table2 Lennard-Jonesparameters(ε,σ),atom icmasses(m),and fractionalcharges(q)used in the sim u lation

Each simulationwas firstequilibrated ata NPT assembly w ith the pressure fixed at0.1MPa.Berendsen thermostatand barostat were used w ith time constants of 0.01 and 0.5 ps,respectively. The Ewald sum was used to account for the electrostatic interactions.The Leapfrogmethodwith a time step of 1 fswasused to integrate the particlemotion.A total simulation time of 500 ps including a 200 psequilibration period was performed.
For the calculation of radial distribution function(RDF)and estimation of self-diffusion coefficients,NVT(constantvolume and temperature)simulations were carried outw ith minimum simulation time of 1 ns after initial NPT(constantpressure and temperature)equilibration.The Berendsen thermostat was retained,but Berendsen barostatwasw ithdrawn.The electrostatic and Lennard-Jones cut-off parameterswere retained at0.9 nm. The initial velocitiesof particleswere taken from the laststep of the equilibration simulation.The density and temperature of the system were,therefore,fixed.The final resultswere analyzed for a further simulation of 800 psafter theequilibration period.

Fig.1 gOW-OW(r)functions for all the investigated concentrations in NaOH and KOH solutionsat25°C
3 Resu lts and d iscussion
3.1Radialdistributionfunction
Structure of fluid isusually determined by the pair distribution function.21In thisstudy,the pair distribution functionshavebeen evaluated in terms of radial distribution function.Five different RDFs,namely gO-O(r),gO-OW(r),gO-OH(r),gO-Na/K(r),and gOW-OW(r)have been evaluated in NaOH and KOH solutions,respectively.gO-O(r) is the RDF between centers ofmass of the oxygenmolecules, which isused to study the interaction between oxygenmolecules w ithin the simulation box.Similarly,gOW-OW(r)is the distribution function between the centers of thewatermolecules determining the structure of the solventand the interaction between the solvent molecules.Finally,gO-OW(r),gO-OH(r),and gO-Na/K(r)are expected to reveal the interaction of watermolecules,hydroxide ions,and cationsaround an oxygenmolecule,respectively.
The gOW-OW(r)in NaOH and KOH solutions at25°C are shown in Fig.1.From Fig.1,it can be seen that thew idth and heightof the firstpeaks decreaseas the concentration rises,indicating that the hydration numberofwatermolecules,which can be obtained by integrating the RDF from r=0 nm to the firstminimum in RDF, decreasesw ith the increase in concentration.In solutions,water molecules form hydration shells around the ions,the hydration number of K+and Na+in dilute solution is6.3-7.8 and close to 6,22-28respectively.As the number of ions increases,morewater moleculesw illbe engaged in the hydration shellof ions.Therefore,therew illbe fewerwatermolecules left to form the H-bond (HB)network in KOH solutionwhen the numberof K+ionsand Na+ions is equal,resulting in themore significant decrease in w idth and heightof the firstpeaks in KOH solutions in comparison w ith thatof NaOH solutions(see Fig.1).Such phenomena havealso been found atother investigated temperatures.
Further analysis of Fig.1 reveals that regardless of NaOH or KOH solutions,the distance of second peakmoves to shorter distances in comparison w ith pure water.In pure water the gOW-OW(r)function is characterized by a firstneighboring peak at about 0.28 nm,followed by a second peak at about 0.45 nm,17which is due to the presence of an extended tetrahedralHB network.However,it is reported thatupon application of an external pressure,the position of the second peak w illmove to shorter distances due to the distortion of the HB network and eventually the collapseof the second neighboring shell.19,29,30Thisphenomenon hasbeen beautifully confirmed by X-ray diffraction studies,30,31and the results suggested that the higher the pressure,the shorter the second peak distance.In anotherword,the position of the second peak can be used to describe the extent of thewater hydrogen bond network distortion.From Fig.1,in comparisonw ith NaOH solutions,the second peaks of the gOW-OW(r)moves to shorter distances in the presence of K+ions,suggesting that larger cations aremore efficient in destroying thewater HB network,facile the diffusion of both ions and solvent.Such observation can be explained by considering the size of cations in the solutions.It is known that K+is a large cation and behavesmore like a hydrophobic particle,32creating stronger repulsive force on the sur-roundingwatermolecules,which resembles the effectof external pressure to some extent.Therefore,in KOH solution,the position of the second peak w illmove to shorter distances.Such phenomenon hasalso been reported by EPSR(the Empirical Potential Structure Refinement code)simulationsand ab initio simulations in the study of NaOH and KOH aqueous solutions.17,33
However,it isworthmentioning that the solute concentrations investigated are very high thata largenumberofwatermolecules areengaged in thehydration shellof the cation or theanion,and none of them can be truly considered as belonging to the second or third hydration shellofwater H-bonding network.
Fig.2 shows thewater-water partial radialdistribution functions at the concentration of 1:5(solute:solvent,molar ratio)in NaOH and KOH solutions under different temperatures.As expected, when the temperature rises,the solventw ill become less structured as can be seen in the RDFs shown in Fig.2.Analysisof g(r) indicates that the heightof all the firstpeaks decreasesgradually as the temperature increases from 25 to 120°C.Thisphenomenon was reported in reference,34in which a NPT ensemble classical molecular dynamics simulation ofwater in liquid state for several valuesof temperature hasbeen carried out.Furtheranalysisof the RDFsalso indicates that the position of the firstpeaksmoves to larger distance.When the temperature is raised up to 120°C,the position of the first peaksmoves to about0.29 nm in NaOH solutions and about 0.31 nm in KOH solution,suggesting that as temperature increases,the solvent in KOH solution becomes less structured,which w ill enhance the mobility of both ions and solventconsequently.

Fig.2 gOW-OW(r)functions for all the investigated temperatures in NaOH and KOH solutionsat the concentration of 1:5 (molar ratio of solute to solvent)
The distributions between oxygenmolecules,gO-O(r),forall the investigated concentrations at25°C are shown in Fig.3.From Fig.3,it can be seen that the height of the first peaks increase obviously w ith the increase of solution concentration,regardless of NaOH or KOH solutions.This suggests that as the concentration increases,more hydrophilic ions are present,repelling the hydrophobic oxygen molecules.Consequently,the oxygen moleculeshave the tendency to form aggregate,resulting in possible decrease in themobility.Further analysisof the RDFs indicates that the heightsand w idthsof the firstpeaks vary less significant in KOH solutions when compared to the changes in NaOH solutions.Such observation is due to the fact that Na+is a small cation,and hydrates strongly in solution,thus exhibits strong repulsion to hydrophobic oxygenmolecules.On the contrary,due to the large sizeof K+ion,the surface charge density of K+ion is much smaller,exhibiting some hydrophobic characteristics.32Therefore,the repulsion to oxygenmolecules in KOH solution is less significant in comparisonw ith that in NaOH solutions.
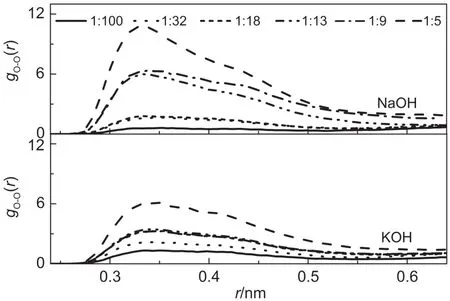
Fig.3 gO-O(r)functions for all the investigated concentrations in NaOH and KOH solutionsat25°C
Fig.4 shows the distribution between oxygen molecules at different temperatures.With the riseof temperature,theheightof the first peaks in Fig.4 decreases.As expected,themobility of oxygen molecules increases consequently w ith the increase of temperature,favoring themore scattered distribution of oxygen molecules.Further,as clearly demonstrated in Fig.4,in comparisonwith KOH solutions,the RDFs in NaOH solutions change more significantly w ith the increase of temperature,suggesting that temperature hasmore significant effect on controlling the oxygenmobility in NaOH solutions.

Fig.4 gO-O(r)functions for all the investigated tem peratures in NaOH and KOH solutionsat the concentration of1:5
The interaction between oxygen and watermolecules,gO-OW(r), in the NaOH and KOH solutions atdifferent concentrationsare shown in Fig.5.Itcan be seen that the heightand thew idth of the first peak decreasew ith the increase of concentration,which is more significant in KOH solutions.As discussed previously,the hydration numberof K+is larger than thatof Na+,therefore,there w ill be fewer watermolecules available to form cages around oxygenmolecules in the concentrated KOH solution.Therefore,w ith the increase of concentration the heightof the firstpeaks in KOH solution decreasesmore quickly.
The gO-OW(r)at the concentration of 1:5(molar ratio)under different temperaturesare shown in Fig.6.Although the change in the firstpeak position is negligiblew ith temperature,the height of the firstpeak decreases and thew idth of the peak increases in both NaOH and KOH solutions.This signifies that the interaction between oxygen andwatermoleculesdecreasesas the temperature increases,which is due tomuch increased ion/moleculemobility in the solution athigher temperatures.And in KOH solution,the change in w idth and heightof the firstpeak ismore significant, indicatingmuchweakened interaction between oxygen andwater molecules.

Fig.5 gO-OW(r)functions for all the investigated concentrations in NaOH and KOH solutionsat25°C

Fig.6 gO-OW(r)functions for all the investigated tem peratures in NaOH and KOH solutionsat the concentration of 1:5
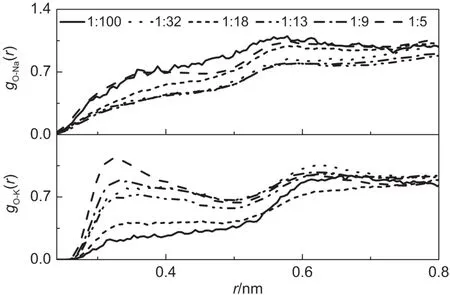
Fig.7 gO-Cation(r)functions for all the investigated concentrations in NaOH and KOH solutionsat25°C

Fig.8 gO-Cation(r)functions for all the investigated tem peratures in NaOH and KOH solutionsat the concentration of 1:5
The interaction between oxygenmoleculesand cations,gO-Na(r) and gO-K(r),are shown in Figs.7 and 8 respectively.From Fig.7,it can be seen that the peaks are notwell defined at any concentrations in NaOH solutions,suggesting that the interaction between oxygenmoleculesand Na+ions isalmostnegligible.Such observation can be easily understood by considering the follow ing aspects.First,Na+is a small cation w ith large surface charge density,and hydrated strongly w ith surrounding watermolecules by forming octahedral H-bonding network,and thus,preventing the direct contactw ith hydrophobic oxygenmolecules.Further, in concentrated solutions,there w ill be less sufficient water molecules to form complete hydration shell around Na+ions. However,hydroxide anions will replace some of the watermolecules,and preventoxygenmolecules approaching the Na+ions. Lastbutnever the less,Na+isa hydrophilic particle,and repels hydrophobic oxygen molecules naturally.However,in KOH solution,it is interesting to notice thatas the solution concentration increases,the interaction between the oxygenmoleculesand K+isgetting stronger as evidenced by the increase of the firstpeak. Such phenomena isattributed to the hydrophobic characteristics of K+ion due to its large sizeand smallsurface charge density as previously discussed.Hence in KOH solution,w ith the increase of concentration,the heights of the first peaks increase and the w idthsof the peaks decrease(see Fig.7).Asexpected,the RDFs become less structured(see Fig.8)w ith the increase in temperature,similar to other RDFsdiscussed in theabove section.
The interactions between oxygen molecules and hydroxide ions,gO-OH(r),are shown in Figs.9 and 10 respectively.The radial distribution between oxygen molecules and hydroxide ions in NaOH and KOH solutions are less defined,and similar to the distribution between oxygenmoleculesand Na+as shown in Fig.7, mainly due to the strong hydrophilic nature of hydroxide anion and hydrophobic characteristicsof oxygenmolecules.
3.2Self-d iffusion coefficien ts
The tracer diffusion coefficient(D)of oxygen can be calculated from itsmean square displacementby using the relationship:35-37

where ri(t)is the position of a particle i at time t.The diffusion coefficientsof oxygen in purewaterwere obtained from theMSD in the presentwork,and the diffusion coefficients of oxygen in waterat25°C are summarized in Table3.1,10,11,38-43In comparison w ith values obtained from experimentalmeasurement and simulations,the oxygen diffusion coefficient from this study isw ithin the reasonable range,validating themethodology for calculating thisparameterusing MSD.
Figs.11 and 12 show the simulation results for oxygenmolecules in KOH and NaOH at25,60,100,and 120°C,respectively. A lso included in Fig.11 are the data from literature,which were obtained through experimental measurements using different approaches.Gubbins et al.1adopted polarograhic method involvingmeasurementof the limiting currentduring the reduction of the oxygen to hydrogen peroxide at the dropping mercury electrode,and the maximum error of the diffusivity values is about±6%.Tham et al.10used the stagnantmicroelectrode method,and theestimated accuracy of themeasurements is±10%. Hu12measured the diffusion coefficientby using the polarography w ith three electrodes.Jin etal.7measured the viscosity by cyclic voltammetry and then calculated the diffusion coefficientby the Stokes-Einstein equation.Davis etal.11obtained the data through the stagnant diffusion cell w ith an accuracy of±0.5%.From Fig.11,it can be seen that the simulation results are in perfect agreementw ith the literature data at25 and 60°C.
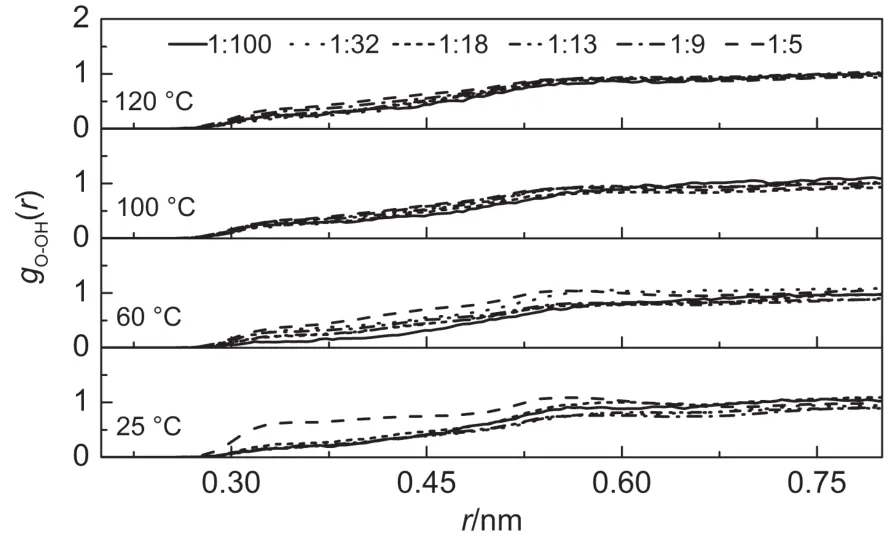
Fig.9 gO-OH(r)functions for all the investigated concentrations and tem peratures in NaOH solutions

Fig.10 gO-OH(r)functions for all the investigated concentrations and tem peratures in KOH solutions

Table3 Diffusion coefficientsof oxygen in water at25°C

Fig.11 Diffusion coefficients for oxygen in KOH solutions

Fig.12 Diffusion coefficients for oxygen in KOH and NaOH solutions
As the solubility of oxygen in distilled water has been determined by many researchers,and it is generally agreed that the value at 25°C is 1.26×10⁻³mol·L-1,which is low,making it difficult to determine the diffusion coefficientdirectly.11And w ith the increase of temperature and alkaliconcentration,the solubility of oxygen decreasessubstantially.Athigh temperature,the concentration of the dissolved oxygen isso low that,no literaturehas been found to include the diffusion coefficient of oxygen over 100°C.MD simulation on the other hand,is free from experimental lim itation,and could be an attractive alternative for studying theoxygen diffusion atextreme conditions.Based on thegood agreementof simulation and experimental resultsat25 and 60°C,the diffusion coefficients of oxygen at 100 and 120°C were calculated.Meanwhile,although the saturation concentrations(mass fraction)of NaOH and KOH at20°C are 52.0%and 52.8%,respectively,the dynamic propertiesw ill be obviously affected by the dielectric polarization as the solutions aremore concentrated.However,the force field used in the simulation does not consider polarization effect.Therefore,the maximal concentrationsof NaOH and KOH(1:5,molar ratio)studied in this paperare 28.8%and 36.2%,respectively.

Table 4 Com parison of calcu lated diffusion coefficientsw ith values reported in the literatureat infinite dilution solution
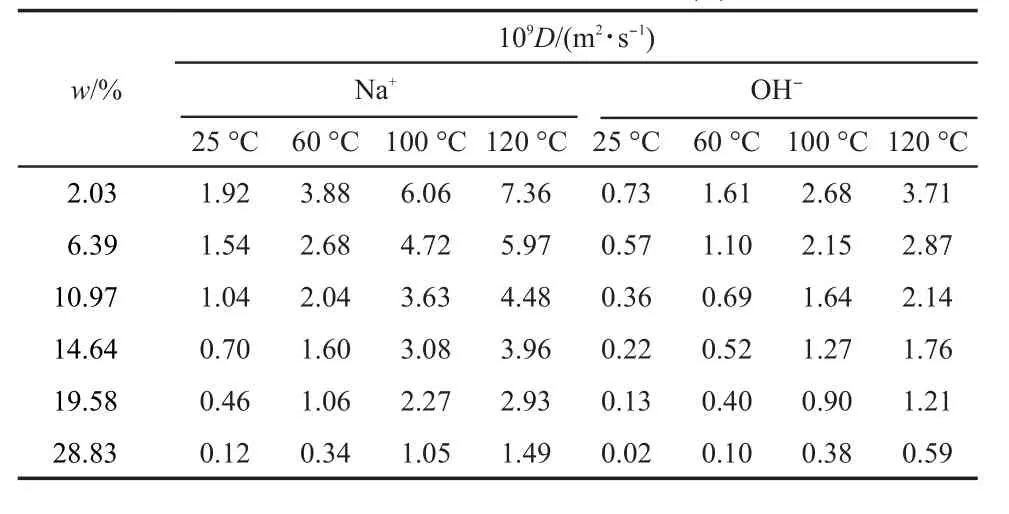
Tab le5 Diffusion coefficients for Na+and OH-shown asa function of salt concentration(w)
However,from Fig.11,itcan be seen that regardlessof the good agreementbetween simulation and experimental resultsat25 and 60°C,discrepancieswere observed athigh temperature.And at 100°C,the simulation result is 15.3%lower than the corresponding literature data,which is obtained through the stagnant microelectrodemethod by Tham etal.10The discrepancy could be due to the follow ing two reasons.Because the low oxygen solubility,especially in concentrated alkaline solution,using the electrochem icalmethod tomeasure the oxygen diffusion coefficient based on the study of oxygen redox reaction at electrode surfacemay nothave enough accuracy.Further,the force field used in the simulation isdeveloped to study solution propertiesat room temperature,and does not consider polarization effect. Consequently,errors are expected during simulation at high temperature and high solution concentration.However,in general, the data from the simulation and experimentation reasonably agree w ith each other,suggesting the viability of simulation method to study such topic.
From Fig.11,italso can be seen that the diffusion coefficients of oxygen decrease monotonously w ith the increase of KOH concentration under the same temperature,which is due to the increased particle interaction in concentrated alkaline solutions. Both cations and anionshave the tendency to hydrogen bonding w ith watermolecules,lim iting themovementof oxygenmolecules.As the solute concentration increases,the solution becomes more structured,consequently further decrease oxygenmolecule mobility.Interestingly,as the temperature increases,the slope of diffusion coefficient curve obviously increasesw ith the increase of KOH concentration.That is,the higher temperature,themore sensitive the oxygen diffusion coefficient to the KOH concentration.And from the tendency of the diffusivity curves,it can be seen that the values of diffusion coefficient of oxygen at the concentrated alkali hydroxide get closer even at different temperatureswhen the curves are extrapolated.In otherwords,the diffusion coefficient of oxygen at the concentrated alkali hydroxide solutionsvaries lesssignificantw ith the temperature.
The comparison of diffusion coefficients for oxygen in NaOH and KOH solutionsunder25,60,100,and 120°C are presented in Fig.12.At the low concentration,the diffusion coefficients for oxygen in NaOH and KOH are very close,especially at25°C. Butunder the same temperature,as the concentration increases, the gap between the diffusivity in NaOH and KOH solutions increases.And interestingly,as the temperature rises,the gap also increases.Furthermore,in all concentrations the diffusion coefficientof oxygen in NaOH solutions is smaller than that in the corresponding KOH solutions,which agreeswellw ith themore defined structureof RDFs in NaOH solutionsasdiscussed above. Thisalso resembles the experimentdata that the viscosity of the NaOH solution increasesmore quickly w ith the concentration compared to the KOH solution,7as the oxygen diffusivity is believed to be closely related to the viscosity of the solutions.44The relationship between diffusion coefficientand solution viscosity isgiven by the Stokes-Einstein equation:45

where r is theeffectivehydrodynamic radiusof oxygenmolecule, k is the Boltzmann constant,T is the absolute temperature,andη is the solution viscosity.
As reported by Jin et al.,7the electrolyte viscosity increases monotonically with the alkaline concentration,and the viscosity of NaOH solution is larger than that of corresponding KOH solution for the same electrolyte concentration.Hence the diffusion coefficientof oxygen in both NaOH and KOH solutions decreases w ith the increase of electrolyte concentration,and diffusivity in NaOH solution isalways smaller than that in the corresponding KOH solution.
The diffusion coefficients of ions in dilute solution are summarized in Table 4,and compared w ith literature valuesat infinite dilution solution.And the literature data come from experiments or computer simulations.24,35,46,47From Table 4,it is clear that the diffusion coefficients of ions calculated in the currentstudy are close to the values from the literature,demonstrating that the simulation can provide an important reference for the actualapplication.
The diffusion coefficients for cationsand anionsare shown as a function of salt concentration in Table 5 and Table 6 respec-tively.From the table,itcan be seen that the diffusion coefficients for hydroxide,Na+,and K+decreasew ith the increase of the salt concentration.The observed decrease in ion diffusivity can be explained in termsof increased ion pairing,which slowsdown the movement of ions.Close analysis of these data indicates that although the diffusion coefficients of K+decreasemore quickly than those of Na+,the diffusion coefficients of K+are still larger than those of Na+.Thisagreeswellw ith the above RDFs of gOW-OW(r),and ithasbeenmentioned previously that the larger cation ismore efficient in breaking the HB network of solvent, w ith a consequentenhancementof themobility of both ionsand molecules.Meanw ile,Na+hydrates strongly w ith surrounding watermoleculesby forming octahedral H-bonding network,and on the contrary,K+behaves like a hydrophobic particle,which loosely hydrates w ith the surrounding solvents.A ll the factors contribute to the difference in Na+and K+.Forhydroxide,similar tendency has been found.The diffusion coefficients decrease slowerw ith concentration in the presence of Na+compared to the K+,but the diffusion coefficientsof OH-are stillsmaller in NaOH solutions.

Table6 Diffusion coefficient for K+and OH-shown as a function of salt concentration(w)
4 Conc lusions
A molecular dynam ics study of the interaction of oxygen moleculew ith surrounding ionsand watermoleculesaswellas oxygen diffusivity in NaOH and KOH solutions at different temperatures(25-120°C)and concentrations(1:100-1:5,mole ratio)has been accomplished.It is found that in comparison w ith the corresponding KOH solutions,the NaOH solutions getmore structuredwith the increaseof concentrationsdue to thestrong ion/ water interactions.And the position of the second water radial distribution peak in KOH solutionsmoves to shorter distance, suggesting that the larger cation ismore efficient in breaking the HB network ofwatermolecules.All the factors contribute to the largermobility of particles in KOH solutions.
The self-diffusion coefficients for oxygen and ions in NaOH and KOH solutions at 25,60,100,and 120°C have been calculated by means of mean-squared displacement curves using Einstein's relation,and the resultsare in agreementw ith the experimental values.From the results,it is observed that as the temperature increases,the slope of diffusion coefficientcurve for oxygen obviously increases both in NaOH and KOH solutions. But the diffusion coefficient of oxygen in NaOH solutions is smaller than that in the corresponding KOH solutions w ith all concentrations.It is further concluded thatdifference in oxygen the self-diffusion coefficients in NaOH and KOH solutions becomesmore significantw ith the increase in solution concentration.A ll the above phenomena are attributed to the different electronegativity between Na+and K+.In addition,by investigating the diffusion coefficientsof ionsand watermolecules,it is concluded thatall the diffusion coefficients for hydroxide,Na+, and K+decreasew ith the increase of the solution concentration, which is due to the increase in ion pairing,inhibiting themovementof ions.
From the comparisonw ith data reported in the literature,it is conclude thatmolecular dynamics calculation can be used as a reliable tool to study the equilibrium structure and dynamic properties of concentrated alkaline solution,and the diffusion coefficients obtained from simulation could serve as good reference for researchersworking in this field.
(1)Gubbins,K.E.;Walker,R.D.Journalofthe Electrochemical Society 1965,112(5),469.doi:10.1149/1.2423575
(2)Case,B.Electrochimica Acta 1973,18(4),293.doi:10.1016/ 0013-4686(73)80031-3
(3)Wang,Z.H.;Zheng,S.L.;Wang,S.N.;Liu,B.;Wang,D.W.; Du,H.;Zhang,Y.Trans.NonferrousMet.Soc.China 2014,24 (5),1273.doi:10.1016/S1003-6326(14)63189-7
(4)Zhang,Y.;Li,Z.H.;Qi,T.;Wang,Z.K.;Zheng,S.L.Chinese JournalofChemistry 1999,17(3),258.
(5)Zhang,Y.J.;Qi,T.;Zhang,Y.Hydrometallurgy 2009,96, 52.doi:10.1016/j.hydromet.2008.08.002
(6)Wang,S.;Zheng,S.L.;Zhang,Y.F.;Xu,H.B.;Zhang,Y.The Chinese JournalofProcess Engneering 2008,8(6),1148.
(7)Jin,W.;Du,H.;Zheng,S.L.;Xu,H.;Zhang,Y.The Journalof PhysicalChemistry B 2010,114(19),6542.
(8)Ratcliff,G.A.;Holdcroft,J.G.Trans.Inst.Chem.Eng.1963, 41(10),315.
(9)Gubbins,K.E.;Bhatia,K.K.;Walker,R.D.AIChE Journal 1966,12(3),548.doi:10.1002/(ISSN)1547-5905
(10)Tham,M.K.;Walker,R.D.;Gubbins,K.E.The Journalof PhysicalChemistry 1970,74(8),1747.doi:10.1021/ j100703a015
(11)Davis,R.E.;Horvath,G.L.;Tobias,C.W.Electrochimica Acta 1967,12(3),287.doi:10.1016/0013-4686(67)80007-0
(12)Hu,G.L.JournalofShen Yang Institute ofChemical Technology 1998,12(4),241.
(13)Thapa,S.K.;Adhikari,N.P.International JournalofModern PhysicsB 2013,27(8),1.
(14)Takeuchi,H.;Okazaki,K.The JournalofChemicalPhysics 1990,92(9),5643.doi:10.1063/1.458496
(15)Muller-Plathe,F.;Rogers,S.C.;Gunsteren,W.F.The JournalofChemicalPhysics1993,98(12),9895.doi:10.1063/1.464369
(16)Sm ith,W.;Forester,T.R.JournalofMolecularGraphics1996, 14(3),136.doi:10.1016/S0263-7855(96)00043-4
(17)Mancinelli,R.;Botti,A.;Bruni,F.;Ricci,M.A.;Soper,A.K. PhysicalChemistry ChemicalPhysics2007,9(23),2959.doi: 10.1039/b701855j
(18)Imberti,S.;Botti,A.;Bruni,F.;Cappa,G.;Ricci,M.A.;Soper, A.K.The JournalofChemicalPhysics2005,122(19), 194509.doi:10.1063/1.1899147
(19)Botti,A.;Bruni,F.;Imberti,S.;Ricci,M.A.;Soper,A.K.The JournalofChemicalPhysics2004,120(21),10154.doi: 10.1063/1.1705572
(20)Zhou,J.;Lu,X.H.;Wang,Y.R.JournalofChemical Engineering ofChinese Universities2000,1(14),1.
(21)Vácha,R.;Megyes,T.;Bakó,I.;Pusztai,L.;Jungw irth,P.The JournalofPhysicalChemistry A 2009,113(16),4022.
(22)Clementi,E.;Barsotti,R.ChemicalPhysics Letters1978,59 (1),21.doi:10.1016/0009-2614(78)85605-X
(23)Mezei,M.;Beveridge,D.L.The JournalofChemicalPhysics 1981,74(12),6902.doi:10.1063/1.441101
(24)Impey,R.W.;Madden,P.A.;M cDonald,I.R.The Journalof PhysicalChemistry 1983,87(25),5071.doi:10.1021/ j150643a008
(25)Nguyen,H.L.;Adelman,S.A.The JournalofChemical Physics 1984,81(10),4564.doi:10.1063/1.447430
(26)Marchese,F.T.;Beveridge,D.L.Journalofthe American Chemical Society 1984,106(13),3713.doi:10.1021/ ja00325a001
(27)Kistenmacher,H.;Popkie,H.;Clementi,E.The Journalof Chemical Physics1974,61(3),799.doi:10.1063/1.1682019
(28)Chandrasekhar,J.;Spellmeyer,D.C.;Jorgensen,W.L.Journal ofthe American Chemical Society 1984,106(4),903.doi: 10.1021/ja00316a012
(29)Soper,A.K.;Ricci,M.A.PhysicalReview Letters2000,84 (13),2881.doi:10.1103/PhysRevLett.84.2881
(30)Okhulkov,A.V.;Dem ianets,Y.N.;Gorbaty,Y.E.The Journal ofChemicalPhysics1994,100(2),1578.doi:10.1063/1.466584
(31)Bosio,L.;Chen,S.H.;Teixeira,J.PhysicalReview A 1983,27 (3),1468.doi:10.1103/PhysRevA.27.1468
(32)Mahler,J.;Persson,I.Inorganic Chemistry 2011,51(1),425.
(33)Chen,B.;Park,J.M.;Ivanov,I.;Tabacchi,G.;Klein,M.L.; Parrinello,M.Journalofthe American Chemical Society 2002, 124(29),8534.doi:10.1021/ja020350g
(34)Sokol,M.;Daw id,A.;Dendzik,Z.;Gburski,Z.Journalof Molecular Structure 2004,704(1),341.
(35)Koneshan,S.;Rasaiah,J.C.;Lynden-Bell,R.M.;Lee,S.H. The JournalofPhysicalChemistry B 1998,102(21),4193.doi: 10.1021/jp980642x
(36)Chowdhuri,S.;Chandra,A.The JournalofChemical Physics 2001,115(8),3732.doi:10.1063/1.1387447
(37)Du,H.;Rasaiah,J.C.;M iller,J.D.The JournalofPhysical Chemistry B 2007,111(1),209.doi:10.1021/jp064659o
(38)Baird,M.H.;Hamielec,A.E.The Canadian Journalof Chemical Engineering 1962,40(3),119.doi:10.1002/cjce. v40:3
(39)Jordan,J.;Ackerman,E.;Berger,R.L.Journalofthe American Chemical Society 1956,78(13),2979.doi:10.1021/ ja01594a015
(40)Ferrell,R.T.;Himmelblau,D.M.JournalofChemicaland Engineering Data 1967,12(1),111.doi:10.1021/je60032a036
(41)Vivian,J.E.;King,C.J.AIChE Journal1964,10(2),220.
(42)Davidson,J.F.;Cullen,E.J.Trans.Inst.Chem.Eng.1957,35, 51.
(43)Wise,D.L.;Houghton,G.ChemicalEngineering Science 1966, 21(11),999.doi:10.1016/0009-2509(66)85096-0
(44)Zhang,X.;Leddy,J.;Bard,A.J.Journalofthe American Chemical Society 1985,107(12),3719.doi:10.1021/ ja00298a054
(45)Li,C.M.;Chang,P.The JournalofChemicalPhysics1955,23 (3),518.doi:10.1063/1.1742022
(46)Song,H.L.;Jayendran,C.R.J.Phys.Chem.1996,100(4), 1420.doi:10.1021/jp953050c
(47)Obst,S.;Bradaczek,H.J.Phys.Chem.1996,100(39), 15677.doi:10.1021/jp961384b
Struc tu re and Diffusivity o f Oxygen in Concen trated A lkali-Metal Hyd roxide So lu tions:AMo lecu lar Dynam ics Sim u lation Study
LÜYe-Qing1,2ZHENG Shi-Li1WANG Shao-Na1DU Hao1,*ZHANG Yi1
(1National Engineering Laboratory forHydrometallurgicalCleaner Production Technology,Key Laboratory ofGreen Processand Engineering,Institute ofProcess Engineering,Chinese Academy ofSciences,Beijing 100190, P.R.China;2University ofChinese Academy ofSciences,Beijing 100049,P.R.China)
Molecular dynam ics simulations of oxygen molecules in NaOH and KOH solutions at different tem peratures(25-120°C)and concentrations(1:100-1:5,m olar ratios)were performed in this study.The interactions of oxygen molecules w ith the surrounding solventand solute were clarified by considering the solvent-solvent,oxygen-solvent,and oxygen-solute radialdistribution functions.The self-diffusion coefficients of the oxygenmolecules and the solute were both determ ined by analyzing themean-squared disp lacement (MSD)curves,using Einstein's relationship.Itwas concluded thatatallconcentrations,the diffusion coefficient ofoxygen in NaOH solution is smaller than that in the corresponding KOH solution.The diffusion coefficients forhydroxide,Na+,and K+decrease w ith increasing solute concentration,follow ing sim ilar trends to those of oxygen.The oxygen diffusion coefficient obtained in this study is in good agreement w ith the reported experimentalvalue,suggesting thatMSD is an attractive approach to study the oxygen diffusion behavior in strong alkaline solutions atelevated temperatures,which are experimentally extremely challenging.
Moleculardynam ics sim ulation;Oxygen;NaOH;KOH;Diffusion coefficient
O645
icle]
10.3866/PKU.WHXB201504071 www.whxb.pku.edu.cn