Response of turbulent fluctuations to the periodic perturbations in a flow over a backward facing step
2015-12-22ZhuoyueLiHongleiBiNnGo
Zhuoyue Li∗,Honglei Bi,Nn Go
aSchool of Aeronautics and Astronautics,Dalian University of Technology,Dalian,China
bDepartment of Mechanical Engineering,University of Melbourne,Melbourne,Australia
Response of turbulent fluctuations to the periodic perturbations in a flow over a backward facing step
Zhuoyue Lia,∗,Honglei Baib,Nan Gaoa
aSchool of Aeronautics and Astronautics,Dalian University of Technology,Dalian,China
bDepartment of Mechanical Engineering,University of Melbourne,Melbourne,Australia
A R T I C L E I N F O
Article history:
Accepted 21 August 2015
Available online 8 September 2015
Active flow control
Synthetic jet
Backward facing step

©2015 The Authors.Published by Elsevier Ltd on behalf of The Chinese Society of Theoretical and Applied Mechanics.This is an open access article under the CC BY-NC-ND license(http:// creativecommons.org/licenses/by-nc-nd/4.0/).
There is great amount of interest in the flow over a backward facing step where the separated flow re-attached to the wall forming a well-defined separation region.Efforts were made to alleviate the surface pressure fluctuations using active methods. Periodically perturbing the shear layer at the separation location using a zero-net-mass-flux(synthetic jet)actuator was found to be effective[1–5].Chun and Shun[1]studied the effect of the periodic perturbation at the separation location on the size of the re-circulation bubble(Xr)for flow with a Reynolds numbers(ReH)of 13000–33000 using a zero-net-mass-flux actuator. They found Xrdecreased when the non-dimensional actuation frequency StA=fAH/U varied between 0–0.7,the mosteffective forcing frequencies were close to the vortex shedding frequency of the unforce flow,StA=0.25−0.29.The static pressure inside of the re-circulation region also decreased significantly when Xrdecreased.Chun and Shun[2]also studied the evolution of the structuresovera backward facing step underperiodic forcing using flow visualization technique.The Reynolds number in their study was 1200.The visualization revealed that the flow structures in the shear layer locked in with the periodic actuation when StAwas 0.47.The structures grew in size while traveling in the shear layer, and Xrreduced as much as 60%.When a high actuation frequency, StA=0.82,was used,the growth of the structures were small comparing with the low-frequency forcing case and Xrwas similar to that for the un-forced flow.Yoshioka et al.[3,4]studied the flow over a backward facing step under periodic actuation using the particle image velocimetry(PIV).The Reynolds number(ReH) wasapproximately 3700.They found the mosteffective forcing frequency in reducing Xrwas StA=0.19.The Reynolds shear stresses in the shear layer near the re-attachment was the largest under forcing with this optimum frequency.They also found the propagation velocity of the structures over the re-attachment region was Uc≈0.3U.Dejoan and Leschziner[5]studied the flow over a backward facing step under periodic actuation at a frequency (StA)of 0.2 numerically using the large eddy simulation(LES).They found Xrreduced nearly 30%when ReHwas 3700.The propagation velocity of the structures over the re-attachment region was Uc≈0.4U.
Previous investigations focusedon the changes in re-attachment length and the static pressure inside of the re-circulation region. The current investigation focuses on the distribution of the fluctuating wall pressure under periodic forcing with frequencies of StA=0.04–0.33,covering the‘‘flapping’’frequency and the‘‘shedding’’frequency for the separated shear layer[6].The magnitude in the pressure spectrum at the frequency of StAfor different forcing amplitudes(u′/U=0.1–0.4)were compared to study how the separated flow responded to the actuation.In this letter,the experimental methods are presented in the next section,followed by the results and the concluding remarks.
The investigation was performed in a blown-down wind tunnel shown in Fig.1.The air flow supplied by a variable speed blowerwith a 2.2 kW motor went through a 2 m long diverging section, a large settling chamber(900 mm by 900 mm by 750 mm)and a contraction section with a 9:1 area ratio and a length of 750 mm. The exit of the contraction section is 300 mm by 300 mm.There was a perforated plate with opening ratio of 50%at the end of the diverging section to condition the flow before it entered the settling chamber.Plexiglas test section with a length of L= 720 mm and a width of W=300 mm was attached to the exit of the contraction section.The step was located at Ls=300 mm downstream of the inlet of the test section.The height of the test section was 300 mm initially,and 325 mm downstream ofthe step. The height of the step was H=25 mm,thus the aspect ratio of the step was 12,that was large enough to ensure a two dimensional flow in the central part of the test section near the mean reattachment point.There was no top plate in the test section.The free stream turbulence intensity was approximately 0.9%.A freestream velocity of U=5.7 m/s was used,the corresponding ReHis 9100.A single hot-wire probe was used to measure the profile of the in-coming velocity at x/H=−1.The boundary layer thickness was found to beδ0.99/H=0.12,as shown in Fig.2.

The actuator used in this investigation was a 220 mm-diameter 8-ohms loud-speaker mounted under the step forming a 0.22 m× 0.28 m×0.02 m cavity.Periodic jet flow was produced through a two-dimensional slot with a width of s=1 mm on top of the cavity.The jet was issued at the edge of the step(x/H=0,y/H= 1.0)and oriented 45°to the free stream velocity.The speaker was driven by harmonic signals with different frequencies and amplitudes generated using a Texas Instruments TMS320C6713 digital signal processor(DSP)board and amplified using a 150 W digital amplifier.A single hot-wire probe with a Hanghua CTA-02A constant temperature anemometry system was positioned at the jet exit to measure the rms values of out-flow half of the oscillating jetvelocity,u′to characterize the actuator.The sensor in the singlewire probe had a diameter of 5µm and length of 1.25 mm.The hot wire probes were calibrated at the exit of wind tunnel.The natural frequency of the actuator was approximately 40 Hz,at which the oscillating jet velocity,u′,was the largest when sinusoidal signals of various frequencies and a fixed amplitude were applied to the actuator.Four actuation frequencies fA=10 Hz,40 Hz,60 Hz, and 80 Hz were examined here,corresponding to non-dimensional frequencies of StA=0.042,0.167,0.250,and 0.333,respectively. Three actuation amplitudes u′/U=0.1,0.2,and 0.4 were studied for each actuation frequency.
The time-averaged re-attachment locations for actuation frequencies and amplitudes are shown in Fig.3.The results reported in Refs.[1,3]were also shown for comparisons.When the actuation amplitude was u′/U=0.1,Xrdecreased when the actuation frequency increased from StA=0.04 and reaching a minimum at StA≈0.25–0.3.The trends agree with the results reported in Refs.[1,3]though the forcing amplitudes used by Refs.[1,3]might be different.Xrthen decreased when u′/U was increased.The timeaveraged size of the re-circulation bubble was shortened for as much as 40%when u′/U=0.4 and StA=0.25.The time-averaged static pressure at x/Hj=1 for different actuation frequencies and amplitudes are shown in Fig.3(b).The changes in the static pressure at x/Hj=1 were closely related to the changes in the timeaveraged re-attachment point.The static pressure near the base
Nomenclature
CPStatic wall pressure coefficient,P/(0.5ρU2)
Cp′Root-mean-square value of the wall pressure coefficient,p′/(0.5ρU2)
fAForcing frequency,Hz
FppPower spectrum of wall pressure,Pa2/Hz
H Height of the step,m
ReHReynolds number based on the step height,UH/ν
StAStrouhal number for the forcing frequency,
u′Root-mean-square value of the exit velocity for the synthetic jet,m/s
U Free-stream velocity,m/s
x,y,z Spatial coordinates,m
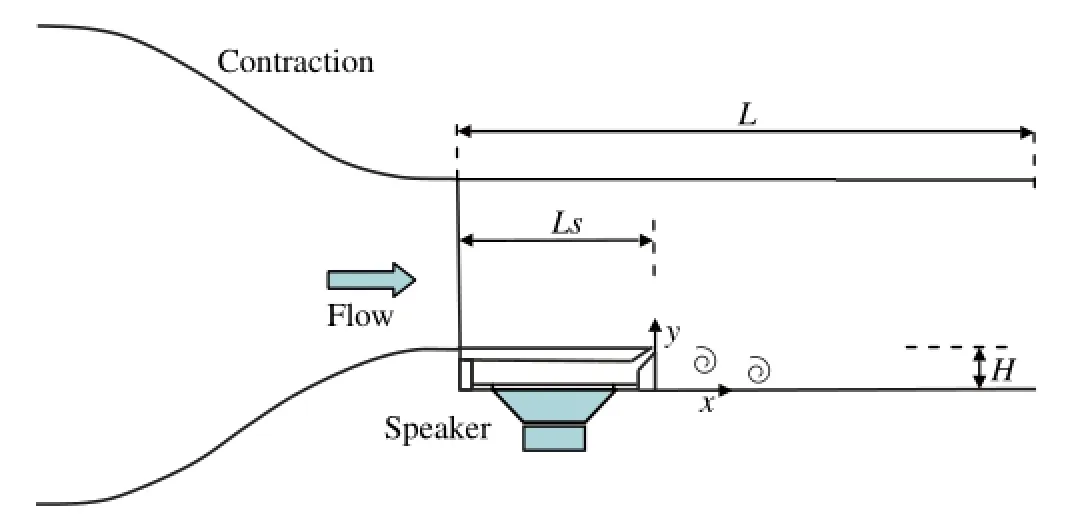
Fig.1.Schematics of the test rig.
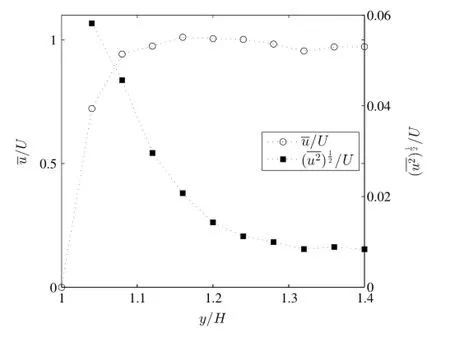
Fig.2.Distributions of the time-averaged(○)and fluctuating stream-wise(■) velocities measured using a single hot-wire probe at x/H=−1.
XrTime-averaged re-attachment length,mof the step became more negative when Xrbecame small.This is expected as the curvature in the time-averaged streamline of the attaching flow became large when the size of the re-circulation bubble decreased.
The fluctuating wall pressure coefficient for un-actuated flow and flows forced using a forcing amplitude of u′/U of 0.2 and different forcing frequencies are shown in Fig.4.The results for un-actuated flow agree with those measured by Heenan and Morrison[6]and Driver et al.[8].There was a peak in the fluctuating wallpressure at x/H=5–6,thatwas slightly upstreamofthe timeaveraged re-attachmentlocation.C′pincreased significantly and the location of the peak in C′pmoved upstream to x/H=3−4 when the flow was forced,particularly at a frequency StAof 0.125,where the size of the peak was approximately four times of that for the un-forced flow.The location of the peak shifted further upstream and the size of the peak decreased when the forcing frequency further increased.
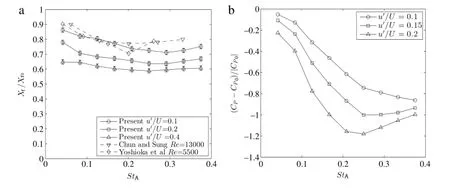
Fig. 3. Time-averaged (a) re-attachment locations for u′/U = 0.1 (◦), 0.2 (□), and 0.4 (△) and (b) static wall pressure coefficients at x/H = 1 for u′/U = 0.1( ◦ ) , 0.15 ( □ ) and 0.2 ( △ ) . Results by Chun and Shun [1] (∇) and Yoshioka et al. [3] (◇) were also shown for comparisons. The re-attachment location for the unforced flow in the current study was Xro≈ 4.2H.
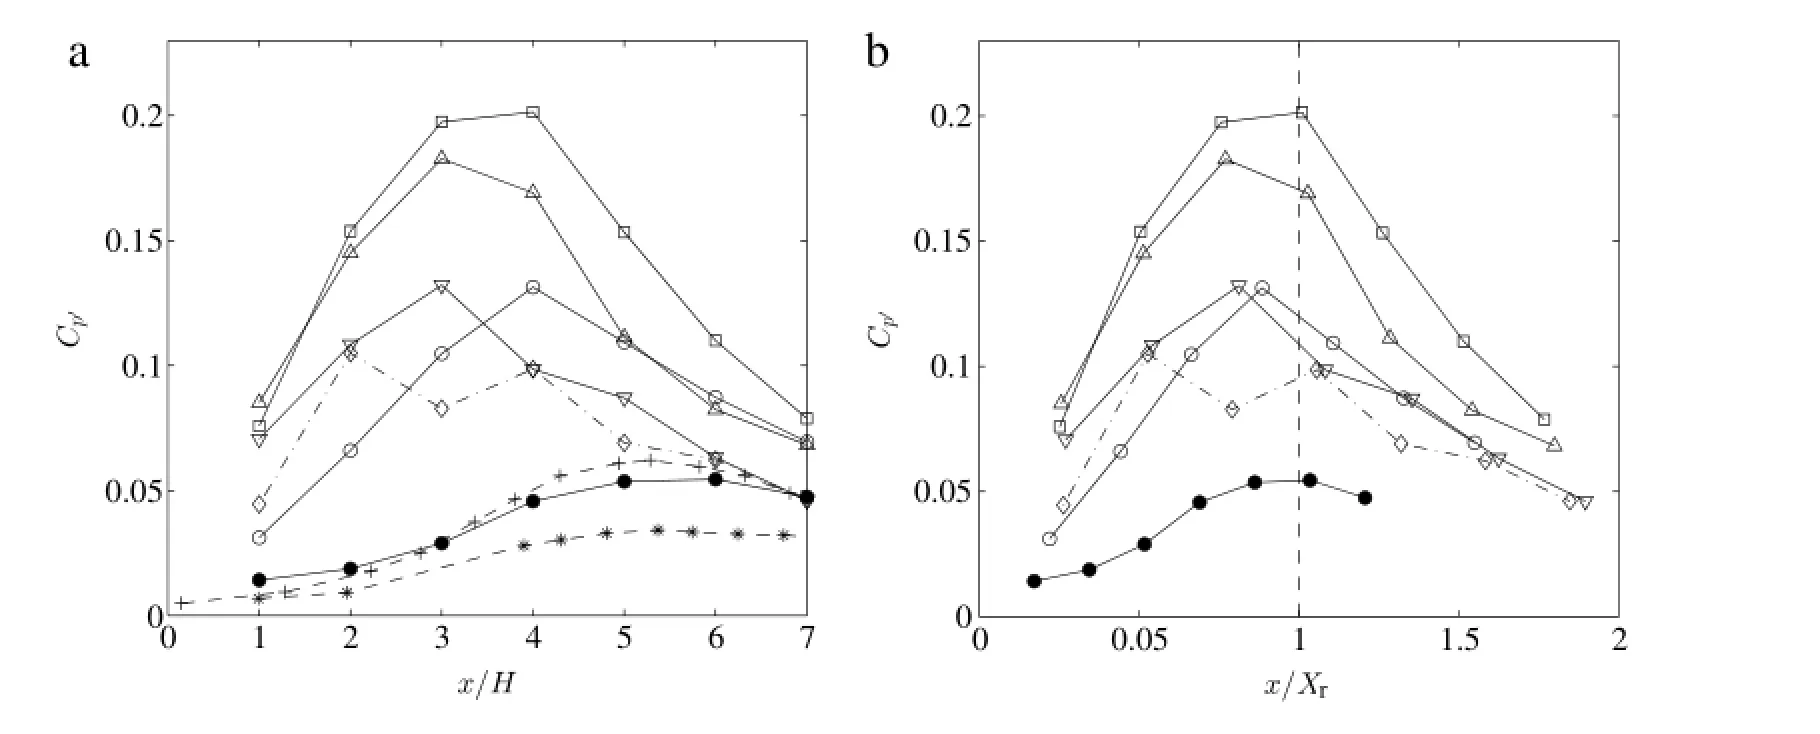
Fig. 4. Distributions of the fluctuating wall pressure coefficients for un-actuated flow (•) and flow actuated with a frequency of StA= 0.042(◦), 0.125(□), 0.167(△), 0.250(∇), 0.333(◇) and a forcing amplitude of u′/U = 0.2. The results for un-actuated flow by Refs. [6] (+) and [8] (∗) were also shown for comparisons.

The magnitude of the peaks in the pressure spectra for the frequency of St=StAat x/H=1,3,and 5 are shown in Fig.6. The size of the peaks varied with the forcing amplitude,the changes are different for different forcing frequencies and streamwise locations.At the location near the separated point x/H=1, the size of the peak at StAincreased with the forcing amplitude for all the forcing frequencies examined here.The increase rate was initially small for the‘‘flapping’’frequency of the shear layer, StA=0.042.The increase rate became large when the forcing frequency approached the‘‘shedding’’frequency and reached to a maximum at StA=0.167.The increase rate decreased when the forcing frequency increased beyond the‘‘shedding’’frequency.The increase rate for StA=0.333 approached to that for StA= 0.042.At x/H=3(x/Xr≈1.0),the size of the peak increased quickly with the forcing amplitude when the flow was forced at frequencies near the‘shedding’frequency(0.125≤StA≤0.167). The peak soon saturated for forcing amplitude u′/U≥0.3 for these frequencies,i.e.the sizes of the peaks do not increased with the forcing amplitude when u′/U became larger.The frequencies where the saturation occurred decreased at a further downstream location x/H=5,the size of the peak reached to a maximum at a much smaller forcing amplitude and the size of the peak decreased when the forcing amplitude further increased.
The flow structures in a separated shear layer actuated using a synthetic jet actuator were studied using experimental methods. When forced at a frequency much lower than the natural shedding frequency(fH/U=0.042 or fXr/U=0.24),the vertical flapping motion of the shear layer downstream of the separation point became very prominent.The peak of the pressure spectra at the forcing frequency measured near the separation point(x/H=1) increased linearly with the forcing amplitude(u′)suggesting a linear response of the pressure fluctuations to the forcing by the synthetic jet.The linear response did not hold for the pressure fluctuations away from the jet exit as the magnitude of the peak for St=StAmeasured at x/H=3 soon saturated when the forcing amplitude(u′/U)became larger than 0.3.
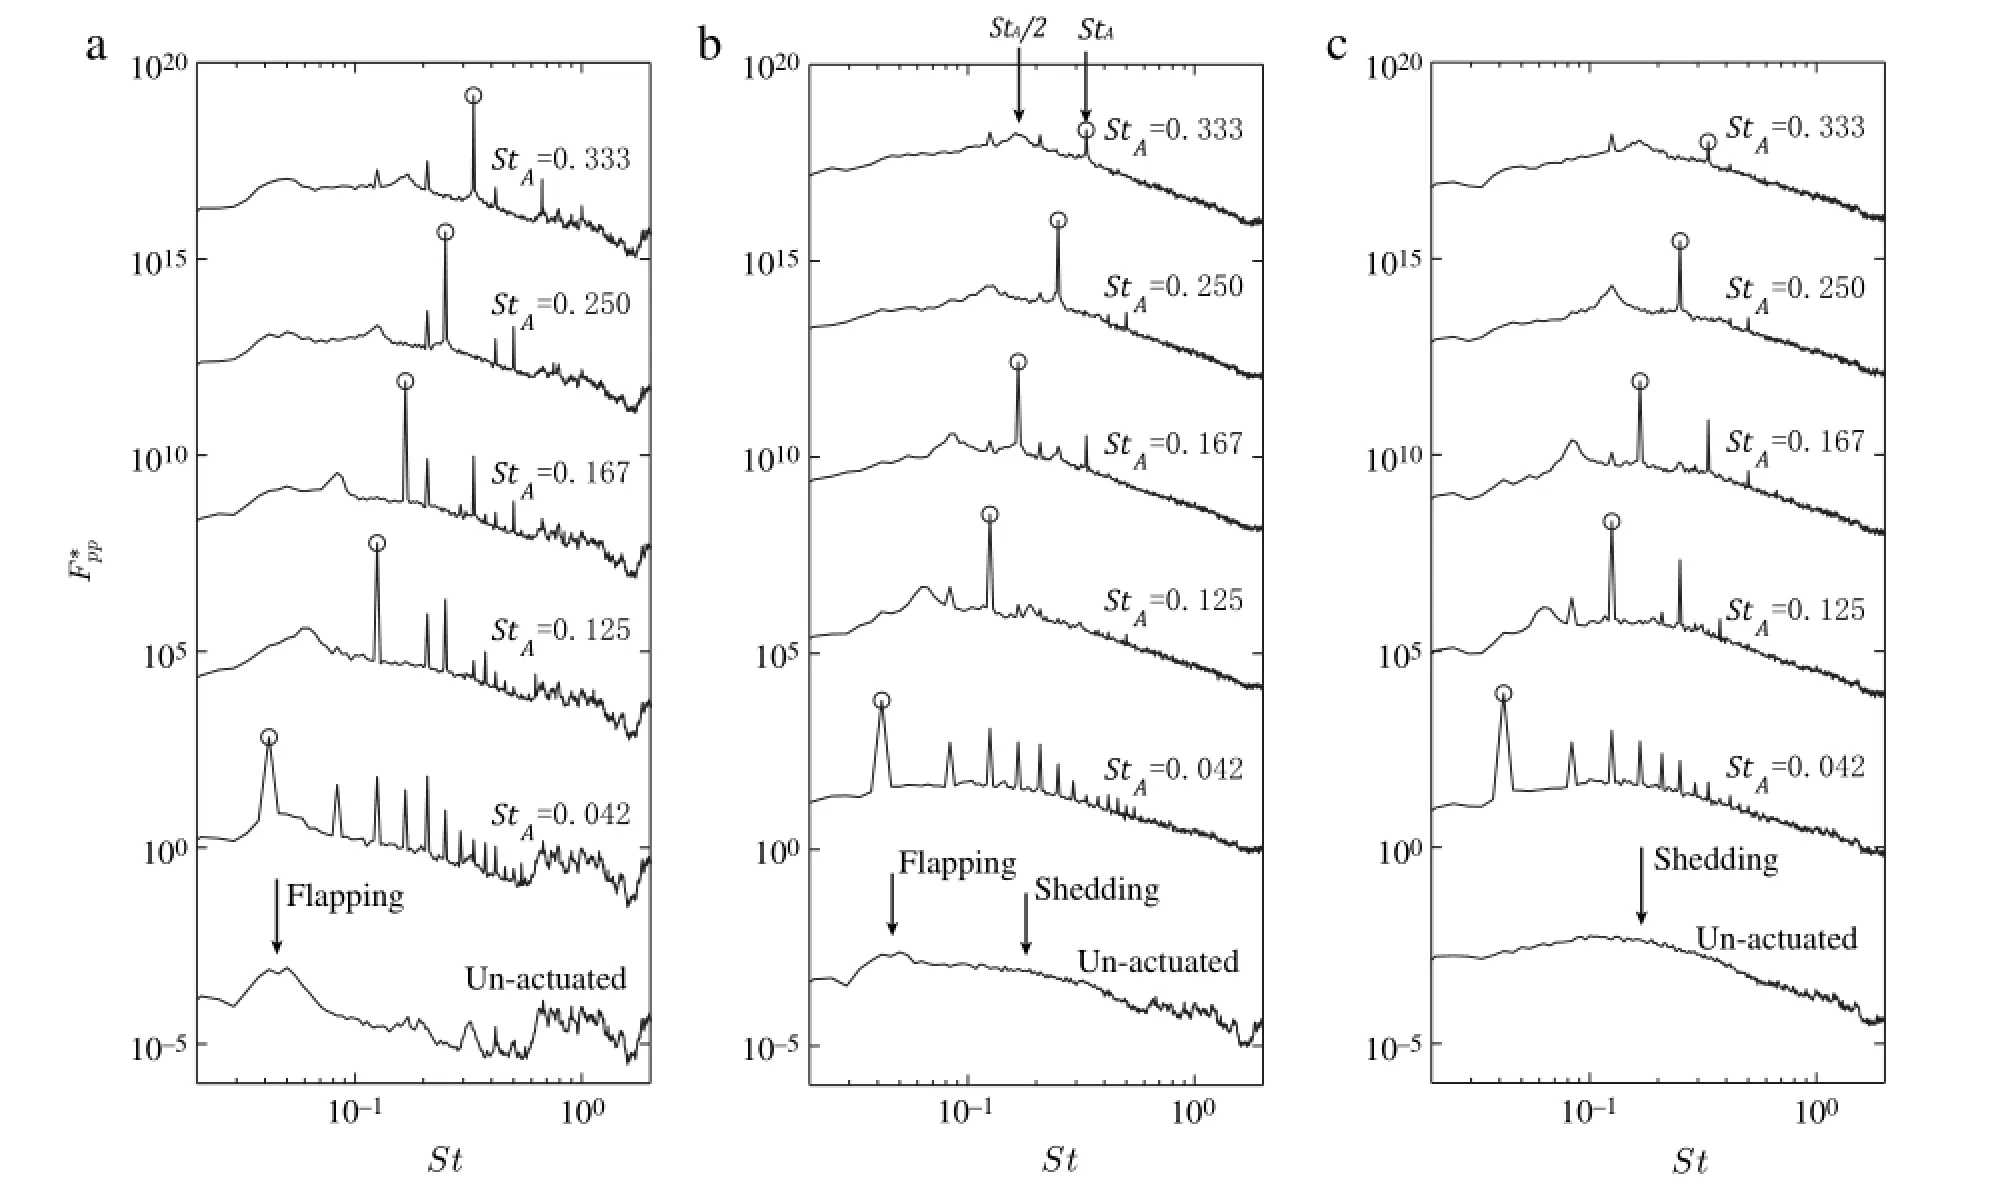
Fig.5.Non-dimensional power spectra of fluctuating wall pressure measured at x/H of(a)1,(b)3,and(c)5 for a forcing amplitude of u′/U=0.2.The peak at the forcing frequency(St=StA)was marked using a circle for visual aids.

Fig.6.Magnitude of spectra at the forcing frequencyat x/H of(a)1,(b)3,and(c)5.
Acknowledgments
This work was supported by 973 Program (2014CB744100) Dalian University of Technology(DUT14LK07).
References
[1]K.B.Chun,H.J.Sung,Controlofturbulentseparated flowovera backward-facing step by local forcing,Exp.Fluids 21(1996)417–426.
[2]K.B.Chun,H.J.Sung,Visualisation of a locally-forced separated flow over a backward-facing step,Exp.Fluids 25(1998)133–142.
[3]S.Yoshioka,S.Obi,S.Masuda,Turbulence statistics of periodically perturbed separated flow over a backward-facing step,Int.J.Heat Fluid Flow 22(2001) 393–401.
[4]S.Yoshioka,S.Obi,S.Masuda,Organized vortex motion in periodically perturbed turbulent separated flow over a backward-facing step,Int.J.Heat Fluid Flow 22(2001)301–307.
[5]A.Dejoan,M.A.Leschziner,Large eddy simulation of periodically perturbed separated flow over a backward-facing step,Int.J.Heat Fluid Flow 25(2004) 581–592.
[6]A.Heenan,J.Morrison,Passive control of pressure fluctuations generated by separated flow,AIAA J.36(1998)1014–1022.
[7]L.Hudy,A.Naguib,W.Humphreys,Stochastic estimation of a separated-flow field using wall-pressure-array measurements,Phys.Fluids 19(2007)024103.
[8]D.Driver,H.Seegmiller,J.Marvin,Time-dependent behavior of a reattaching shear layer,AIAA J.25(1987)914–919.
12 August 2015
∗.Tel.:+86 152 4260 6752.
E-mail address:sanjkfhk@163.com(Z.Li).
http://dx.doi.org/10.1016/j.taml.2015.08.002
2095-0349/©2015 The Authors.Published by Elsevier Ltd on behalf of The Chinese Society of Theoretical and Applied Mechanics.This is an open access article under the CC BY-NC-ND license(http://creativecommons.org/licenses/by-nc-nd/4.0/).
*This article belongs to the Fluid Mechanics
杂志排行
Theoretical & Applied Mechanics Letters的其它文章
- Direct comparison of hydraulic tortuosity and electric tortuosity based on finite element analysis
- Numerical investigation on the aerodynamics of a simplified high-speed train under crosswinds
- On the magnetic anomaly at Easter Island during the 2010 Chile tsunami
- Experimental study on interaction between a positive mass and a negative effective mass through a mass–spring system
- Understanding ductile-to-brittle transition of metallic glasses from shear transformation zone dilatation
- Numerical analysis of detaching and wrinkling of mechanically lined pipe during its spooling-on stage to the reel
