Numerical investigation on the aerodynamics of a simplified high-speed train under crosswinds
2015-12-22YueqingZhuangXiyunLu
Yueqing Zhuang∗,Xiyun Lu
Department of Modern Mechanics,University of Science and Technology of China,Hefei 230026,China
Numerical investigation on the aerodynamics of a simplified high-speed train under crosswinds
Yueqing Zhuang∗,Xiyun Lu
Department of Modern Mechanics,University of Science and Technology of China,Hefei 230026,China
H I G H L I G H T S
•Large eddy simulation(LES)results of two typical yaw angles of side flow around a high speed train model are provided.
•Mean and root-mean-square(RMS)values of the lift and side forces increase as the yaw angle increases.
•The dominating frequency range increases as the yaw angle increases.
•Three-dimensional vortical structures are distinct for the two cases.
•The side force is mainly determined by the lee-side wake vortices,and the lift force is related with the roof-side flow separation.
A R T I C L E I N F O
Article history:
13 May 2015
Accepted 29 June 2015
Available online 17 July 2015
High speed train
Yaw effect
Leading edge vortex
Cross wind
Large eddy simulation
The yaw effect of the side flow around a high-speed train is studied by means of large eddy simulation at two typical yaw angles of ϕ = 30° and 60°, respectively. Both the mean and fluctuating values of lift force and side force coefficients increase obviously as the yaw angle increases. The spectral analysis indicates that the time-dependent aerodynamic forces are dominated by several energetic frequencies and the frequency range is broadened to a higher extent for the large yaw angle. To have a better understanding of the train aerodynamic behaviors, the dedicate three-dimensional vortical structures are analyzed for the flow at the two yaw angles. Moreover, the time-averaged flow patterns, turbulent statistics, and the surface forces are also studied on sectional planes along the train.
©2015 The Authors.Published by Elsevier Ltd on behalf of The Chinese Society of Theoretical and Applied Mechanics.This is an open access article under the CC BY-NC-ND license(http://creativecommons.org/licenses/by-nc-nd/4.0/).
When the high-speed train cruises under a strong crosswind, there is high risk of overturning or derailment due to large side force and lift force exerted on the train.With a high incidence of various crosswind related to high-speed train accidents,the crosswind instability is recognized to be a critical safety issue, which has attracted more interests of researchers[1].Nowadays the realistic high-speed train cruises at a speed of several hundred kilometers per hour and the flow around the vehicle is highly turbulent.The aerodynamic behaviors of turbulent cross flow around a high-speed train is an attractive research topic worthy of extensive study.
Diedrichs[2]explored the applicability of Reynolds average Navier–Stokes(RANS)to resolve the overturning loads under low turbulence conditions for various high-speed train models.Taking accountinto the costofcomputation,itis assumed thatRANS modeling willcontinue to be an important technology to assess the flow fields and crucial vehicle load distributions.However,numerical and experimental studies of the flow around a high speed train show that such flows are highly unsteady and with a wide range of separation[1].The technique of large eddy simulation(LES)has provided the capability of accurate prediction of the mean and instantaneous flow around the train[3,4].Moreover,LES is also superior to the unsteady RANS in providing delicate flow structures, which is crucial in the understanding of the flow around the vehicle[5–7].
The experimental[8]and numerical[9]studies indicate that train aerodynamic forces show strong dependence on the yaw angle,both the lift force and side force increase significantly as the yaw angle increases and exhibit asymptotic behaviors when the yaw angle exceedsϕ=50°.In the present study,two typical cases ofϕ=30°andϕ=60°,corresponding to less and larger than the asymptotic angle,are studied by using LES method.The purpose of this study to achieve improved understanding of the yaw effect on the aerodynamic performances of the high-speed train,including the delicate flow structures,aerodynamic forces,turbulence statistics and surface force distributions.
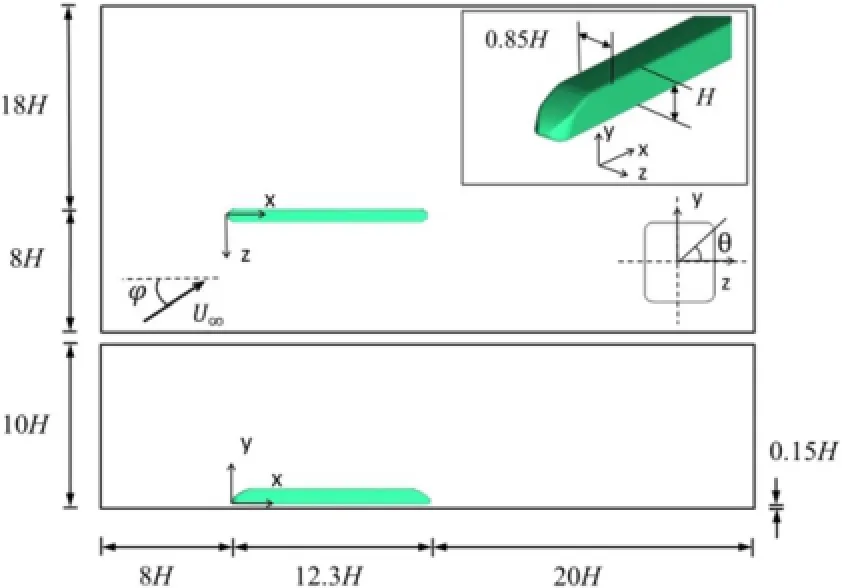
Fig.1.(Color online)Schematic view of the simplified train model and its computational domain.
As shown in Fig.1,the cross flow around a simplified 1/25 scale CRH3 high-speed train model without bogies and plow is investigated.Here,the height of train model is 0.1556 m,and the freestream velocity U∞is 20 m/s.The yaw angleϕis defined as the angle between the effective crosswind direction and the train cruising direction.In our computation,the Reynolds number based on the height of the train and freestream velocity is 2×10⁵,and it is within the range of the critical Reynolds number,for which the flow separation and reattachment occur over the roof-side face of the train[10].
In the present study,a LES solver[11,12]which solves the compressible Favre-filtered Navier–Stokes equations is used.The freestream Mach number is set to be 0.06.As we know that the flow with Mach number less than 0.3 is regarded as incompressible flow,and its calculation using a compressible flow solver is easy to diverge due to large stiffness of the governing equations. However,the present calculation can still obtain a converged solution without any modification.In the LES method,the largescale flow structures are resolved and the effect of small eddies is taken into account by using a wall-adapting local viscosity subgrid scale model.As employed in our previous work[13],the convective terms by a second-order centered scheme with an artificial viscosity,the viscous terms are discretized by a fourthorder centered scheme,and the time-derivative term is discretized by the second-order implicit scheme.
The structured multi-block hexahedron meshes are used to discretize the computational domain,which is shown in Fig.1. The O-type grid is used around the train,and the H-type grid is applied on the rest of the computational domain.The total number of the meshes is 4.8 million.Local mesh refinement is employed near the train surface and ground.The maximum value of the nondimensionaldistance y+between the firstnode and train surface in the direction normal to the wall is no more than 1.The maximum grid spacing△x+in the streamwise direction is less than 70 and the grid spacing△z+in the spanwise direction is less than 140. The non-dimensional time step based on the train height H and the freestream speed U∞is 0.0125.
For the inflow boundary condition,a uniform inlet velocity is set on the left and upper surface of the computational domain, respectively.Moreover,some small stochastic disturbances with a maximum amplitude less than 5%is also superimposed to the inlet velocity to excite turbulence.Thus,the inflow boundary layer is developed on the ground.Based on the results of previous study[7],the flow on the roof-side train surface is separated except a small region near the nose under current flow condition. Since the position of the flow separation is substantially fixed,the influence of inflow boundary layer on the flow around the train should not be very significant.The static pressure is specified on the right and lower surface as the outflow boundary condition. No-slip boundary condition is applied on the wall of the train and ground,respectively.Symmetric boundary condition is used on the top surface of the computational domain.
In order to validate the calculation,comparisons are made between the LES results and the experimental datum[4]of the timeaveraged surface pressure coefficient of a simplified high speed train for 90°yaw angle at Reynolds number of 3×10⁵.The definition of pressure coefficient is given as

where,p∞denotes the freestream pressure,ρis the density of the air.The LES results are consistent with the experiment except in a small region close to the train nose.As shown in Fig.2(a),LES overpredicts the low pressure peak on the roof-side face of train and a slight difference is also noticed between the LES results and experiment datum on the lee-and bottom-side faces at x/H=0.5. However,the LES results at other positions show good agreements with the experimental datum as shown in Fig.2(b)–(d).
Figure 3(a)and(b)shows the time-histories of the lift force and side force coefficients atϕ=30°and 60°,respectively.The lift force and side force coefficients are defined as follows

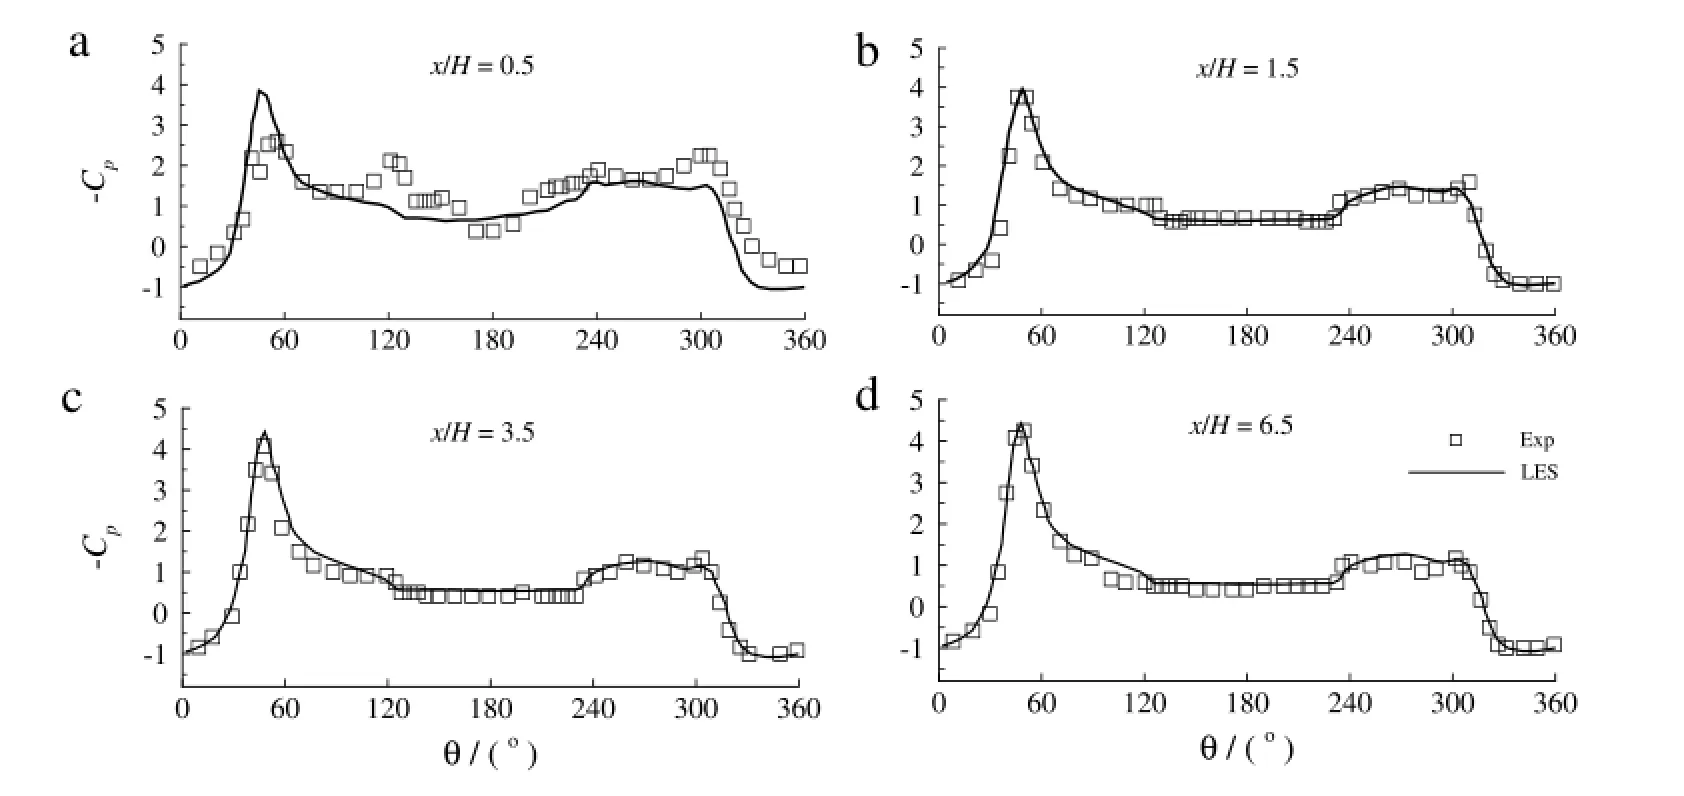
Fig.2.Comparisons of the LES results of the time-averaged surface pressure coefficients at positions along the train length with the experiment.
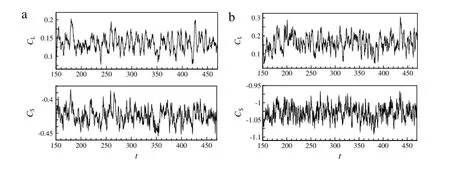
Fig.3.Time-histories of the lift force and side force coefficients at(a)ϕ=30°and(b)60°.
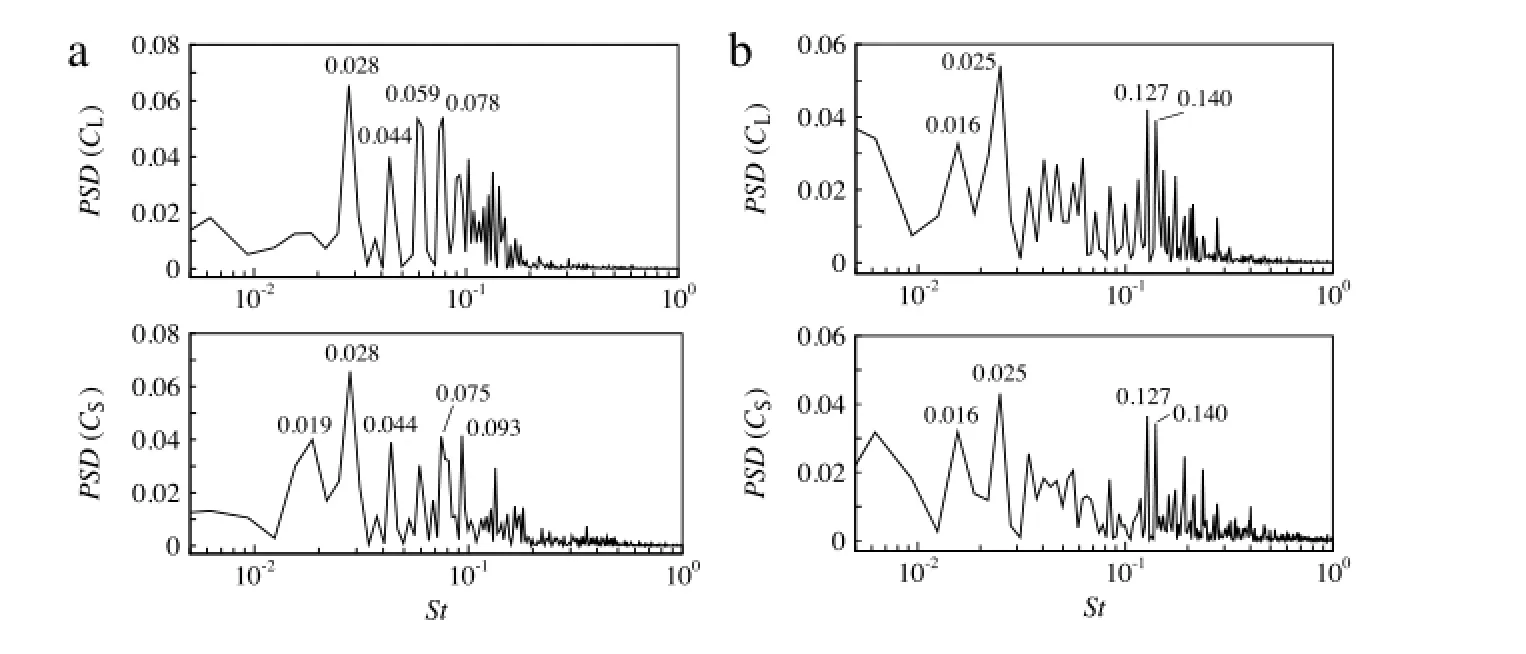
Fig.4.Power spectra of the time-dependent lift force and side force coefficients at(a)ϕ=30°and(b)60°.

Table 1Time-averaged values of the lift force and side force coefficients.

where, Fyand Fzare the lift and side force s , Ayand Azdenote the train projected area s in y- and z-direction, respectively. Figure 3 shows that the cross flow around the high speed train at the two yaw angles are highly unsteady. The time average statistics of the lift force and side force coefficients are listed in Table 1. It is found that the mean values of lift force and side force coefficients increase obviously as the yaw angle increases. The mean side force coefficient at ϕ = 60° is about 2.5 times the one at ϕ = 30°. Moreover, the fluctuating magnitude of the side flow is enhanced significantly as the yaw angle increases. The root-mean-square (RMS) values of the lift force and side force coefficients at ϕ = 60° are nearly doubled than those at ϕ = 30°.
The spectral analysis is conducted to determine the dominating frequencies of the time-dependent aerodynamic forces.Figure 4 shows the power spectraldensity(PSD)profiles ofthe lift force and side force coefficients.Both the lift and side forces are dominated by several frequencies range from 0.01 to 1.0,which are consistent with the previous results in Refs.[4,5].Forϕ=30°,several dominating peaks as marked in Fig.4(a)are found with frequencies in the range of St=0.01–0.1.A number of frequency peaks are also exhibited in the range of St=0.1–1.0,which are obviously less dominant than the low frequencies.Forϕ=60°,a dominating frequency of St=0.025 is identified in the range of St=0.01–0.1. Many high frequency peaks are also found in Fig.4(b).In contrast toϕ=30°,the range of the energetic frequency atϕ=60°is apparently broadened to a higher extent and the high frequency peaks in the range of St=0.1−1.0 become more dominant.
Figure 5 shows the three-dimensional vortical structures of the flow around the train educed by theλ2-criterion[14]atϕ=30° and 60°,respectively.Forϕ=30°,as shown in Fig.5(a),a pair of asymmetric line vortices originated from the leading edge of the train nose extend downstream in the lee-side wake.Due to the proximity effect of the ground,the lower leading edge vortex is more inclined and unstable than the upperone,which isconsistent with the previous study[7].Due to the Kelvin–Helmholtz instability ofthe separated shearlayer,some elongated vortices are clearly identified on the roof-side face of the train.Vortex shedding from the roof-side face mainly occurs in the rear half of the train.The vortices shedding from the tails of the leading edges are emerged with the shear layer vortices in the lee-side wake.Forϕ=60°,the leading-edge vortices break into small vortices in a small distance from the tip of the train nose.The vortex shedding in the lee-side wake mainly occurs in the first half of the train,since the flow is more unstable at the large yaw angle.In the rear half of the train, the wake flow is dominated by the shear layer vortices and nearly unaffected by the leading edge vortices.
The flow is projected in the streamwise direction onto the four typical sectional planes of x/H=1.4,3.0,6.2,and 10.7 to study the flow structures in the lee-side wake.The choices of the crossplanes are not unique,but the principle is to elaborate on the streamwise flow structures as much as possible.In the present study,as shown in Fig.5,x/H=1.4 ischosen very close to the train nose to demonstrate the origination of the leading edge vortices. As vortex shedding in the lee-side wake mainly occurs in the first half of the train atϕ=60°,x/H=3.0 is selected.It is reasonable to select the x/H=6.2,because it is the central plane of the train along the length direction.Since vortex shedding occurs in the sidewake near the tail of the train at ϕ = 30°, x/H = 10.7 is thus selected. The following statistics of the sectional flow start from t = 150 to t = 300, with a sampling interval of Δt = 0.3.
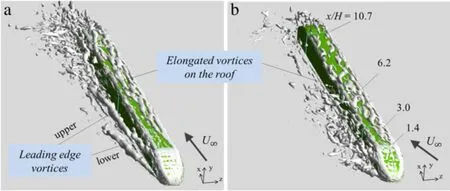
Fig.5.(Color online)Three-dimensional vortical structures educed by theλ2-criterion:(a)ϕ=30°,λ2=−5;(b)ϕ=60°,λ2=−10.
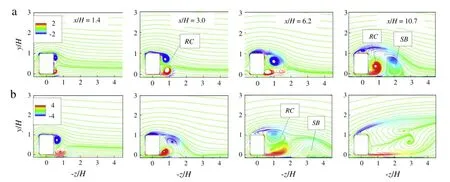
Fig.6.(Color online)Time-averaged streamlines on the sectional planes at(a)ϕ=30°and(b)60°.The color of the streamlines represents the magnitude of the timeaveraged streamwise vorticity.As marked in the figure,RC denotes the recirculation zone and SB denotes the separation bubble.(For interpretation of the references to color in this figure legend,the reader is referred to the web version of this article.)
Figure 6 shows the time-averaged streamlines on the sectional planes.Two asymmetric recirculation zones are exhibited on the lee-side wake of the train in x/H=1.4–6.2 atϕ=30°and x/H=1.4–3.0 atϕ=60°.As seen in the figure,the size of the circulation zone is increased along the length of the train,since the upper and lower shear layers roll up at a increasing distance from the train surface.The flow separation on the ground is caused by the secondary vortex induced by the lower leading edge vortex near the wall.Forϕ=30°,the flow becomes fully separated on the roof-side face of the train and a big separation bubble is formed on the ground adjacent to the recirculation zone in x/H=10.7. While for the flow pattern in x/H=6.2 atϕ=60°,two distinct recirculation zones are exhibited and the separation bubble on the ground is less robust than the former one.The flow pattern in the rear half of the vehicle atϕ=60°are also different from that of ϕ=30°.As shown in x/H=10.7 in Fig.6(b),the shearing effect of the flow is significantly enhanced and the shear layer vortices are shed further downstream in the lee-side wake.
Figure 7 shows the contour lines of the turbulent kinetic energy (TKE)on the sectional planes.The TKE distributions are related with the unsteadiness of the turbulent flow.Forϕ=30°,two high TKE zones are focused on small region around the cores of the leading edge vortices in x/H=1.4 and 3.0.When the lower leading edge vortex breaks down,the area of the high TKE region is increased in x/H=6.2.As the flow is fully separated in x/H= 10.7,the TKE in the wake flow is significantly increased,and the peak of TKE occurs in central part of the upper shear layer.For ϕ=60°,the high TKE zones in the side wake in the front half of the train are wider than that inϕ=30°,which is mainly caused by the flow instability of the leading edge vortices at the large yaw angle.In the rear half of the train,the high TKE zone is enlarged downstreamand its peak is shifted away fromthe train surface due to the enhanced shearing effectofthe upper and lower shear layers.
Figure 8 shows the distributions of time-averaged surface pressure coefficient at positions along the train length.The azimuth angleθaround the cross section of the vehicle is defined as in Fig.1.It is observed that the lateral pressure difference is mainly exerted on the front part ofthe train for the two yaw angles, both the high stagnation pressure on the windward face and the low pressure on the leeward face are significantly attenuated at the positions further downstream.As shown in Fig.8(a),two low pressure peaks are formed at the windward edge of the roof and bottom edge around the corner.The low pressure zone is gradually extended downstream from the windward to leeward edge along the train due to the expansion of the separation bubble on the roof-side face.However,the low pressure in the separation zone is gradually elevated at the downstream positions as shown in Fig.8(b)–(d).The pressure distribution on the leeward of the train remains nearly constant in x/H=10.7 atϕ=60°as demonstrated in Fig.8(d).
Figure 9 shows the aerodynamic force coefficients obtained by integrating surface pressure on the sectional planes.Since the lateral pressure differences are mainly exerted on the train surface near the nose as seen in Fig.8,the peaks of the side force occur in x/H=1.4 forϕ=30°and 60°,respectively.The near wall vortices in the lee-side wake are considered to be responsible for the side force,as the side force coefficient remains constant inx/H = 3.0–10.7 at ϕ = 30° with the existence of the side vortices and decrease in x/H = 10.7 at ϕ = 60° as the vortical structures nearly disappear in the near wake. The lift force on the train is generated due to the proximity effect of the ground. For the current flow condition, the flow separation on the roof-side face of the train under the present flow condition are also responsible for the generation of a high lift force. For ϕ = 30°, the lift force coefficient is negative in x/H = 1.4. As the flow separation on the roof-side face extends from the windward edge to the leeward edge, the lift force increases from x/H = 1.4 to x/H = 6.2 along the train. For ϕ = 60°, the flow separation on the roof-side face develops more quickly, and the maximum lift force coefficient is obtained in x/H = 3.0. The lift force begins to decrease, when the flow is fully separated from the roof-side face. The lift force approaches zero in x/H = 10.7 at ϕ = 60°. It is also noticed that the flow structures in the wake after the train tail are distinct at the two yaw angles as seen in Fig. 5. However, the influence of the wake structures after the vehicle tail on the aerodynamic behaviors is still a n issue and needs to be studied further.
In summary, LES of the cross flow around a high-speed train is studied for two typical yaw angle of ϕ = 30° and 60°, respectively. Both the mean and RMS values of the lift force and side force coefficients increase as the yaw angle increases. The mean side force coefficient at ϕ = 60° is 2.5 times o f the one at ϕ = 30°. There are several dominating frequencies of the time-dependent aerodynamic forces in the range of St=0.01−1.0 for the flow at the two yaw angles.The dominating frequency atϕ=60° is apparently broadened to a higher extent and the frequencies in the range of St=0.1−1.0 become more dominant.The three-dimensional vortical structures for the flow round the train are analyzed.Forϕ=30°,the leading edge vortices remain stable in the lee-side wake in the front half of the train,and the complex vortex shedding occurs in the rear half,i.e.the vorticesare shed from the tails of the leading edges vortices and then emerged from the shear layer vortices from the roof-and bottomside faces.Forϕ=60°,vortex shedding mainly occurs in the front half of the vehicle,while the wake flow in the rear half is dominated by the shear layer vortices and nearly unaffected by the leading edge vortices.The flow patterns,distributions of the TKE and surface forces on streamwise sectional planes are also analyzed.The associations between the side force and the lee-side wake vortices,and between the lift force and the flow separation on the roof-side face of the train are discussed.
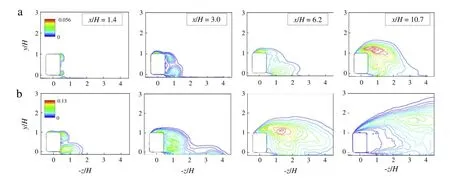
Fig.7.(Color online)Contour lines of turbulent kinematic energy on the sectional planes at(a)ϕ=30°and(b)60°.
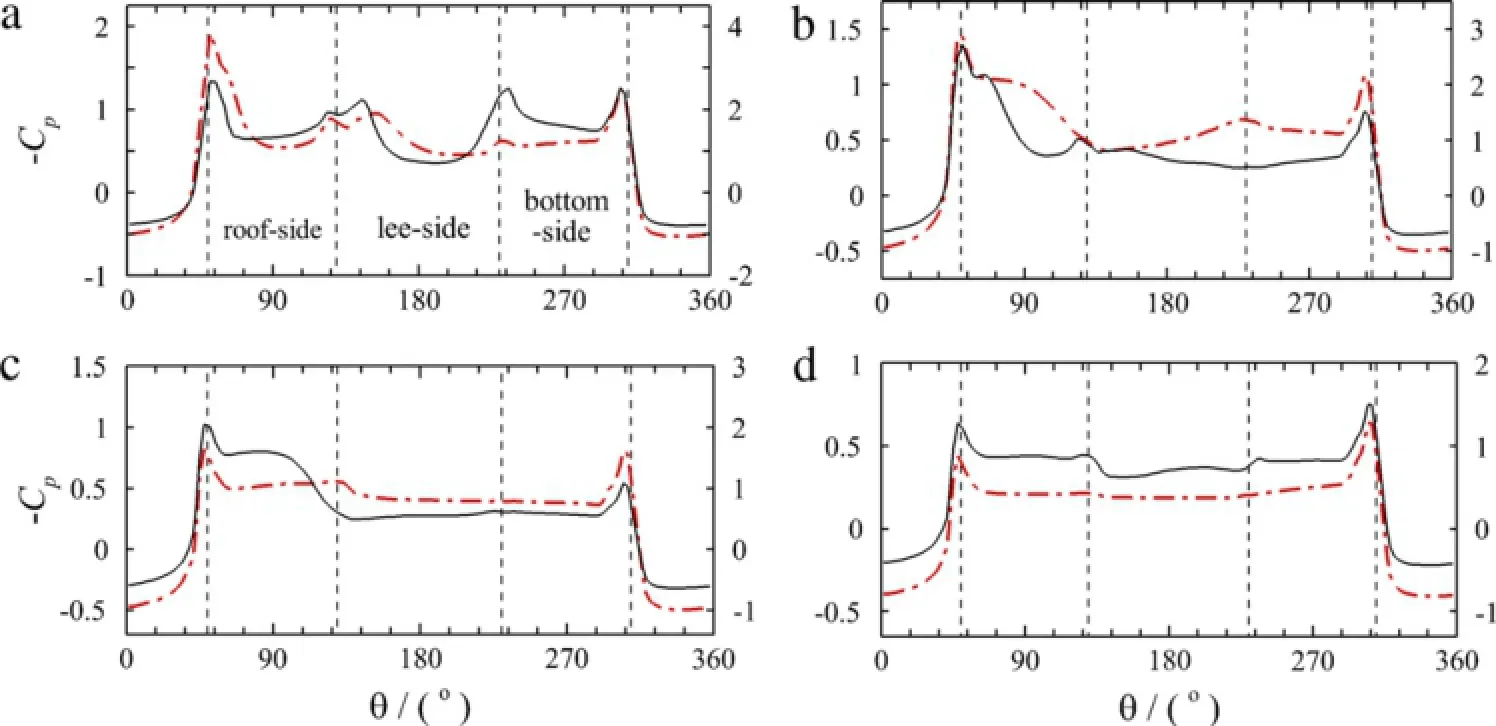
Fig.8.(Color online)Surface pressure coefficients at(a)x/H=1.4,(b)3.0,(c)6.2,and(d)10.7.The black solid line denotesϕ=30°corresponding to the left vertical coordinate and the red dash dot line denotesϕ=60°corresponding to the right vertical coordinate.
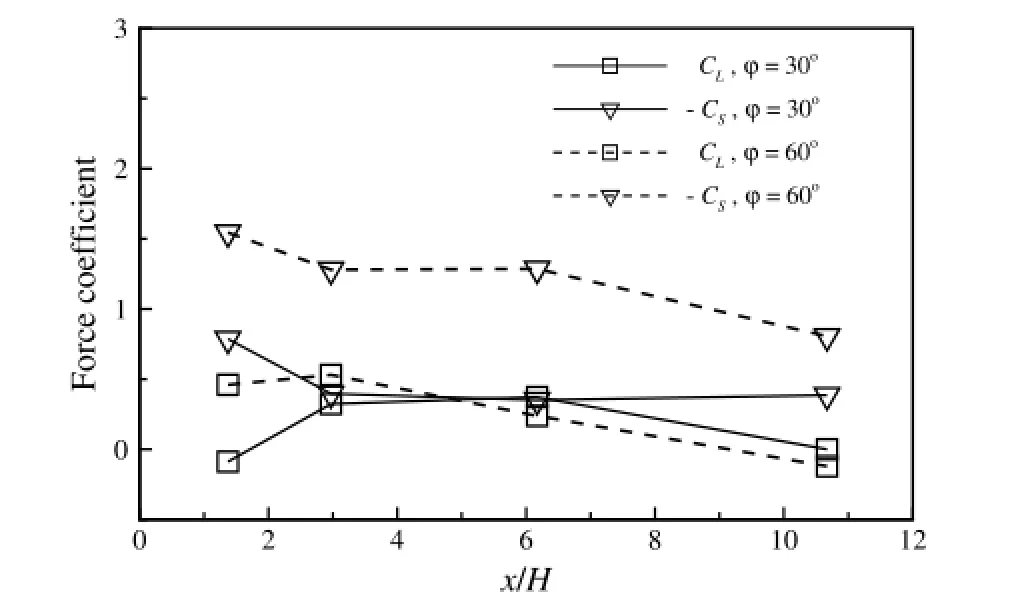
Fig.9.Streamwise distributions of the integrated lift force and side force coefficients at the two yaw angles.
Acknowledgments
This work was supported by the Knowledge Innovation Project of the Chinese Academy of Sciences,the National Natural Science Foundation of China(11402261)and the Fundamental Research Funds for the Central Universities(2013).
References
[1]C.Baker,The flow around high speed trains,J.Wind Eng.Ind.Aerodyn.98 (2010)277–298.
[2]B.Diedrichs,Aerodynamic calculations of crosswind stability of a highspeed train using control volumes of arbitrary polyhedral shape,in:BBAA VI International Colloquium on:Bluff Bodies Aerodynamics&Applications. Milano,July 20–24,2008.
[3]S.Krajnovic,P.Ringqvist,K.Nakade,et al.,Large eddy simulation of the flow around a simplified train moving through a crosswind flow,J.Wind Eng.Ind. Aerodyn.110(2012)86–99.
[4]H.Hemida,S.Krajnovic,L.Davidson,Large-eddy simulation ofthe flow around a simplified high speed train under the influence of a cross-wind,in:The 17th AIAA Computational Fluid Dynamics Conference,AIAA 2005-5354.Toronto, June 6–9,2005.
[5]S.B.Yao,Z.X.Sun,D.L.Guo,et al.,Numerical study on wake characteristics of high-speed trains,Acta Mech.Sin.29(2013)811–822.
[6]H.Hemida,C.Baker,The calculation of train slipstreams using large-eddy simulation techniques,in:The 9th World Congress on Railway Research, Challenge B:An Environmentely Friendly Railway,Lille,May 22–26,2011.
[7]H.Hemida,S.Krajnovic,LES study of the influence of the nose shape and yaw angles on flow structures around trains,J.Wind Eng.Ind.Aerodyn.98(2010) 34–46.
[8]A.Orellano,M.Schober,Aerodynamic performance of a typical high-speed train,in:Proceedings of the 4th WSEAS International Conference on Fluid Mechanics and Aerodynamics,Elounda,August 21–23,2006.
[9]A.M.Biadgo,A.Simonovic,J.Svorcan,et al.,Aerodynamic characteristics of high speed train under turbulent cross winds:a numerical investigation using unsteady-RANS method,FME Trans.42(2014)10–18.
[10]H.N.Hemida,Large-eddy simulation of the flow around simplified high-speed trains under side wind(Licentiate Engineering Thesis),Chalmers University of Technology,Goteborg,2006.
[11]C.Y.Xu,L.W.Chen,X.Y.Lu,Large-eddy simulation of the compressible flow past a wavy cylinder,J.Fluid Mech.665(2010)238–273.
[12]L.W.Chen,G.L.Wang,X.Y.Lu,Numerical investigation of a jet from a blunt body opposing a supersonic flow,J.Fluid Mech.684(2011)85–110.
[13]H.Ren,X.Y.Lu,Large eddy simulation of a vortex ring impinging on a threedimensional circular cylinder,Theor.Appl.Mech.Lett.3(2013)032007.
[14]J.Jeong,F.Hussain,On the identification of a vortex,J.Fluid Mech.285(1995) 69–94.
5 March 2015
in revised form
∗.
E-mail addresses:zhuangyq@ustc.edu.cn(Y.Zhuang),xlu@ustc.edu.cn(X.Lu).
http://dx.doi.org/10.1016/j.taml.2015.06.001
2095-0349/©2015 The Authors.Published by Elsevier Ltd on behalf of The Chinese Society of Theoretical and Applied Mechanics.This is an open access article under the CC BY-NC-ND license(http://creativecommons.org/licenses/by-nc-nd/4.0/).
*This article belongs to the Fluid Mechanics
杂志排行
Theoretical & Applied Mechanics Letters的其它文章
- Direct comparison of hydraulic tortuosity and electric tortuosity based on finite element analysis
- On the magnetic anomaly at Easter Island during the 2010 Chile tsunami
- Response of turbulent fluctuations to the periodic perturbations in a flow over a backward facing step
- Experimental study on interaction between a positive mass and a negative effective mass through a mass–spring system
- Understanding ductile-to-brittle transition of metallic glasses from shear transformation zone dilatation
- Numerical analysis of detaching and wrinkling of mechanically lined pipe during its spooling-on stage to the reel
