Fast Prediction of Acoustic Radiation from a Hemi-capped Cylindrical Shell in Waveguide
2014-07-30HongyangChenQiLiandDejiangShang
Hongyang Chen, Qi Li and Dejiang Shang*
1. National Key Laboratory on Ship Vibration >amp; Noise, China Ship Development and Design Center, Wuhan 430064, China 2. Underwater Acoustic Science and Technology Laboratory, Harbin Engineering University, Harbin 150001, China
1 Introduction1
It is very important to predict acoustic radiation accurately and quickly as the structure-borne noise and noise control are taken more and more seriously. Because of the shape complexity of structures, the numerical algorithms,such as finite element method (FEM) and boundary element method (BEM), have become a mainstream of acoustic radiation research methods. However, the chief method and multipole BEM are proposed successively, which make the BEM more perfect and applicable. After these numerical methods, Koopmann proposed the wave superposition method (WSM) based on simple source substitution(Koopmannet al., 1989). The WSM avoids singular integral and reduces the difficulty of numerical implementation greatly. It is claimed to be more suitable for engineering application (Jeans and Mathews, 1992).
The wave superposition method is also known as the equivalent source method (ESM) (Bai and Chen, 2011),source simulation method (Herrinet al., 2004),etc. It has been proven to be an effective method for acoustic radiation,scattering and acoustic holography by several researchers(Pavic, 2006; Gounot and Musafir, 2011; Biet al., 2008). In the method, the sound field is approximated by an array of equivalent sources placed inside a vibrating structure and the strengths of the equivalent sources are determined by matching the boundary conditions on the surface of structure.Therefore, the prediction for structure-borne noise in non-free spaces can be realized by changing the Green’s function of the equivalent sources.
In this paper, the sound field will be predicted from a structure by vibratory data, which is given as the known variable. The difficulty lies in describing the analytical Green’s function that acts as a vibro-acoustic transfer function between the structure and the surrounding acoustic medium.Machens proposed a method of comparative sources and a critical appraisal for acoustic radiation prediction (Machens,1999). Favre proposed an in-situ vibro-acoustic transfer function to approach Green’s function (Favreet al., 2001) and it contains the acoustic radiation from the structure and the reflection contributions by boundaries as well.
However, there are few public dissertations on structureborne noise prediction in waveguide, since the Green’s function of structure in waveguide is hard to be gotten. The BEM has been applied to acoustic radiation from a three-dimensional structure submerged in the perfect waveguide (Wu, 1994; Sarkissian, 1994), but BEM needs the three-dimensional derivation of Green’s function on the surface of structure, which can be hardly calculated except the perfect waveguide with perfectly soft or rigid boundaries. In this paper, the WSM is extended into half-space for avoiding the derivation of Green’s function in waveguide, and the effect of reflection is analyzed. Furthermore, the proposed method is combined with the sound propagation algorithms to achieve the prediction of acoustic radiation from a structure in waveguide.
2 Method of wave superposition
The superposition method is based on the idea that the acoustic field of a complex radiator can be constructed as a superposition of fields generated by an array of simple sources enclosed within the radiator. The equivalency of the superposition method to the Helmholtz-integral formulation,and hence its validity, can be developed in the following way:

The acoustic pressure atris the contribution from equivalent source, where

ωis the angular frequency,the mean density of the medium. The free-space Green’s function is defined as

which satisfies:

δis the Dirac function andiQthe volume velocity of the equivalent source at the location ofrσi. Eq. (1) can be written in a matrix form:

The normal surface velocity can be approximated by the equivalent sources as well:

wherersis a point on the surfaceSas shown in Fig. 1.
Assuming that the normal velocity values are prescribed, in matrix form, the source vectorQis related with the normal velocity by

whereUnis the matrix form of, andDis anN×Ncoefficient matrix called a dipole matrix.D−1is the components inverse of the dipole matrix. The normal velocity values are prescribed atNpoints on the surfaceS.Applying Eq. (7) to each point givesNequations forNunknownQ’s. Each element ofDis determined by the derivative of Green’s function:

If the sources whose combined fields are to approximate the radiator’s actual field are point sources, then the elements of the dipole matrix are

whereθijis the angle betweenrjandr j-rias shown in Fig. 1. As the source strength vectorQis determined by Eq. (7), Eq. (5) can be rewritten as


Fig. 1 The diagram of the equivalent source array
3 Wave superposition with boundary
Since the relationship between acoustic pressure vector and normal velocity is given by Eq. (10), the prediction for structure-borne noise with boundaries can be realized by changing the Green’s function, as the structure has been equivalent to an array of equivalent sources. When there is a boundary, by considering images of equivalent source, the Green’s function in WSM becomes the half-space Green’s function:

This formula works for soft or rigid boundary, whereη= ±1 represents the reflection coefficient. The sound pressure vector can be written by

In comparison with Eq.(7), the equivalent source vectorQis given byin Eq. (12), and therefore, the prediction of acoustic radiation in half-space is realized.However, there is a better way to match the strength of the equivalent sources.
As Fig. 2 shows, the sound field in half-space is composed of direct sound and the reflection, which can be considered as the acoustic radiation from an image. The relationship between equivalent sources and the images is similarly given by

whereh= ±1 , andare the images of normal velocity and equivalent sources, respectively. Then, the calculation of equivalent source strength can be simplified by the second equation of Eq. (13). Similarly, the normal velocity on surface1sis composed of the acoustic radiation of structure1sand its image1's:

Both velocities in Eq. (14) can be matched by the equivalent sources in the wave superposition solution:


The advantage of Eq. (16) is that the relation between equivalent sources and normal velocity is the derivative of free-space Green’s function instead of half-space Green function, which makes more simplifications, especially in waveguide with multi-layer or slop elastic bottom, since the three-dimensional derivation of Green’s function in waveguide is hard to be got. Thus Eq. (16) expands the application of WSM.

Fig. 2 The illustration of acoustic radiation with a boundary
To predict acoustic radiation by Eq. (16), the normal velocity of structure needs a treatment, as the velocity on the surface of the structure is notUn, butU. Suppose the maximum linear dimension of a structure isDand the distance between structure (geometrical center) and boundary isL. Evidently, the mean distance between structure surface σ1and equivalent sourcesQis less thanD/2, and in contrast, the mean distance between images of equivalent sourcesQ' and σ1is more than 2L. Since the structure has been equivalent to an array of monopoles by WSM, and the monopole’s attenuation meets the rule of spherical wave: 1/rwhich applies to all wave numbers(whereris the sound propagation distance), it is not difficult to conclude thatv¢nis one order of magnitude less thanUnwhen it satisfies the following inequality:

Actually, the mean distance between structure surface and equivalent sources is much less thanD/2, as the equivalent source is usually close to the structure surface instead of the geometrical center of structure. Thus given

Then, the effect of reflection on Eq. (16) can be neglected if the distance between the structure and the boundary exceeds the maximum linear dimension of the structure. The normal velocity on the surface of structure is approximated as follows:

By doing so, Eq. (16) is further simplified to

Eq. (20) shows that the boundary has a strong effect on sound propagation, but weak effect on the strength of equivalent sources, if Eq. (18) is satisfied.
4 The Green’s function in waveguide
The proposed WSM can predict sound radiation in waveguide by changing thegof Eq. (20) into the Green’s function of waveguide. Since the Green’s function of the equivalent source in WSM is given by the sound propagation algorithms, both the normal-mode and ray methods are used.
4.1 Method of normal-mode
Consider the simple case that has been first studied by Pekeris (Yang, 2008), as shown in Fig. 3, planez=0 denotes the surface of waveguide in cylindrical coordinate system, and the point source (monopole) is located onz-axis,with the ordinate valuez0. The depth of the waveguide isHand its bottom is considered as another kind of fluid medium, so there is no shear wave. The density of water and bottom medium areρ1 andρ2, and the sound speeds arec1andc2, respectively. The sound pressure in Pekeris waveguide has been deduced:


Each component in Eq. (21) meets the wave equation and boundary conditions corresponding to each normal mode.The normal mode varies with the waveguide and different source depth gives different relative intensities between modes without ever changing the form of each mode.
If there is shear wave at the bottom of the waveguide in Fig. 3, the sound pressure can also be calculated by the basic representation of the normal-mode:

whereZnis the eigenfunction of each normal mode.
After the calculation of sound pressure in waveguide, the Green’s function of WSM can be written as

Then the sound radiation of structure in waveguide is a straightforward calculation from Eq. (20).

Fig. 3 The geometry of the waveguide
4.2 Solution by ray method
As the environment assumed is the standard Pekeris waveguide illustrated in Fig. 3, the total field at a receiver can also be expressed as a sum of ray fields due to the source and its images, which are illustrated in Fig. 4. The straight lines connecting the image sources with the receiver represent the ray paths in classical ray theory.
The field is constructed with the rays from an infinite number of image sources. Since the top of Pekeris waveguide is a soft boundary, the top reflection coefficient is −1. The pressure field becomes

whereRniis the distance between images and field points:

The geometry is specified by the horizontal rangerand the source depthzni, which is given by

z0,zare the depth of source and field, respectively. The reflection coefficient of the bottom is calculated by

whereqniis the grazing angle of images. It should be noted that Eq. (28) is the plane wave reflection coefficient that is used to approximate the spherical wave whenka>1(Wang and Bradley, 2002), whereais the distance of structure away from the bottom. It is more appropriate to formulate reflection coefficient by changing the spherical sound radiation into integrals of plane wave expansion (Minet al., 2011).
The Green’s function of WSM is also given by Eq. (24).
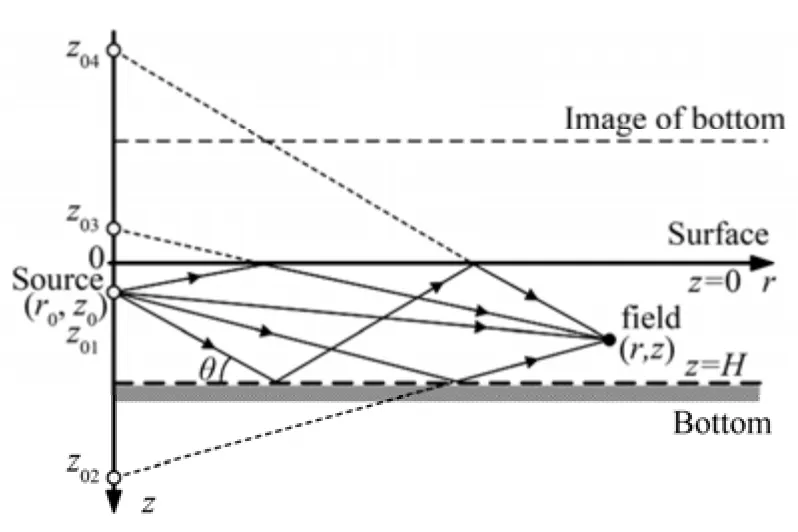
Fig. 4 The geometry of ray method in waveguide
5 Acoustic prediction with a boundary
A point source (monopole) is used to simulate the vibration and radiation of a structure. As shown in Fig. 5,there is a fictitious structure outside the monopole. The normal velocity is simulated by the monopole and is considered as the input quantity of the proposed method.Based on the Huygens principle, the sound radiation of the fictitious structure is equal to the radiation of the monopole.It is one of the effective methods for analyzing the validity of acoustic radiation prediction in the primary stage, by comparing the sound radiations of the monopole and the fictitious structure (Koopmannet al., 1989). The normal velocity simulated by the monopole may be similar to a vibration modal of the structure. Different velocity distributions can be obtained directly by changing the position of monopole. If the proposed method can predict the acoustic radiation of the fictitious structure precisely, it is greatly expected to predict the acoustic radiation from a real elastic structure.
In this paper, a fictitious hemi-capped cylindrical shell is taken as an example firstly to illustrate the validity of the proposed method, and the position of the monopole is (0,−0.2 m, 0). The fictitious structure which represents complex structure is a cylindrical shell with two hemi-caps.Its radius is 0.06 m and the total lengthD=0.48 m. The acoustic radiation and the normal surface velocity of the fictitious structure can be written respectively by the sound radiation of the monopole:
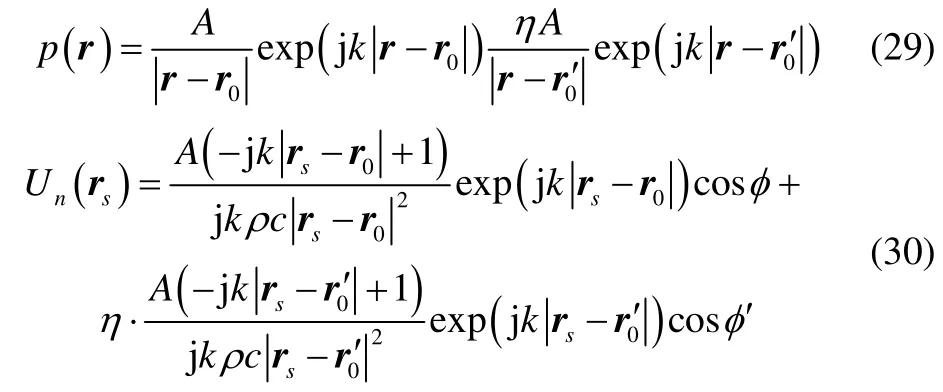
where0r,r´0are the locations of the monopole and its image.Ais the source intensity.are the angles between normal velocity and, respectively.Consider a soft boundary with a reflection coefficientη=-1 . The field points, as the acoustic prediction locations,are on a symmetrical plane with a distance 1 m away from the structure onx-axis. The locations of the field points ony-axis are: −2 m, −1 m, 0, 1 m, 2 m and the pair-wise spacing onz-axis is 0.3 m. The total number of the field points is 40 and the front five are located on the boundary,which are shown in Fig. 5.
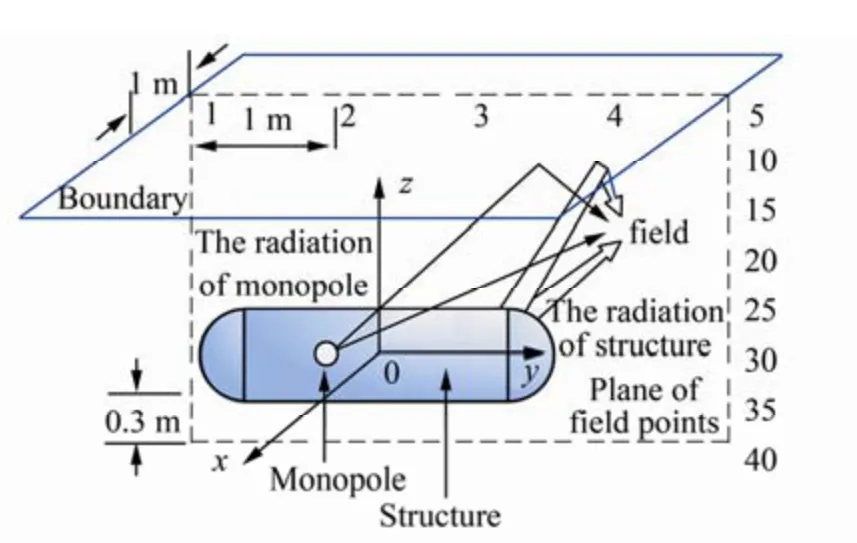
Fig. 5 The diagram of the fictitious structure analysis
5.1 The position of the equivalent sources
The configuration of the equivalent sources is another important issue of the WSM, which has been studied since the WSM proposed in 1989 (Gounot and Musafir, 2009; Bai and Chen, 2011; Gounot and Musafir, 2011). The methods such as the least square (LMS) and the genetic algorithm have been used to optimize the equivalent sources and the measuring points (Chenet al., 2013; Gounot and Musafir,2009). Therefore, it is necessary to illustrate the configuration of the equivalent sources in the example, since the improper position of the equivalent sources leads to inaccuracy.
In the example described at the beginning of the section 5,there are 58 equivalent sources corresponding to 58 measuring points. The normal velocity is supposed to be measured by accelerometers at the measuring points, which are simulated by the monopole in this example, and the location of the measuring points is shown in Fig. 6.
If the configuration of the equivalent source is reasonable,the predictive valuePconverges to the truth solution. The WSM shows that the normal velocity on the surface of the structure should be taken as a known quantity measured in advance. Meanwhile, sound pressure amplitude of reference points should also be measured in advance to search the position of the optimal equivalent source by LMS:

whereP*is the measured field pressure. Theoretically, the location of the measurement points can be chosen arbitrarily.Cis the minimum precision demand,L=1, 2, 3,…,Xis the configuration parameter of the equivalent sources.
The WSM has a better adaptability and convergence when the surface of the equivalent source and the structure are in the same shape, as the configuration 2 in Fig. 6. From the perspective of algorithm, the measuring point that is paired with the equivalent source is called selfnode; therefore, it makes the structure surface coordinate indent by a ratioK(>lt;1) to obtain the surface of the equivalent source. The search on the optimal position of the equivalent source can be realized by changing the ratioKto match the sound field pressure amplitude of the reference points. The mean error(e1) and the mean-square error (e2) are used to appraise the validity of acoustic radiation prediction.

wherepn0,pnare the truth value and predictive value,respectively, andNfis the total of the field points.
The ratioKis one of the most important parameters for the configuration. Unfortunately, there are almost few optimal positions for complex vibration distribution,especially for the case with small number of measuring points. For the example, there are two optimal indent ratios,and the improper configuration may produce great error, as shown in Fig. 7.
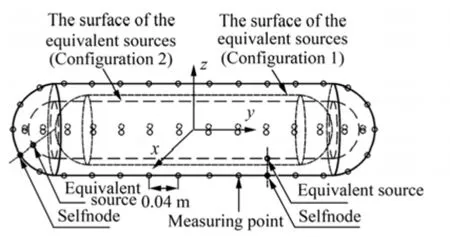
Fig. 6 The diagram of the equivalent sources and measuring points

Fig. 7 The error of acoustic prediction

Fig. 8 Prediction of sound pressure with different frequencies and normal velocities
A great error can be generated if an equivalent source deviates from this optimal position, so it is particularly important to find the position of an optimal equivalent source for a radiator with complex vibration distribution. A few reference points should be measured in advance to search the position of the equivalent source. Subsequently,the sound radiation can be predicted precisely by the normal velocity on the surface of structure.
As the configuration of the equivalent sources is finished,the position of the monopole inside the fictitious structure is changed to get different distributions of the normal velocity.The difference of sound pressure between the prediction and the analytic solution is shown in the 3D map. As shown in Fig. 8, the position of the monopole changes along they-axis from 0 to 0.24 m and the frequency ranges from 100Hz to 25 kHz. The flat portion in Fig. 8 shows that the proposed method has adaptability within a wide frequency band for different velocity distributions. In the range of frequency higher than 18 kHz, the number of measuring points does not meet the necessity of sampling theorem. The singularity causes more errors when the monopole gets close to the surface of the fictitious structure; however, it is rare for a real elastic structure, which will be proven in the following sections.
5.2 The effect of sound reflections
As the equivalent sources are optimized, more attention is paid to the WSM with boundary. The prediction of acoustic radiation from the fictitious structure is studied numerically by using the proposed method in half-space, and then in waveguide.
The depth of the fictitious structure is 0.1 m and the analysis frequency is 8 kHz. Fig. 9 gives the comparison of sound pressure. As the first five fields are located on the soft boundary, the sound pressures approach zero as expected.Since the depth of 0.1 m does not meet Eq. (18), the algorithm brings a slight error which vanishes as the depth of structure increases to 0.5 m. As shown in Fig. 10, the result in this case is nearly identical to the analytic solution of the monopole. The agreement between the two solutions reinforces the conclusion that the effect of sound reflection on the proposed method can be neglected, if the distance between the structure and the boundary exceeds the maximum linear dimension of the structure.
As the structure is fictitious, the effect of reflection caused by boundaries does not represent the effect on the vibration of structure, but on the proposed method. For steady state, the normal velocity already includes the effect of reflection and can be measured by accelerometers. Since the proposed method assumes that the normal velocity of the structure is given as the input quantity, the effect of reflection can be neglected if Eq. (18) is satisfied, as Fig. 10 shows. It should be noted that the steady state is dynamic, so there is always reflection on the surface of the structure.Therefore, for the proposed sound prediction algorithm, the effect of reflection cannot be neglected if Eq. (18) is not satisfied, as Fig. 9 shows.
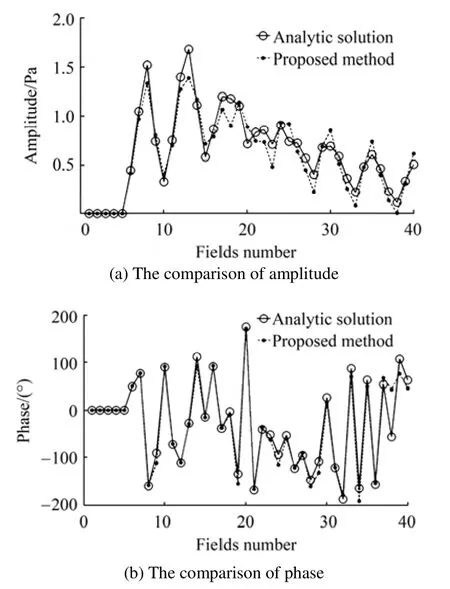
Fig. 9 Prediction of sound pressure at the depth of 0.1 m
For a real elastic structure, the effect of the reflection depends on the shape, size, thickness, material, wavelengthetc. It is a complex problem that involves fluid-solid coupling, scattering and propagation. Practically, the reflection effects on the vibration of elastic structure cannot be neglected, especially for some eigenfrequencies.However, for the algorithm it appears that the judgment becomes more straightforward, as the Eq. (18) shows. Since the judgment based on the monopole’s attenuation meets the rule of spherical wave propagation (1/r), Eq. (18) applies to all wavelengths.
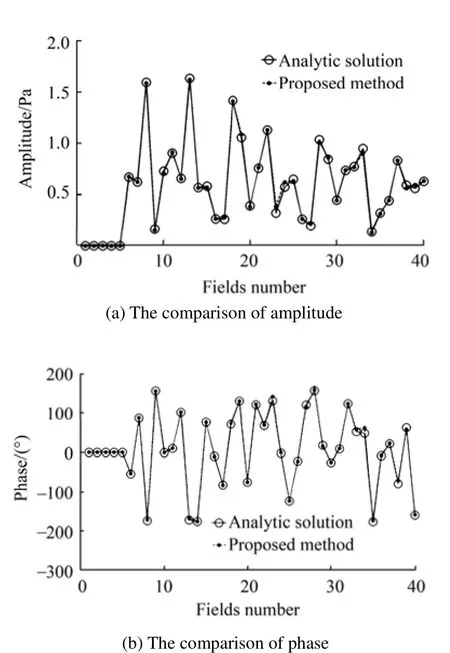
Fig. 10 Prediction of sound pressure at the depth of 0.5 m

Fig. 11 Spectra of sound pressure with a soft boundary
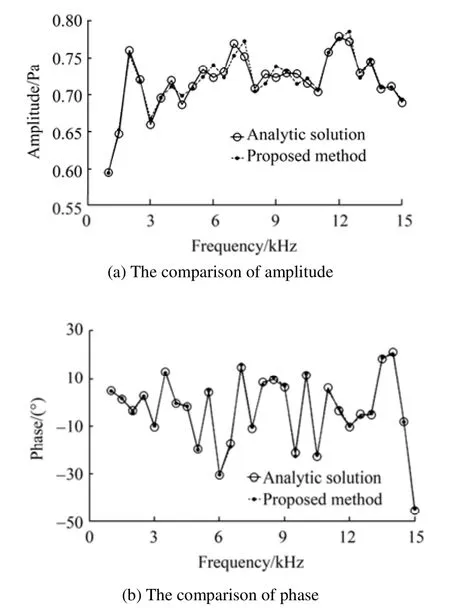
Fig. 12 Spectra of sound pressure with a rigid boundary
The mean pressure values at the 40 fields in different frequencies are shown in Fig. 11, where the depth of structure is 0.5 m, which meets Eq. (18), and the range of analysis frequency ranges from 1 kHz to 15 kHz.
Consider the second case of a rigid boundary with reflection coefficientη=1, and the rest of the parameters that are exactly the same as the case of the soft boundary. The spectra of sound pressure with a rigid boundary is compared with analytic solution in Fig. 12. The results indicate that the acoustic radiation within a wide frequency range can be predicted by the proposed method as long as the distance between the structure and the boundary exceeds the maximum linear dimension of the structure.
Actually, the boundary is neither soft nor rigid. Because of the sound absorption and transmission loss, the effect of refection is much lower than the cases shown in Fig. 11 and Fig. 12. Therefore, the proposed method is applicable,unless the structure gets extremely close to a boundary.
5.3 The sound prediction for the elastic structure
As the fictitious structure is analyzed, the elastic cylindrical shell with hemi-cap is taken as an example to illustrate the validity of the proposed method. The length and the radius of the elastic structure are the same as the fictitious structure. The thickness of the elastic structure is 0.002 m. The density of the elastic materialρs=7 800 kg/m3,Yang’s modulusE=2.1×10¹¹N/m2and the poisson ratioσ=0.3, the fluid densityρf=1 000 kg/m3and the sound velocityc=1 500 m/s.
As a reference, FEM and BEM were used to calculate the normal velocity on the surface of structure and under field pressure. The total element number on the surface of the cylindrical shell is 602, and there is a 1 N excitation on force at the end of the hemi-cap. The field points are on the numbered plane in Fig. 13 and the first four fields are located on the boundary. As shown in Fig. 14, there is no sound pressure at the location of the soft boundary.
The same as the example of the fictitious structure, there are 58 equivalent sources corresponding to 58 measuring points. But in this example, the 58 equivalent sources are used to represent the real elastic structure instead of the fictitious structure. The normal velocity on the surface of the structure is calculated by FEM with 1 N excitation, not simulated by a monopole. The same as the example of the fictitious structure, the same configuration of the equivalent sources is used to illustrate the validity of the proposed method in elastic structure. The results of the proposed method are in good agreement with the BEM solution in Fig.14. It illustrates that the prediction for acoustic radiation in half-space can be realized as the structure has been equivalent to an array of equivalent sources.
Then, two kinds of six different excitations are applied to the elastic cylindrical shell. The analysis frequency band of FEM and BEM is from 1 kHz to 10 kHz. The calculation results of the proposed WSM are in good agreement with the BEM in Fig. 15. These two motivations are used to illustrate the algorithmic adaptability to different kinds of vibration pattern.
The spectra in Fig. 15 show that the amplitude difference between the WSM and BEM is 10% or less. The phase difference is less than ±10°at the frequency band lower than 7 Hz. There is no evidence of the singularity in the analysis of the elastic structure, which proves the assumption in section 5.1. The deviation between the WSM and BEM increases at the higher frequency band, since the BEM also makes inaccuracy. Practically, the WSM shows more accuracy in the higher frequency band (Milleret al., 1991).The example of the elastic structure illustrates that, if the proposed method can predict the acoustic radiation of the fictitious structure precisely, then it can also work in the prediction of the acoustic radiation from an elastic structure.
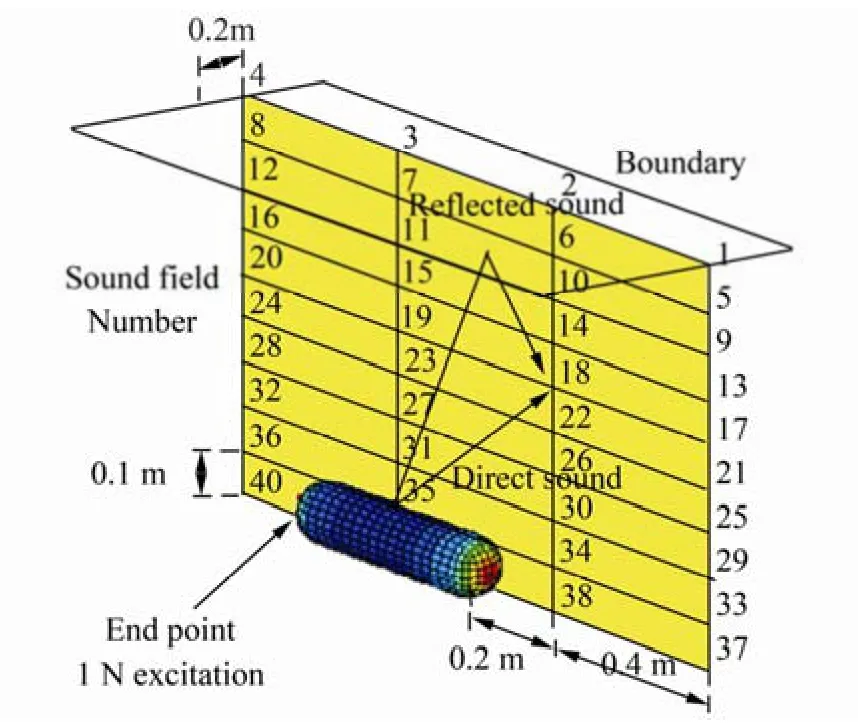
Fig. 13 The diagram of FEM+BEM analysis with boundary

Fig. 14 Acoustic prediction of elastic structure in half-space

Fig. 15 The spectra of acoustic radiation pressure from the elastic structure in half-space
5.4 The advantage of computing speed
By using the half-space Green’s function to get the strength of the equivalent sources, the traditional half-space wave superposition method needs the variation of normal velocityv'ngenerated by the boundary reflections. As the Eq. (15) shows, the variationv'nalso matches the strength of equivalent sources theoretically. However, the dipole matrix matched byv¢nis not a diagonal-dominant matrix,which leads to a great condition number and a poor numerical stability. In contrast, using the full-space Green’s function to avoid thev¢nand the derivationin section 3, hence the proposed method has more stability.Furthermore, as there is no derivation matrix, it saves almost half of the computing time in comparison with the traditional algorithm of WSM in half-space. Table 1 shows the computing time and speed advancement with the 3.00 GHz CPU speed. As the number of equivalent source increases, the dipole matrix takes a greater proportion of calculation and the speed advantage is more significant. For the larger structures, there are hundreds of equivalent sources, thus the computing speed is very important.

Table 1 Speed advantage of the proposed method
The numerical analysis presented above indicates that, by using the free-space Green function, the proposed method simplifies the process of matching equivalent sources, and can be combined with the sound propagation algorithms straightforwardly.
6 Sound radiation prediction in waveguide
As shown in Fig. 16, the model of a waveguide is analyzed. Since the influence of reflected sound on the structural vibration is small when the distance between the structure and the boundaries exceeds the maximum linear dimension of structure, the surface velocity of structure is calculated by sound radiation of a monopole in free-field by using the free-space Green’s function. The sound radiation of the monopole and the radiation of the fictitious structure were compared. The following numerical experiments were calculated by both wave theory and ray theory.
The surface of Pekeris waveguide is soft and the bottom is considered as another kind of fluid medium with the following parameters:ρ2=2 000 kg/m3,c2=2 000 m/s2,different from the parameters of water:ρ1=1 000 kg/m3,c1=1 500 m/s2. The location of the monopole is(z0,r0)=(1m, −0.2 m) and the waveguide depthzH=5 m. At the depth of 3 m, the field positionrhorizontally varies from 1 m to 500 m. The depth of the structure is 1 m, which meets Eq. (18). Hence, Eq. (20) can be used to predict acoustic radiation in waveguide.
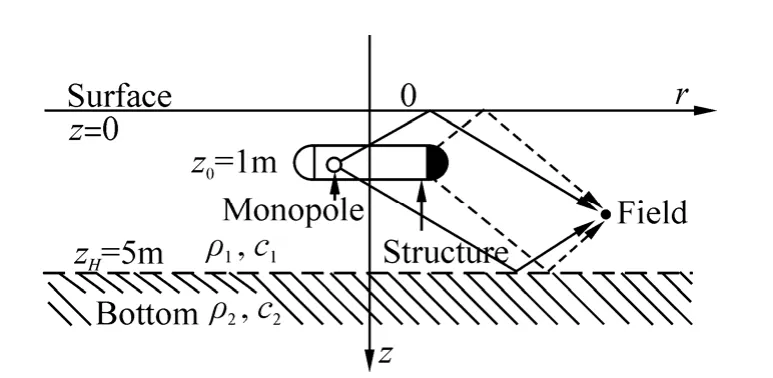
Fig. 16 The diagram of sound prediction in waveguide
There are fifty-one normal modes in the waveguide when the analysis frequency is 8 kHz, which leads to the fluctuation of sound distribution in Fig. 17(a). The “Wave theory” and “Ray theory” curves correspond to the radiation of the monopole calculated by both wave theory and ray theory. The results showed that most WSM are nearly identical to the analytical solution of the monopole, which means that the sound prediction on the fictitious structure in waveguide is realized as the structure has been equivalent to an array of equivalent sources.
Practically, the reliability of sound prediction largely depends on the sound propagation algorithms, so it is important to choose propagation algorithms appropriately.Due to the evanescent wave, the normal mode algorithm is more accurate for far-field. As Fig. 17(b) shows, there is a larger error at the first field point. This happened because the distance between the structure and the first field is 1 m,which does not meet the far-field condition.
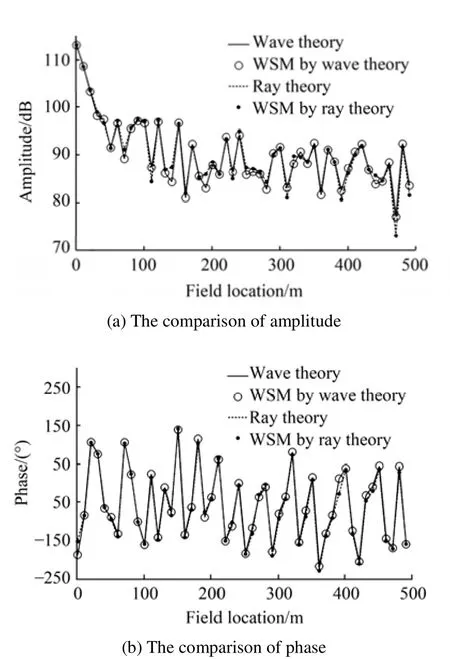
Fig. 17 Acoustic radiation prediction in waveguide (8 kHz)
For the ray method, there are 200 images, which lead to a result convergence within the range of 0→500 m. An agreement between ray theory and wave theory at the higher frequencies reinforces the hypothesis that the reflection coefficient of the bottom can be approximated by the plane wave reflection coefficient ifka>gt;1. The approximation of the reflection coefficient is a prime cause of the disagreement between the wave theory and the ray theory in Fig. 17 and Fig. 18. For the wave band lower than 5 kHz, a relatively large error is generated, since the distance between the structure and the bottom does not meet the far-field condition.A spherical wave reflection coefficient is needed. The disadvantage of using ray method is that it needs to compute a large number of images to avoid the truncation error for far-fields, which makes a slow convergence.
Actually, the bottom of the waveguide is solid and the shear wave should be taken into account. Suppose the speed of the shear wave is 1 600 m/s and other parameters are exactly the same as the Pekeris waveguide analyzed above,the sound radiation is calculated by both the wave theory and the ray theory, in which the reflection coefficient is calculated by the speed of longitudinal wave.
The sound radiation of the fictitious structure and the monopole are compared in Fig. 19. The sound pressure of the structure predicted by WSM is nearly identical to the sound pressure of the monopole. Since the method of normal-mode includes the shear wave which consumes more energy in the bottom, the sound pressure calculated by wave theory is significantly lower than by ray theory. In general,the wave theory is more applicable for waveguide with a solid bottom, while in contrast, the reflection coefficient of ray theory needs more improvement.

Fig. 18 Spectra of acoustic radiation pressure in waveguide

Fig. 19 Acoustic radiation prediction in the waveguide with a solid bottom (8 kHz)
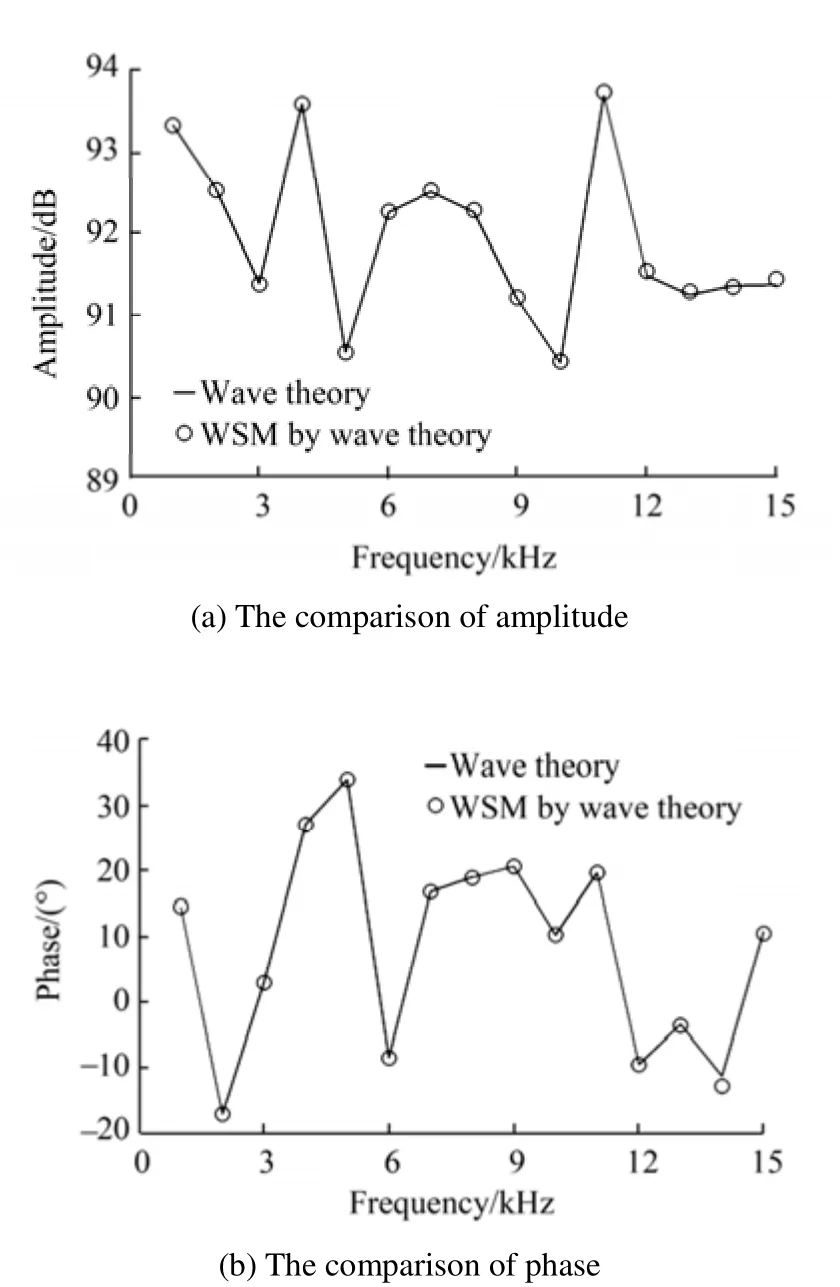
Fig. 20 Spectra of acoustic radiation pressure in the waveguide with a solid bottom
Consider the case of rock bottom. The density of the rockρ2=7 800kg/m3, and the speeds of longitudinal wave and shear wave are set to 3 600 m/s and 2 200 m/s, respectively.The acoustic absorption coefficient of 0.2 m−1is also applied in this case. By taking the sound radiation of the monopole as the standard value, the acoustic radiation of the fictitious structure calculated by wave theory is compared. Fig. 20 shows the spectra of acoustic radiation pressure within the range of 1 kHz–15 kHz. It is concluded that the WSM by normal mode method can precisely predict the acoustic radiation in the waveguide with solid bottom and acoustic absorption. Appropriate propagation algorithm should be chosen for different cases, and additional studies are needed to provide more working guidelines.
7 Conclusions
The analysis of the cylindrical shell shows that the proposed method using the free-space Green function to match the strength of equivalent sources gains better robustness and more computational efficiency, and can be used to predict acoustic radiation in waveguide by combining with propagation algorithms of monopoles. This method is greatly expected to predict the acoustic radiation from a real elastic structure in waveguide.
The effect of sound reflections on the proposed method can be neglected when the distance between the structure and the boundaries exceeds the maximum linear dimension of the structure. The approximation of the reflection coefficient is appropriate when the distance between structure and the bottom of waveguide is much larger than the radiation wavelength.
The reliability of acoustic radiation prediction in waveguide mainly depends on the sound propagation algorithms. It has been demonstrated that the normal mode algorithm is more accurate for far-field where the ray method has a slow convergence rate. For the solid bottom with shear wave, the wave theory WSM is more applicable for acoustic radiation prediction, while for the ray theory WSM, the reflection coefficient needs more improvement.Consequently, appropriate propagation algorithm should be chosen for specific cases, and additional studies are needed to provide working guidelines for cases where more complicated waveguides are to be treated.
Bai MR, Chen CC (2011). On optimal retreat distance for the equivalent source method based near field acoustical holography.Journal of the Acoustical Society of America,129(3), 1407-1416.
Bi CX, Chen XZ, Chen J (2008). Sound field separation technique based on equivalent source method and its application in nearfield acoustic holography.Journal of the Acoustical Society of America, 123(3), 1472-1478.
Chen HY, Shang DJ, Li Q, Liu YW (2013). Sound radiation prediction for underwater structure by field-matching wave superposition method.Chinese Journal of Acoustic, 38(2),137-146.
Favre CM, Hamzaoui N, Boisson C (2001). An approach for prediction of acoustic radiation from a structure with construction of the in situ vibroacoustic transfer function.Acta Acustica united with Acustica, 88, 93-103.
Gounot YJR, Musafir RE (2009). Genetic algorithms: a global search tool to find optimal equivalent source sets.Journal of Sound and Vibration, 322, 282-298.
Gounot YJR, Musafir RE (2011). Simulation of scattered field:Some guidelines for the equivalent source method.Journal of Sound and Vibration, 330, 3698-3709.
Herrin DW, Wu TW, Seybert AF (2004). The energy source simulation method.Journal of Sound and Vibration, 278,135-153.
Jeans R, Mathews IC (1992). The wave superposition method as a robust technique for computing acoustic fields.Journal of the Acoustical Society of America, 92(2), 1156-1166.
Koopmann GH, Song LM, Fahnline JB (1989). A method for computing acoustic fields based on the principle of wave superposition.Journal of the Acoustical Society of America,86(6), 2433-2438.
Machens KU (1999). Approximate solution for acoustic radiation problems: a critical appraisal of the method of comparative sources.Acustica, 85, 764-779.
Miller RD, Moyer JR, Huang H (1991). A comparison between the boundary element method and the wave superposition approach for the analysis of the scattered fields from rigid bodies and elastic shells.Journal of the Acoustical Society of America,89(5), 2185-2196.
Min HQ, Chen WS, Qiu XJ (2011). Single frequency sound propagation in flat waveguides with locally reactive impedance boundaries.Journal of the Acoustical Society of America,130(2), 772-782.
Pavic G (2006). A technique for the computation of sound radiation by vibrating bodies using multipole substitute sources.Acustica United with Acta Acustica, 92, 112-126.
Sarkissian A (1994). Method of superposition applied to scattering from a target in shallow water.Journal of the Acoustical Society of America, 95(5), 2340-2345.
Wang C, Bradley JS (2002). A mathematical model for a single screen barrier in open-plan offices.Applied Acoustics, 63,849-866.
Wu TW (1994). On computational aspects of the boundary element method for acoustic radiation and scattering in a perfect waveguide.Journal of the Acoustical Society of America, 96(6),3733-3743.
Yang Shie (2008).Theory of underwater sound propagation.Harbin Engineering University Press, Harbin, 18-26. (in Chinese)
杂志排行
Journal of Marine Science and Application的其它文章
- The Current Situation of the Study on Twisted Tape Inserts in Pipe Exchangers
- Nickel Sulfide/Graphene/Carbon Nanotube Composites as Electrode Material for the Supercapacitor Application in the Sea Flashing Signal System
- Material Selection for Hawsers for a Side-by-side Offloading System
- Optimization of Wigley Hull Form in order to Ensure the Objective Functions of the Seakeeping Performance
- Experimental Research on Flash Boiling Spray of Dimethyl Ether
- Developing a Computer Program for Detailed Study of Planing Hull’s Spray Based on Morabito’s Approach
