Flow Past an Accumulator Unit of an Underwater Energy Storage System: Three Touching Balloons in a Floral Configuration
2014-07-24AhmadrezaVaselBeHaghRuppCarriveauandDavidTing
Ahmadreza Vasel-Be-Hagh, Rupp Carriveau and David S-K Ting
Turbulence and Energy Laboratory, Centre for Engineering Innovation, University of Windsor, Ontario N9B 3P4, Canada
Flow Past an Accumulator Unit of an Underwater Energy Storage System: Three Touching Balloons in a Floral Configuration
Ahmadreza Vasel-Be-Hagh*, Rupp Carriveau and David S-K Ting
Turbulence and Energy Laboratory, Centre for Engineering Innovation, University of Windsor, Ontario N9B 3P4, Canada
An LES simulation of flow over an accumulator unit of an underwater compressed air energy storage facility was conducted. The accumulator unit consists of three touching underwater balloons arranged in a floral configuration. The structure of the flow was examined via three dimensional iso surfaces of the Q criterion. Vortical cores were observed on the leeward surface of the balloons. The swirling tube flows generated by these vortical cores were depicted through three dimensional path lines. The flow dynamics were visualized via time series snapshots of two dimensional vorticity contours perpendicular to the flow direction; revealing the turbulent swinging motions of the aforementioned shedding-swirling tube flows. The time history of the hydrodynamic loading was presented in terms of lift and drag coefficients. Drag coefficient of each individual balloon in the floral configuration was smaller than that of a single balloon. It was found that the total drag coefficient of the floral unit of three touching balloons, i.e. summation of the drag coefficients of the balloons, is not too much larger than that of a single balloon whereas it provides three times the storage capacity. In addition to its practical significance in designing appropriate foundation and supports, the instantaneous hydrodynamic loading was used to determine the frequency of the turbulent swirling-swinging motions of the shedding vortex tubes; the Strouhal number was found to be larger than that of a single sphere at the same Reynolds number.
droplet-shaped bluff body; LES; swirling flow; swinging flow; shedding vortex tubes;underwater balloons
1 Introduction
Over the last decade the electricity market has changed drastically and renewable energy sources have been introduced as alternatives for fossil-fuel based electricity generation. However, renewable energy sources suffer from a number of challenges including their highly intermittent nature, low energy density, grid congestion and stability issues. Storage facilities have the potential to offer a solution to these challenges. One of the most efficient and environmentally safe storage technologies is compressed air energy storage (CAES), which is a modification of the basic gas turbine technology (Denholm and Kulcinski, 2004; Rahman et al., 2012). The application of this underground energy storage is, however, limited to the land based power stations (Ibrahim et al., 2008); while much of renewable resources are offshore (MacKay, 2008). Hence, a variant of the original CAES, underwater compressed air energy storage UW-CAES, designed for offshore application is being built in a demonstration capacity at grid connection scale in Toronto Harbour (Cheung et al., 2012a and 2012b). In UW-CAES, the surplus electrical energy generated during the off-peak hours is converted to hydrostatic pressure by compressing air into submerged distensible accumulator units. The flexible balloons of the accumulator unit are anchored to the sea floor; hence, the stored air is pressurized by hydrostatic forces, ready to be released back to the surface to drive turbines to supply the electrical grid when needed. UW-CAES has also been studied by Pimm et al. (2011) by performing an analysis of accumulator shape and cost. The study assumed an acting force normal to the surface of the balloon owing to the differential pressure acting across the surface. This analysis can be modified by taking into account the hydrodynamic loads exerted on the accumulator by the crossing flow. In a more recent study conducted at the European Marine Energy Centre in Orkney, Pimm et al. (2014) discussed challenges associated with underwater accumulators focusing on tears occurring during the installation and operation. They also tested two different accumulators in a water tank and found a small leak causing the air hose and the accumulator to fill with water. The dynamic nature of the hydrodynamic loads produced by the crossing flow can severely affect the observed tears and leakages; hence, having insights into force characteristics of the crossing flow can be very useful in choosing a more durable material for manufacturing future balloons. Furthermore, providing a good estimate of hydrodynamic loading and structure of the flow is certainly one of the most demanding tasks to develop an optimal design for foundation, support structures and valve connections. It was the above-mentioned considerations that prompted the present study on flow over a floral unit of droplet shaped underwater balloons.
There has been significant progress in the understanding of flow over bluff bodies over the last couple of decades. Thefocus, however, has been limited to flow over regular shapes like cylinders (Zhang et al., 2010; Lotfollahi et al., 2011; Wang et al., 2011; Peng et al, 2012; Lam et al., 2012; Shimada and Ishihara, 2012; Vasel-Be-Hagh et al., 2013a) and spheres (Taneda, 1978; Constantinescu and Squires, 2003; EI Khoury et al., 2010). A literature survey on flow over bluff bodies appeared to indicate a dearth of published research exploring the cross-flow past droplet-shaped bluff bodies. Hence, first, the basic case of flow over a single balloon was examined (Vasel-Be-Hagh et al., 2013b). The current paper, however, explores the practical case of flow over three touching balloons in a floral configuration. The central aim of this paper is developing an understanding of the force characteristics and the structure of the flow over the accumulator unit of UW-CAES as an essential step to develop an efficient design.
2 Computational details
The PF20000 model of professional (PF) lift bags manufactured by Subsalve USA Corporation is a suitable choice to perform as the accumulator unit of the UW-CAES system (Subsalve USA Corporation, 2012). In order to decrease computational expenses, dimensions of the PF20000 balloon were scaled down by a factor of 100. As the force coefficients are functions of the Reynolds number, the free stream velocity is scaled up 100 times to retain the same Reynolds number. Dimensions of the scaled balloon are presented in Fig. 1(a). The touching state of floral configuration of the balloons is illustrated in Fig. 1(b). The floral unit is symmetric about the X-axis (the flow direction); therefore, characteristics of the two downstream balloons are essentially identical. Hence, only one data set is presented for the downstream balloons.
In this paper, the characteristic diameter used to define the Reynolds number is expressed as
where V and A are volume and surface area of a single balloon respectively. Accordingly, for the scaled down PF20000 balloon depicted in Fig. 1(a), the characteristic diameter D is 2.311×10⁻²m.
Dimensions of the computational domain are provided in terms of the characteristics diameter D in Fig. 2. As it is shown, length, height and width of the computational area are 40D, 11D and 13.2D respectively. The balloon is located 7.7D downstream of the inlet boundary. There is an approximate distance of 0.1D between the lowest point of the floral unit and the solid bed. It should be mentioned that the reference of the coordinate system used in this study is fixed underneath the center of the unit on the bed surface; i.e., the lowest point of the unit is at (0, 0.1D, 0). As is illustrated in Fig. 1(b), in the floral configuration studied, one of the balloons is located upstream and the other two are downstream, where the hypothetical line connecting the top of them is perpendicular to the streamwise direction. Of note, characteristics of the flow change with the angle of incidence.

Fig. 1 Dimensions and configurations of the balloons, x axis shows the streamwise direction
The three boundary conditions applied in the current simulation are also described in Fig. 2. Mass-flow-inlet condition with mass flow rate of 888.5 kg/s is set at the inlet boundary, resulting in a Reynolds number of 2.3×10⁵. The outflow boundary condition has a flow rate weighting of 1 at the outlet, as it is the only outlet of the domain. In the real application the accumulator unit is installed under deep water, therefore, to be in accordance with the real case a free surface condition should be applied on the top boundary of the computational domain. To avoid extra computational expenses the no slip condition was employed on the top boundary, due to the considerable depth this effect is expected to be small. The no slip condition is also applied at all solid-liquid interferences including side and bottom walls of the computational domain and the surface of the balloon, which is here assumed rigid (non-distensible). Regardless of the type, either pressure far-field, slip or no-slip; the simulation results should be independent of properly chosen side boundary conditions, since in the real scenario there are no boundaries around the accumulator. The literature has been largely focused on the no-slip boundary condition; verifying that if the blockage ratio (BR) is large enough, the effect of the slip boundary condition applied on the side-walls is negligible. This was our main motivation for using no-slip boundary condition.
Prasanth et al. (2006) and Prasanth and Mittal (2008) demonstrated that the effects of blockage ratio on the interactions between flow and bluff bodies are very significant at low Reynolds numbers so that the blockage ratio should be 1% or less. However, at Reynolds numbers larger than 100, the results for BR=1% and BR=5% were very close and almost independent of walls effect. At Reynolds numbers on the order of what was studied in the present paper (105) the blockage ratios are mostly chosen to be in the range of 3%–25% (Drescher, 1956; McGregor and Etkin, 1958; Fung, 1960; Schewe, 1983; Blackburn and Melbourne, 1996; Bearman and Wadcock, 1973; Sun et al., 1992). In the present paper, to ensure the negligibility of the effect of the no-slip boundary condition, the blockage ratio was set to be approximately 1.3% which is smaller than what others have been chosen for the similar cases. It should be mentioned that the blockage ratio was calculated as the ratio of frontal area of the floral unit and the cross sectional area of the computational domain.

Fig. 2 Boundary conditions and dimensions of the computational domain in terms of the characteristics diameter D
3 Mesh
Due to the non-regular shape of the balloons, an unstructured mesh was generated in the proximity of boundaries. However, to reach a mesh-independent solution with a thoroughly unstructured mesh the number of cells would exceed the capacity of the available processors (4×2.4GHz Quad-Core Intel Xeon, supported by 24 GB RAM). To have an efficient control of the mesh density, the computational domain was divided into 18 blocks. An isometric view of the mesh is illustrated in Fig. 3(a). In the central block that contains the floral unit of the balloons an unstructured mesh was generated using the T-Grid type of Tet-hybrid cells (block 1, Fig. 3(b)). In all other blocks the cooper type of hex-wedge cells was used to establish a structured mesh.
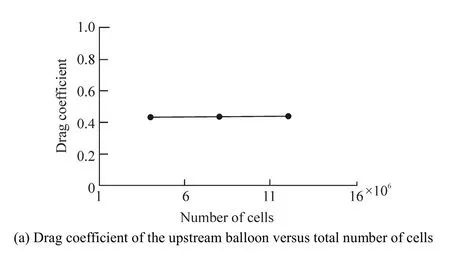
As the six blocks shown in Fig. 3(b) are meshed, the mesh size of the rest 12 blocks becomes constrained since each of them has three edges in common with the six blocks already meshed. Meldi et al. (2011) demonstrated that a filter width of Δ=L/55 is the limit for the correct application of Smagorinsky subgrid scale model in an LES simulation, where L is the large scale and in the present simulation is assumed to be the balloon height (≈2D) where D is the characteristic diameter. Accordingly, the central block with dimensions of 4D×4D×2D should contain more than (4×55/2)×(4×55/2)×(2×55/2)≈660 000 cells to assure that the grid size is smaller than the LES filter width required for the Smagorinsky subgrid scale model (≈0.036D). As can be seen in Fig. 3(b), blocks 2–6 have two edges in common with the central block. As the common edges are already meshed, the grid size in these blocks can be controlled just in one direction through setting the maximum cell aspect ratio. It is highly recommended to avoid aspect ratios larger than 5. Accordingly, three fine, extra fine and extremely fine meshes were generated with maximum aspect ratios of 5, 4 and 3, respectively, resulting in total numbers of 6×10⁶, 8×10⁶and 12×106cells. The variation of the time averaged force coefficients with these three meshes are depicted in Fig. 4. As is observed, a fair mesh independency ceased when the number of cells exceeded approximately 8×10⁶.
In the Fluent LES model, the wall boundary condition is implemented using the law-of-the-wall approach. Accordingly, there is a logarithmic relation betweenandwhereis the friction velocity, τ and ρ are wall shear stress and density of the fluid respectively. Therefore, it seems there are no computational restrictions on the near wall mesh density. Here a very fine near-wall mesh spacing on the order of 1y+= was generated as was recommended by Sagaut (2006). w
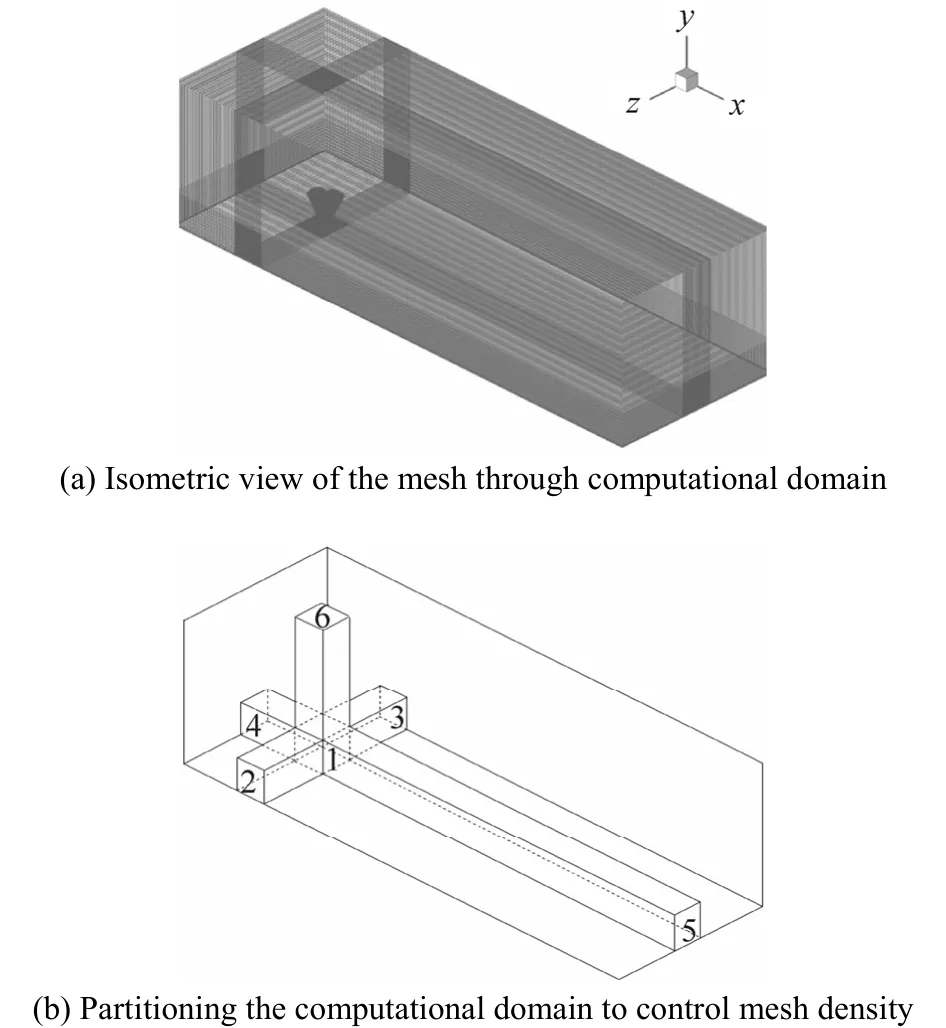
Fig. 3 Meshing of the computational domain
4 LES model
LES governs dynamics of large eddies by removingeddies with scales smaller than the grid spacing (or any other filter width) from the unsteady Navier-Stokes equations. The filtered Navier–Stokes equations are

As is seen, the filtering brings some additional unknown termsijτ namely subgrid scale stresses (SGS) which need to be determined through an SGS model. In the current paper, the SM model proposed by Smagorinsky (1963) is applied to compute the SGS stresses. The main assumption of the SM model is the equality of the SGS with the product of an eddy-viscositytμ and the resolved rate of strain tensorijS:
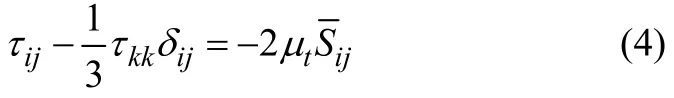
where the rate of strain tensorijS and the eddy-viscosity tμ are defined as
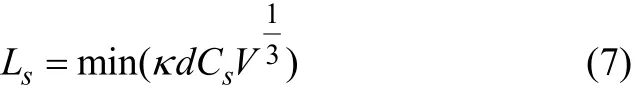

Fig. 4 Mesh independence analysis
where κ, d andsC are von Kármán constant, distance to the closest wall and Smagorinsky coefficient, respectively. The Smagorinsky coefficientsC can be kept constant, 0.1 is highly recommended (Chen et al., 2009), or dynamically computed during the simulation using the information provided by the smaller scales of the resolved fields (Germano et al., 1991; Lilly, 1992). According to literature, it seems the dynamic model gives a better prediction for the drag coefficient of bluff bodies (Mylonas and Sayer, 2012); hence, the dynamic model was adopted in the present simulation.
5 Numerical methodology and verification
All nonlinear governing equations are linearized to a scalar system of equations through an implicit method. The Gauss-Siedel solver along with a segregated algebraic multi-grid (AMG) method is applied to solve this system of equations. The pressure implicit with split operator (PISO) algorithm is used for the pressure-velocity coupling. Compared to the other algorithms (for instance simple, simplec and coupled) the PISO algorithm requires more CPU to process; on the other hand, it significantly decreases the number of iterations before convergence occurs. PISO algorithm is also more proper for skewed cells which in meshing of the current complex geometry are unavoidable. In the LES turbulence model, physical diffusion is significantly affected by numerical diffusion; consequently, the bounded central differencing scheme would be a suitable approach to conduct the spatial discretization. However, in these schemes there is no numerical damping; therefore, the numerical fluctuations affect the physical ones. Fortunately, the Fluent code efficiently obviates this issue by changing the spatial discretization scheme from the central differencing to the upwind scheme for any oscillation with awavelength less than twice the local grid spacing. This feature was the main motivation to conduct the current simulation using Fluent code. Furthermore, several researchers already verified the accuracy of the Fluent LES model in simulating flow over different bluff bodies (Chen et al., 2009; Vakil and Green, 2009, 2011; Bao et al., 2012; Mylonas and Sayer, 2012; Liu et al., 2012).
In the current simulation, the Courant number was chosen to be 0.5 with a time step of 10−3s. The number of iterations for each time step was set to be 10. Using the 8-million-cell grid described in section 3, and running on a 4×2.4 GHz Quad-Core Intel Xeon system supported by 24 GB RAM, every second of real-time flow simulation required approximately 30 hours of CPU time.
6 Structure of the flow
Consider the schematic motion of two typical particles a and b around a cylindrical surface element illustrated in Fig. 5(a). Since these particles are moving at the same linear and angular velocities ω=V/r , the micro-scale line ab leaves the surface with no spin around X axis (see Fig. 5(a)). It simply moves side to side in the wake of the cylindrical surface. Fig. 5(b) shows the motion of these particles around a surface element of a droplet-shaped body. In this case the particles are moving around unequal curves, consequently, the angular velocity of particle b is higher than the angular velocity of particle a. Hence, particle b turns around the surface ahead of particle a causing rotation of the line ab. Therefore, the line ab leaving the leeward surface has a swirling motion around the flow direction, in addition to its sideward motion in the wake of the droplet-shaped body. The combination of such rotations on the surface elements can generate vortical cores on the leeward surface. These vortical cores swirl the flow and form vortex tubes downstream of the droplet shaped bluff body.
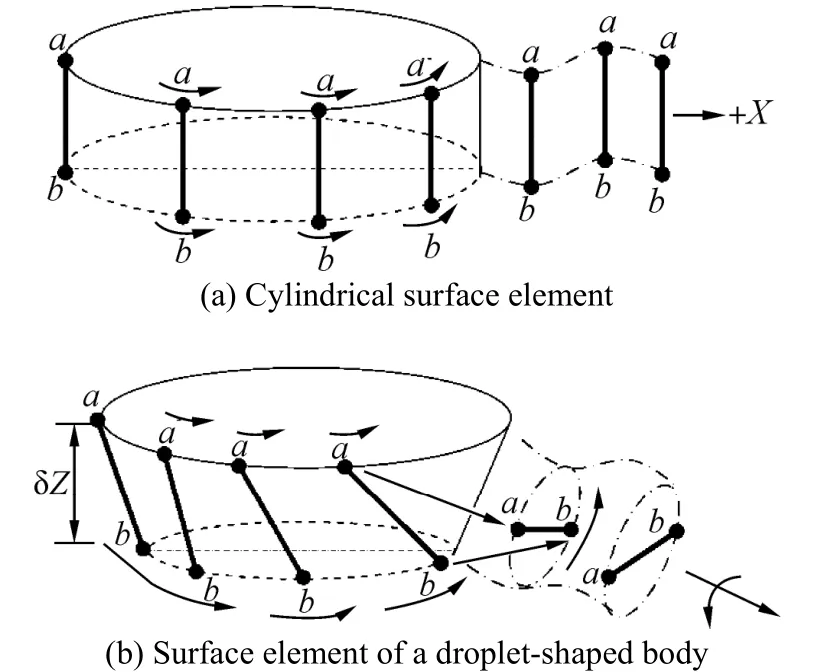
Fig. 5 The schematic motion of two typical particles aroundthe surface
Three-dimensional path lines colored by vorticity magnitude were used to examine the above-predicted swirling flows downstream of the droplet shaped balloons. The isometric, +X, +Y and +Z views of path lines downstream of the floral unit are illustrated in Fig. 6. The vortical cores on the leeward surface of the balloons and the resulting swirling flows are clearly observed in these contours. Sujudi and Haimes (1995) predicted similar swirling flows downstream of an infinite slightly tapered surface by developing a mathematical algorithm based on the critical point theory. They proved mathematically that the structure of the vortical cores and the corresponding swirling flows are very coherent for strong swirls.
Iso-surfaces of the normalized second invariant of the velocity gradient, namely the Q criterion proposed by (Hunt et al., 1988) were used to further investigate the flow pattern downstream of the balloons. The Q criterion is defined as
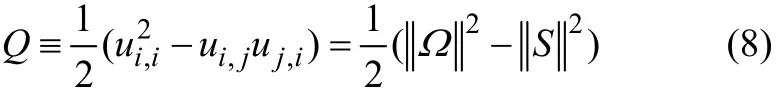
where tensors Ω and S are the anti-symmetric and symmetric parts of the velocity gradient tensor u▽ , respectively. Physically, Ω denotes vorticity rate and S represents the strain rate tensors. Therefore, in a pure irrotational straining motion the velocity gradient tensor equals to the strain rate tensor (u S▽ = ) and in the solid body rotation flow the velocity gradient tensor equals to the vorticity rate tensorTheterm is the absolute value of the vorticity rate tensor Ω which is defined as, whereis the transpose of Ω, and the trace Tr is sum of the elements lying along the main diagonal. The term Accordingly, if the strain rate is much higher than theis defined similarly. vorticity rateshear flow is dominant. However, if the rotation strength is much greater than the shear strengththe flow will be highly rotational. The Q criterion can be expressed in a suitable non dimensional form by normalizing it by. Hence theis defined as (Kamkar et al., 2011)
Accordingly, irrotational flow occurs whenand solid body rotation happens when. The highly coherent structure of the studied flow downstream of the balloons is illustrated in Fig. 7 for twovalues of 20 000 and 5 000 respectively. The shedding swirling tube flows are clearly observed downstream of the floral unit.
Accompanying these shedding-swirling motions in which fluid particles perform full rotations around vortex tubes axis, there are also some partial revolving motions due to the chaotic changes of the swirling tube flows direction. The swirling tube flows are found to be randomly moving indifferent directions sometimes interfering with and breaking up from each other. Although the directions of these flows are always changing randomly, their sources appear fixed on the leeward surface of the balloon, i.e. a kind of three-dimensional disorganized swinging motion. To visualize the swinging motion of the tube flows it would be more revealing if we look at the time evolution of the tube flows cross sections. Hence, vorticity lines are depicted on three vertical planes (P1, P2, P3) parallel to the Y-Z reference plane, that is at X=2D, 4D and 6D. These two-dimensional contours on the planes perpendicular to the flow direction illustrate the cross sections of the swirling tube flows, which due to their turbulent dynamic nature are non-circular loops.
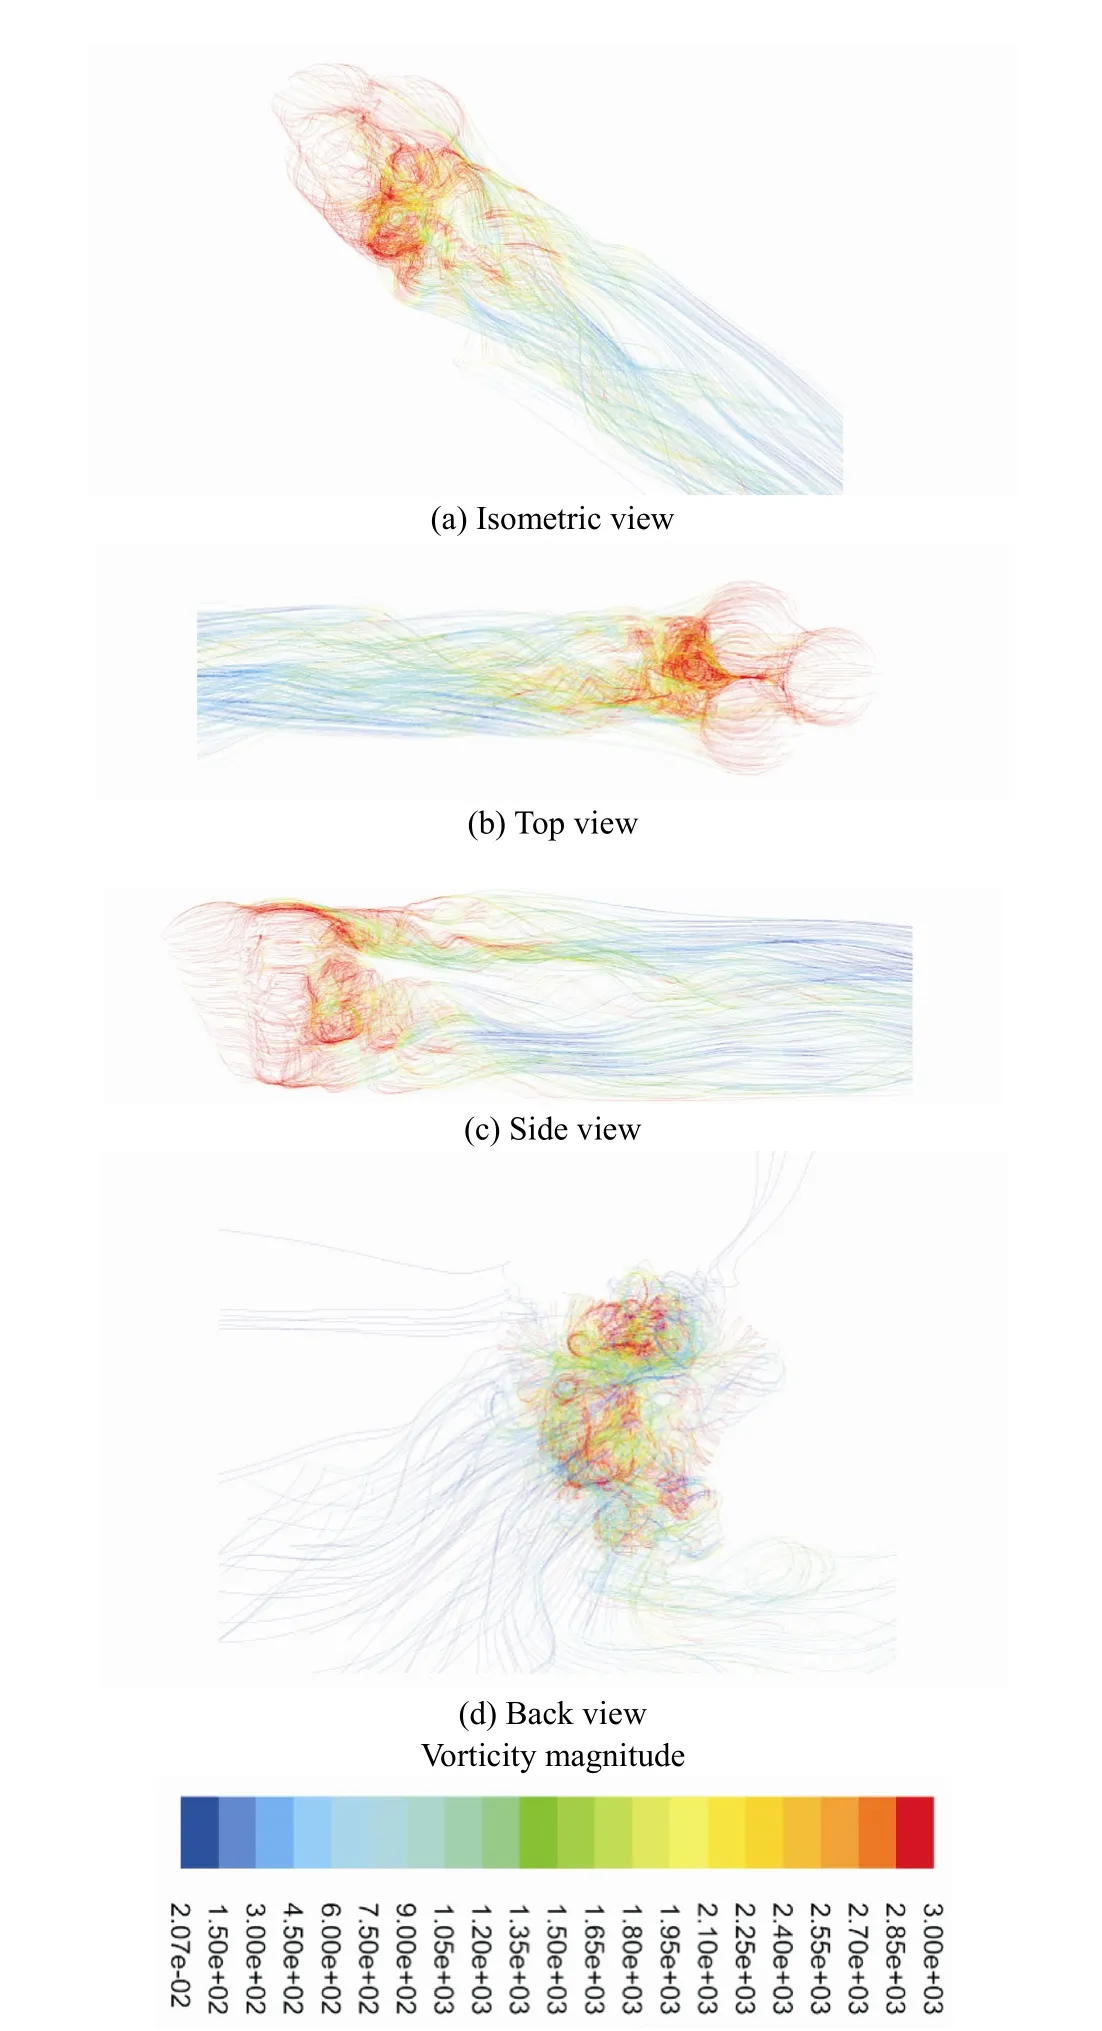
Fig. 6 Three-dimensional pathlines downstream of the balloons in the closely spaced configuration, pathlines are colored by vorticity magnitude in 1/s
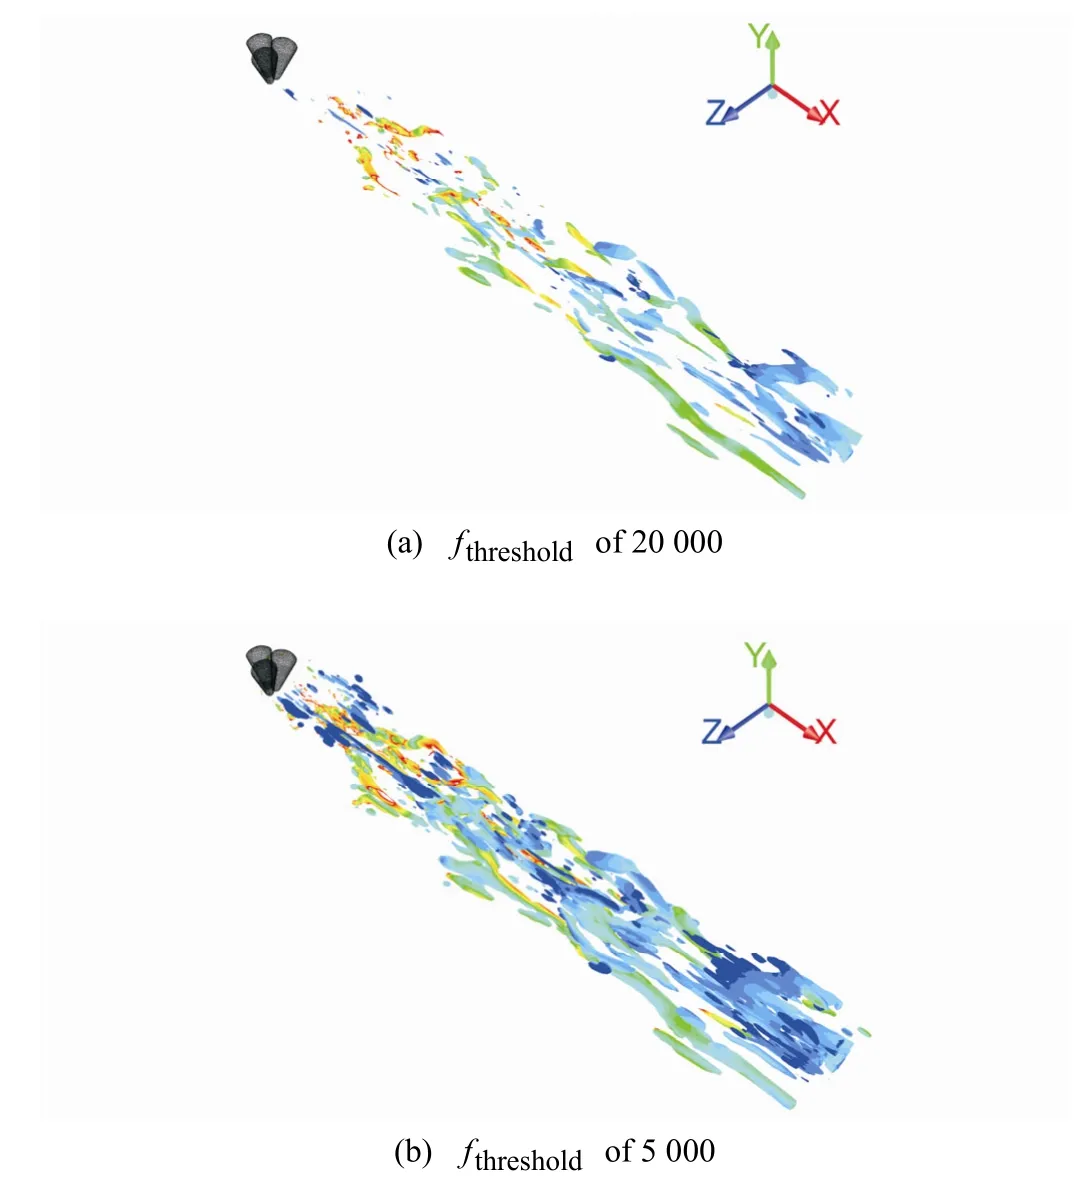
Fig. 7 Cohesive structure of vortex tubes downstream of the balloons. Iso surfaces are colored by vorticity magnitude in the same range of Fig. 6
Fig. 8 illustrates the vorticity lines downstream of the floral unit of balloons. The solid lines and dashed lines, respectively, represent the positive (counter clock wise) and the negative (clock wise) values of vorticity. Five time-series snapshots are presented at each cross section to illustrate the dynamic of the flow. As is shown in Fig. 8(a), black lines with vorticity level in the range of 700–3 000 1/s are utilized to portray flow pattern on plane P1. By moving toward downstream these lines gradually disappear so that on plane P2they have mostly faded (see Fig. 8(b)). As can be seen in panel (c), black lines are still observed on plane P3, however, to show a better illustration blue lines with a lower vorticity level in the range 300–700 1/s are added to the vorticity contour. The values assigned to vorticity lines are arbitrary and one can use somewhat different ranges of vorticity magnitudes to portray the same flow pattern. Here, an effort was made to use vorticity levels that can describe the flow pattern as clearly as possible.
7 Force characteristics

Fig. 8 Time evolution of the flow pattern downstream of the floral unit of the touching balloons, vorticity level of the black and blue lines are in the range of 700–3 000 1/s, 300–700 1/s respectively
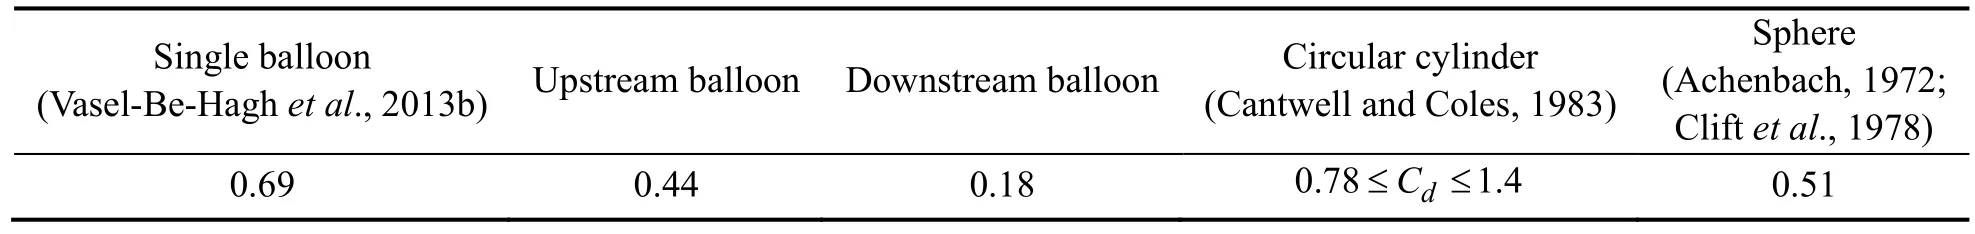
Table 1 The mean value of the drag coefficients applied on various bluff bodies at Re=2.3×10⁵
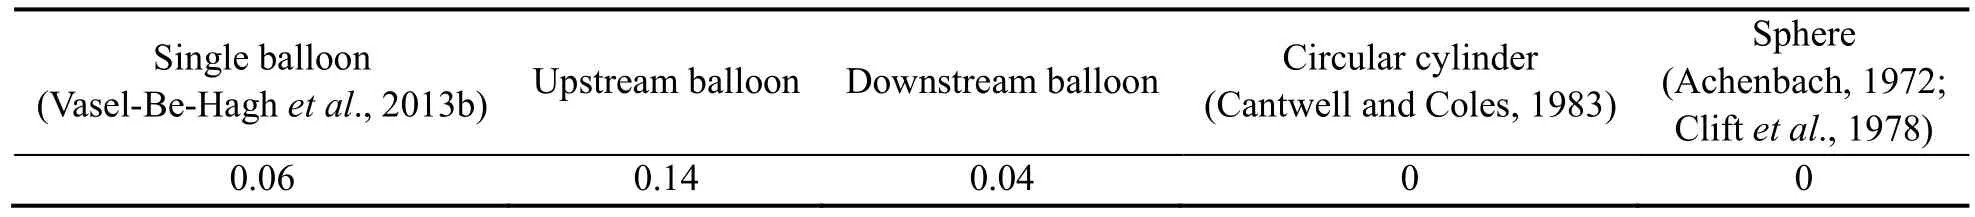
Table 2 The mean value of the lift coefficients applied on various bluff bodies at Re=2.3×10⁵
Power spectra density (PSD) of non-sinusoidal oscillations of the lift coefficients are presented in Fig. 10. Panels (a) and (b) respectively correspond to upstream and downstream balloons. These figures are plotted in log-log axes. The PSD were estimated using periodogram algorithm (Stoica and Moses, 1997). Two high peaks are observed in PSD of the downstream balloons at Strouhal numbersof approximately 0.04 and 0.29 indicating the dominant frequencies at which the swirling-swinging tube flows are randomly shed off from the balloons. The upstream balloon is impeded by the downstream ones from generating any significant swirling tube flow to shed downstream.
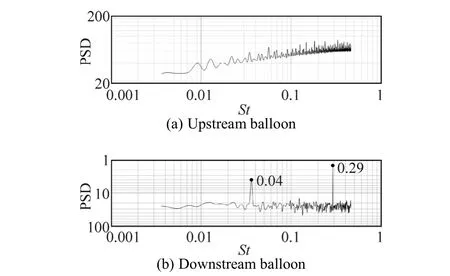
Fig. 10 Power spectrum diagrams associated with the lift coefficients of the balloons
8 Conclusions
Flow over a floral configuration of three touching energy storage balloons was simulated. The underwater balloons were assumed to be a droplet-shaped stationary bluff body and the free stream Reynolds number was set at 2.3×10⁵. Here the key findings are summarized.
1) Flow around droplet-shaped bluff bodies generates shedding swirling-swinging tube flows. This may be attributed to the motion of fluid particles around non-equal circular sections while crossing the bluff body.
2) The swirling tube flows are found to be randomly swinging in different directions; sometimes interfering with and breaking up from each other.
3) The drag coefficient of the upstream and downstream balloons are lower than that of a single balloon when they are compared individually.
4) To compare the hydrodynamic efficiency of the floral unit of three touching balloons with a single balloon it is better to considering the touching floral unit as a single bluff body. According to Table 1, the drag coefficient of the unit is 0.8, which is not too much larger than that of a single balloon whereas it provides three times the storage capacity.
5) The frequency of the vortex tube shedding falls in the range of St ≈ 0–0.4 with a high peak at St ≈ 0.29 which is associated with the downstream balloons. The upstream balloon is blocked by the downstream ones from shedding any vortex tube.
Achenbach E (1972). Experiments on the flow past spheres at very high Reynolds numbers. Journal of Fluid Mechanics, 54(3), 565-575.
Bao Y, Huang C, Zhou D, Tu J, Han Z (2012). Two-degree-of-freedom flow-induced vibrations on isolated and tandem cylinders with varying natural frequency ratios. Journal of Fluids and Structures, 35(1), 50-75.
Bearman PW, Wadcock AJ (1973). The interaction between a pair of circular cylinders normal to a stream. Journal of Fluid Mechanics, 61(3), 499-511.
Blackburn HM, Melbourne WH (1996). The effect of free-stream turbulence on sectional lift forces on a circular cylinder. Journal of Fluid Mechanics, 11, 267-292.
Cantwell B, Coles D (1983). An experimental study of entrainment and transport in the turbulent near wake of a circular cylinder. Journal of Fluid Mechanics, 136, 321-374.
Chen HL, Dai SS, Li J, Yao XL (2009). Three-dimensional numerical simulation of the flow past a circular cylinder based on LES method. Journal of Marine Science and Application, 8(2), 110-116.
Cheung B, Cao N, Carriveau R, Ting DS-K (2012a). Distensible air accumulators as a means of adiabatic underwater compressed air energy storage. International Journal of Environmental Studies, 69(4), 566-577.
Cheung B, Carriveau R, Ting DS-K (2012b). Storing energy underwater. ASME Mechanical Engineering Magazine, 134(12), 38-41.
Clift R, Grace JR, Weber ME (1978). Bubbles, drops, and particles.Academic Press Inc, New York, United States, 97-137.

Fig. 9 Time history of the drag coefficient and lift coefficient
Constantinescu GS, Squires KD (2003). LES and DES investigations of turbulent flow over a sphere at Re = 10,000. Flow, Turbulence and Combustion, 70(1-4), 267-298.
Denholm P, Kulcinski GL (2004). Life cycle energy requirements and greenhouse gas emissions from large scale energy storage systems. Energy Conversion and Management, 45(13-14), 2153-2172.
Drescher H (1956). Messung der auf querangestromte zylinder ausgeubten zeitlich veranderten drucke. Zeitschrift fur Flugwissenschaften und Weltraumforschung, 4, 17-21.
El Khoury GK, Andersson HI, Pettersen B (2010). Cross flow past a prolate spheroid at Reynolds number of 10000. Journal of Fluid Mechanics, 659, 365-374.
Fung YC (1960). Fluctuating lift and drag acting on a cylinder in a flow at supercritical Reynolds numbers. Journal of the Aerospace Sciences, 27(11), 801-814.
Germano M, Piomelli U, Moin P, Cabot WH (1991). A dynamic subgrid-scale eddy viscosity model. Physics of Fluids A, 3(7), 1760-1765.
Hunt JCR, Wray AA, Moin P (1988). Eddies, streams, and convergence zones in turbulent flows. Center for Turbulence Research, Stanford University, technical report No. CTR-S88.
Ibrahim H, Ilinca A, Perron J (2008). Energy storage systems—Characteristics and comparisons. Renewable and Sustainable Energy Reviews, 12(5), 1221-1250.
Kamkar SJ, Wissink AM, Sankaran V, Jameson A (2011). Feature-driven Cartesian adaptive mesh refinement for vortex-dominated flows. Journal of Computational Physics, 230(16), 6271-6298.
Lam K, Lin YF, Zou L, Liu Y (2012). Numerical study of flow patterns and force characteristics for square and rectangular cylinders with wavy surfaces. Journal of Fluids and Structures, 28(1), 359-377.
Lilly DK (1992). A proposed modification of the Germano subgrid-scale closure method. Physics of Fluids A: Fluid Dynamics, 4(3), 633-635.
Liu ZG, Liu Y, Lu J (2012). Fluid-structure interaction of single flexible cylinder in axial flow. Computers & Fluids, 56, 143-151.
Lotfollahi Yaghin MA, Mojtahedi A, Ettefagh MM, Aminfar MH (2011). Experimental investigation of TARMAX model for modeling of hydrodynamic forces on cylinder-like structures. Journal of Marine Science and Application, 10(3), 281-288.
MacKay DJC (2008). Sustainable energy–without the hot air. Cambridge UIT Cambridge Ltd, Cambridge, England, 60-67.
McGregor DM, Etkin BE (1958). Investigation of the fluctuating pressures on a circular cylinder in an airstream. Physics of Fluids, 1(2), 162-164.
Meldi M, Lucor D, Sagaut P (2011). Is the Smagorinsky coefficient sensitive to uncertainty in the form of the energy spectrum? Physics of Fluids, 23(12), 1-14.
Mylonas D, Sayer P (2012). The hydrodynamic flow around a yacht keel based on LES and DES. Ocean Engineering, 46, 18-32.
Peng YF, Sau A, Hwang RR, Yang WC, Hsieh CM (2012). Criticality of flow transition behind two side-by-side elliptic cylinders. Physics of Fluids, 24(3), 1-36.
Pimm AJ, Garvey SD, Drew RJ (2011). Shape and cost analysis of pressurized fabric structures for subsea compressed air energy storage. Proceedings of the Institution of Mechanical Engineers, Part C: Journal of Mechanical Engineering Science, 225(5), 1027-1043.
Pimm AJ, Garvey SD, Jong M (2014). Design and testing of energy bags for underwater compressed air energy storage. Energy, 66, 496-508.
Prasanth TK, Behara S, Singh SP, Kumar R, Mittal S (2006). Effect of blockage on vortex-induced vibrations at low Reynolds numbers. Journal of Fluids and Structures, 22(6-7), 865-876.
Prasanth TK, Mittal S (2008). Vortex-induced vibrations of a circular cylinder at low Reynolds numbers. Journal of Fluid Mechanics, 594, 463-491.
Rahman F, Rehman S, Abdul-Majeed MA (2012). Overview of energy storage systems for storing electricity from renewable energy sources in Saudi Arabia. Renewable and Sustainable Energy Reviews, 16(1), 274-283.
Sagaut P (2006). Large eddy simulation for incompressible flows–An introduction. 3rd edition. Springer, Berlin Heidelberg, 1-556.
Schewe G (1983). On the force fluctuations acting on a circular cylinder in crossflow from subcritical up to transcritical Reynolds numbers. Journal of Fluid Mechanics, 133(1), 265-285.
Shimada K, Ishihara T (2012). Predictability of unsteady two-dimensional k-ε model on the aerodynamic instabilities of some rectangular prisms. Journal of Fluids and Structures, 28, 20-39.
Smagorinsky J (1963). General circulation experiments with the primitive equations. Monthly Weather Review, 91(3), 99-164.
Stoica P, Moses R (1997). Introduction to spectral analysis. Prentice Hall Inc, Upper Saddle River, New Jersey, USA, 25-26.
Subsalve USA Corporation (2012). Underwater lift bags. Available from http://subsalve.com/images/Subsalve_catalogweb2011.pdf [read on 07.06.2012].
Sujudi D, Haimes R (1995). Identification of swirling flow in 3-D vector fields. Cambridge, USA, Technical Report No. AIAA 95-1715, 1-8.
Sun TF, Gu ZF, He DX, Zhang LL (1992). Fluctuating pressure on two circular cylinders at high Reynolds numbers. Journal of Wind Engineering and Industrial Aerodynamics, 41(1-3), 577-588.
Taneda S (1978). Visual observations of the flow past a sphere at Reynolds numbers between 104 and 106. Journal of Fluid Mechanics, 85(1), 187-192.
Vakil A, Green SI (2009). Drag and lift coefficients of inclined finite circular cylinders at moderate Reynolds numbers. Computers & Fluids, 38(9), 1771-1781.
Vakil A, Green SI (2011). Two-dimensional side-by-side circular cylinders at moderate Reynolds numbers. Computers & Fluids, 51(1), 136-144.
Vasel-Be-Hagh AR, Ting DS-K, Carriveau R (2013a). Correlating flow pattern with force coefficients in air flow past a tandem unit of three circular cylinders. International Journal of Fluid Mechanics Research, 40(3), 235-253.
Vasel-Be-Hagh AR, Carriveau R, Ting DS-K (2013b). Numerical simulation of flow past an underwater energy storage balloon. Computers & Fluids, 88, 272-286.
Wang S, Zhu L, Zhang X, He G (2011). Flow past two freely rotatable triangular cylinders in tandem arrangement. Journal of Fluids Engineering, 133(8), 081202-02.
Zhang X, Su YM, Yang L, Wang ZL (2010). Hydrodynamic performance of flapping-foil propulsion in the influence of vortices. Journal of Marine Science and Application, 9(2), 213-219.
Author biographies


Rupp Carriveau is a director and associate professor in the Turbulence and Energy Laboratory at the University of Windsor, Lumley Centre For Engineering Innovation. His research focuses on clean energy generation, storage, and smart optimization. He works extensively with utilities, power, agricultural, and automotive industries. Dr. Carriveau is active on the Editorial Boards of Wind Engineering, International Advances in Energy Research, Advances in Life Sciences, and the International Journal of Sustainable Energy. He is also the President of the International Underwater Compressed Air Energy Storage Society.

David S-K Ting After receiving his PhD in Combustion from University of Alberta in 1995, he spent two years working on Flow-Induced Vibrations as a post-doctorate fellow at McGill before joining University of Windsor as an assistant professor. He is currently a professor in Mechanical, Automotive and Materials Engineering and the co-founder of the Turbulence & Energy Laboratory at the University of Windsor. Ting supervises students on a wide range of research projects involving Turbulence and/or Energy. To date, he has co/supervised over forty graduate students and co-authored over sixty journal papers.
1671-9433(2014)04-0467-10
Vasel-Be-Hagh
a BSc degree in Mechanical Engineering from Ferdowsi University (FUM) in 2008. After completing the MSc degree focusing on Lattice Boltzmann modeling, he was honoured to be awarded an Ontario Trillium Scholarship from the government of Ontario valued at 160,000$ to pursue his education in Canada. For his PhD research, he is conducting simulations in concert with laboratory experiments to investigate hydrodynamics of accumulators of compressed air for an underwater compressed air energy storage plant. He has published one text book, eight journal papers and six conference papers so far.
J. Marine Sci. Appl. (2014) 13: 467-476
10.1007/s11804-014-1277-3
Received date: 2014-01-29.
Accepted date: 2014-08-25.
*Corresponding author Email: vaselb@uwindsor.ca
© Harbin Engineering University and Springer-Verlag Berlin Heidelberg 2014
杂志排行

Journal of Marine Science and Application的其它文章
- The Current Situation of the Study on Twisted Tape Inserts in Pipe Exchangers
- Nickel Sulfide/Graphene/Carbon Nanotube Composites as Electrode Material for the Supercapacitor Application in the Sea Flashing Signal System
- Material Selection for Hawsers for a Side-by-side Offloading System
- Fast Prediction of Acoustic Radiation from a Hemi-capped Cylindrical Shell in Waveguide
- Optimization of Wigley Hull Form in order to Ensure the Objective Functions of the Seakeeping Performance
- Experimental Research on Flash Boiling Spray of Dimethyl Ether