Diagnostic accuracy of enhanced liver fi brosis test to assess liver fi brosis in patients with chronic hepatitis C
2013-06-01
Catania, Italy
Diagnostic accuracy of enhanced liver fi brosis test to assess liver fi brosis in patients with chronic hepatitis C
Roberto Catanzaro, Michele Milazzo, Silvia Arona, Chiara Sapienza, Dario Vasta, Domenico Arcoria and Francesco Marotta
Catania, Italy
BACKGROUND:The prognosis and clinical management of patients with chronic liver diseases are closely related to the severity of liver fi brosis. Liver biopsy is considered the gold standard for the staging of liver fi brosis. However, it is an invasive test sometimes related to complications. This study aimed to assess the diagnostic value of enhanced liver fi brosis (ELF) test to predict liver fi brosis in patients with chronic hepatitis C.
METHODS:This study included 162 patients with liver disease and 67 healthy controls. Hyaluronic acid, tissue inhibitor of matrix metalloproteinase type 1, and amino-terminal propeptide type III procollagen were measured by enzymelinked immunosorbent assay with the ELF test ADVIA Centaur® (Siemens Healthcare Diagnostics Inc.). Fibrosis stage was determined using the Metavir scoring system.
RESULTS:In our study, for the diagnosis of signif i cant fi brosis (Metavir F≥2) a cut-off value >7.72 provides a sensitivity of 93.0% and a specif i city of 83.0%. The areas under the receiver operator characteristic curve, sensitivity, specif i city, and positive and negative predictive values were 0.94, 93.3%, 81.0%, 93.3%, and 81.0%, respectively (P<0.001). For the diagnosis of cirrhosis (Metavir F=4) a cut-off value >9.3 provides asensitivity of 93.0% and a specif i city of 86.0%. The areas under the receiver operator characteristic curve, sensitivity, specif i city, and positive and negative predictive values were 0.94, 79.1%, 90.8%, 75.6%, and 92.3%, respectively (P<0.001).
CONCLUSIONS:The ELF test is a promising non-invasive method for assessing liver fi brosis in patients with chronic hepatitis C. It is effective in the diagnosis of both fi brosis and cirrhosis.
(Hepatobiliary Pancreat Dis Int 2013;12:500-507)
enhanced liver fi brosis test;non-invasive diagnosis; liver fi brosis; blood marker
Introduction
Hepatitis C virus (HCV) causes 350 000 deaths worldwide each year. Viral hepatitis is the leading cause of liver cirrhosis and liver cancer, which in turn ranks as the third cause of cancer in the world. In the WHO European region, approximately nine million people are chronically infected with HCV.[1]Liver fi brosis is characterized by the course of chronic liver disease. It can progress to cirrhosis, resulting in complications such as portal hypertension, liver failure and hepatocellular carcinoma. The degree of liver fi brosis is decisive for the assessment and appropriate management of the disease and strongly is indicative of its prognosis. The severity of fi brosis is important to determine the need of treatment and follow-up. It can also predict the response to a treatment. The true gold standard for assessing the degree of liver fi brosis would be a histological analysis of the liver as a whole. Since this is not possible in living patients, liver biopsy has been adopted as the reference standard. However, thisdiagnostic method has some pitfalls that have led to several questions about its actual value.[2,3]The procedure involves certain risks such as pain, bleeding, perforation of other organs, and needs a histological interpretation from a special operator. Thus it affects the cost of medical care and causes strong anxiety of the patient.[4-6]
Recent studies focused on alternative diagnostic methods for the assessment of the degree of fi brosis involving either elastic waves or serum markers.[7,8]The algorithms for the interpretation of these serum biomarkers have developed in the last decade. Among them, enhanced liver fi brosis (ELF) test, which combines hyaluronic acid (HA), the tissue inhibitor of matrix metalloproteinase type 1 (TIMP-1), and the aminoterminal propeptide of type III procollagen (PIIINP), has been accurate in detecting fi brosis in a large cohort of patients with chronic liver disease.[9]Further studies[10,11]have evaluated the diagnostic algorithm in patients with various liver diseases. The ELF test has been capable in predicting the progression of the disease in different clinical settings.[12,13]It is recognized that the heterogeneous etiology of the cohorts in these studies has been a major limitation. The present study aimed to evaluate prospectively the ELF test in the assessment of its effectiveness in the diagnosis of liver fi brosis in patients with chronic hepatitis C with reference to biopsy. It also aimed to examine the development, accuracy, clinical utility and limitations of biomarkers as diagnostic tools for the assessment of liver fi brosis.
The ELF test is useful to assess the stage and rate of progression of liver fi brosis. It comprises three serum biomarkers: HA, TIMP-1 and PIIINP.[13,14]Biomarkers are direct indicators or the metabolism and degradation of the extracellular matrix, which indicate liver fi brosis. A higher concentration of individual markers leads to a higher ELF score and indicates a greater likelihood of more severe fi brosis. The ELF test has received the Conformité Européenne mark in May 2007.[15]The test for the staging of liver fi brosis has been validated in patients with chronic hepatitis C, alcoholic liver disease and non-alcoholic fatty liver disease.[16]This method can predict the presence of fi brosis with a sensitivity of 90% and the absence of fi brosis with a negative value of 92%. The test does not show any precautions and contraindications. It uses direct markers of fi brogenesis (HA and TIMP-1) and therefore unreliable results will be seen in patients with chronic diseases characterized by fi brogenesis in other organs rather than the liver.[17]Furthermore in this study, the ELF test was compared with the aspartate aminotransferase (AST)-to-platelet ratio index (APRI score), another diagnostic serologic test. APRI score=[(AST/ULN)/platelet count]×100.
Methods
The present prospective study included 162 patients with chronic hepatitis C. They were consecutively admitted to our Complex Unit for a liver biopsy in 27 months from January 2011 to March 2013. Only biopsies longer than 15 mm with at least 6 portal tracts were accepted. Exclusion criteria included the previous history of antiviral therapy, the presence of ascites, chronic kidney failure or chronic coinfection HBV/HCV or HIV/HCV, chronic liver disease of other etiology (HBV, non-alcoholic steatohepatitis, hemochromatosis, Wilson's disease, autoimmune hepatitis and α-1 antitrypsin def i ciency), liver failure, patients with alcohol abuse (taking more than 30 g/d of ethanol), heart failure or pregnancy, and patients with BMI >30 kg/m2. The diagnosis of chronic hepatitis C was determined according to the positivity of anti-HCV and HCVRNA for at least 6 months. The levels of HCV-RNA were determined by RNA extracted from serum, with reverse transcription and amplif i cation of cDNA in real time PCR with TaqMan probes, with a sensitivity of 10 IU/ mL.
Sixty-seven healthy volunteers with no indication for liver biopsy were recruited and served as controls. These subjects were regarded as healthy on the basis of normal liver function tests, negative serology for HBV, HCV and autoimmune hepatitis, normal abdominal ultrasonography, and normal renal function test. These healthy subjects had never suffered from hepatitis and had neither history of alcohol abuse nor use of hepatotoxic drugs. Written informed consents were obtained from all patients and healthy volunteers, and the study was approved by the local ethics committee according to theDeclaration of Helsinkiand Good Clinical Practice guidelines.
ELF test
The ELF test was carried out in two weeks after liver biopsy. The patients were subjected to laboratory analysis of 0.3 mL of blood taken at MedLab of Catania. Alcohol affects many of the variables used in the ELF test. Abstinence from alcohol prior to sampling was respected.[18-21]Serum sample was processed through the ELF test ADVIA Centaur® (Siemens Healthcare Diagnostics Inc.). As anin vitrodiagnostic test for multivariate indices in the assessment of liver fi brosis, it generates a single score (ELF score) combined with doses of HA, PIIINP and TIMP-1. This newer algorithm has been shown to maintain its diagnostic performance compared to the Original European Liver Fibrosis (OELF) panel including the variable "age".[22]This score measures the qualitative and quantitative variations ofthe extracellular matrix of the liver, allowing a dynamic assessment of the activity of fi brogenesis and fi brinolysis. The ELF score is a numerical value with no units of measurement. In calculating the ELF score, ADVIA Centaur analyzers use the ADVIA Centaur doses of HA, PIIINP and TIMP-1 in the following formulae: ELF score per ADVIA Centaur XP=2.278+0.851 ln[CHA]+0.751 ln[CPIIINP]+0.394 ln[CTIMP-1]; ELF score per ADVIA Centaur CP=2.494+0.846 ln[CHA]+0.735 ln[CPIIINP]+ 0.391 ln[CTIMP-1]. The test was based on the fi rst formula. The ELF test is for exclusive use of the ADVIA Centaur®. The interpretation of the severity of liver fi brosis with the ELF score is shown as none/mild, ELF score <7.7; moderate, ELF score 7.7-9.8; and severe, ELF score ≥9.8.
Liver histology
Percutaneous liver biopsies were performed under ultrasound guidance by a specialist, using an 18-G disposable needle. The biopsy specimens were fi xed with formalin and stained with hematoxylin and eosin. All of the liver biopsies were evaluated by expert pathologists, who were blinded to the patients' clinical histories. The stage of fi brosis was evaluated according to the histological staging of Metavir. Fibrosis was classif i ed by the Metavir scoring system into fi ve stages: 0 (no fi brosis), 1 (portal fi brosis without septa), 2 (portal fi brosis with rare septa), 3 (many septa without cirrhosis), and 4 (cirrhosis).[23]
Statistical analysis
Quantitative variables were expressed as median (range) or mean±standard deviation and qualitative variables in percentage. The diagnostic values of the ELF test in predicting signif i cant fi brosis and cirrhosis were assessed by calculating the areas under the receiver operator characteristic (AUROC) curve. AUROC was also expressed with standardization according to fi brosis stages, advanced and non-advanced, to prevent a spectrum bias.[24]Adjusted AUROC (AdjAUROC) was independent from fi brosis stages and was calculated by observed AUROC (ObAUROC) using the formula AdjAUROC=ObAUROC+[0.1056×(2.5-ObDANA)], according to the difference in advanced [F2-F3-F4] and non-advanced [F0-F1] fi brosis (DANA method). Best cut-off values were determined by optimization of the Younden index. Sensitivity (Se), specif i city (Sp) and positive and negative predictive values (PPV and NPV) were calculated. Positive likelihood ratios were calculated based on the values of sensitivity and specif i city.
Statistical analysis was performed with SPSS 20.0 (SPSS Inc., Chicago, IL, USA), except for AUROC comparisons performed with MedCalc 12.4.0.Pvalues lower than 0.05 and 0.01 were considered signif i cant and highly signif i cant, respectively.
Results
One hundred and sixty-two patients were enrolled in this study, with a mean age of 55.19±9.53 years and a female/male ratio of 1.8. Sixty-seven healthy subjects served as controls, with a mean age of 51.43±10.24 years and a female/male ratio of 1.5. The results were grouped by two different cut-off values: signif i cant (Metavir F≥2) or non-signif i cant fi brosis (Metavir F<2) and presence (Metavir F=4) or absence of cirrhosis (Metavir F<4).[25]Following such classif i cation, we divided the patients into two groups (Tables 1 and 2).
The increased mean values of the ELF test were in parallel to the stages of fi brosis (7.63±0.42 in F1, 8.70 ± 0.88 in F2, 9.07±0.68 in F3 and 10.10±0.54 in F4; allP<0.05 between adjacent fi brosis stages) (Fig. 1). Moreover, there was no overlap between F=1 and F≥2 or between F<4 and F=4 (Fig. 2).
Signif i cant fi brosis
The AUROC for the diagnosis of signif i cant fi brosis(Metavir F≥2) was 0.94 (95% CI: 0.89-0.97), with an optimal ELF test cut-off value for the diagnosis of signif i cant fi brosis equal to 7.72 that may provide a sensitivity of 93.0% and a specif i city of 83.0% (Fig. 3). The sensitivity and specif i city of the ELF test in the diagnosis of signif i cant fi brosis were 93.3% and 81.0%, respectively (Table 3).

Table 1.Baseline characteristics of patients and healthy controls

Table 2.Staging and ELF test (n, %)
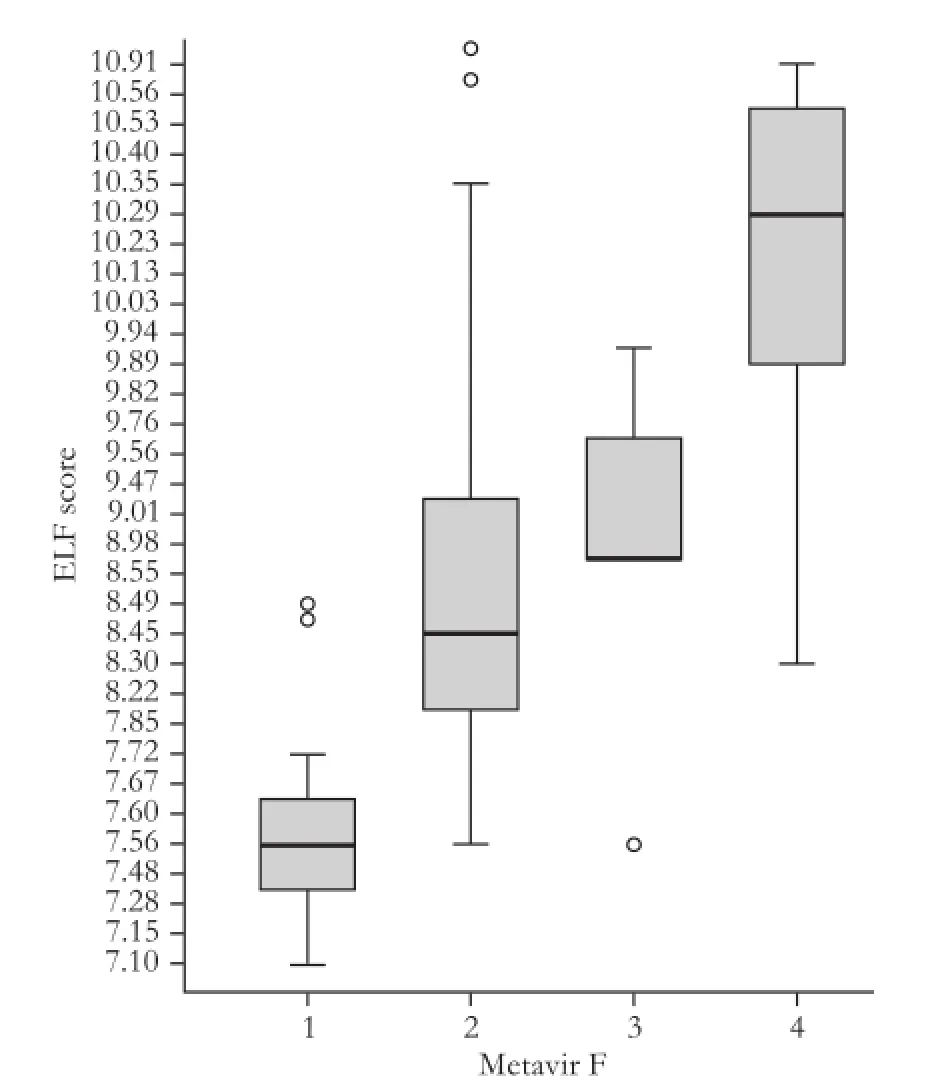
Fig. 1.ELF score in the different histological staging of Metavir. Boxes and horizontal lines within boxes represent interquartile ranges (IQRs) and median values, respectively. The upper and lower whiskers indicate 75th percentile plus 1.5 IQR and 25th percentile minus 1.5 IQR, respectively. o, mild outlier: a value more than 75th percentile plus 1.5 IQR, but less than 75th percentile plus 3.0 IQR. ELF: enhanced liver fi brosis.
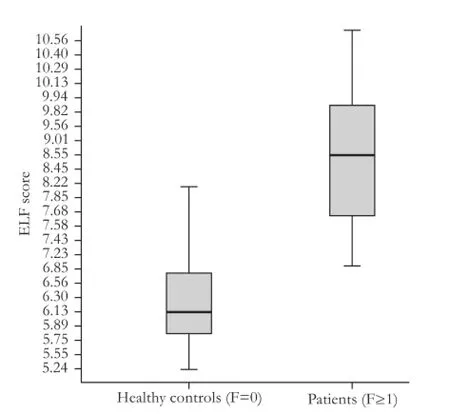
Fig. 2.ELF score concerning healthy controls compared to patients with liver fibrosis. Boxes and horizontal lines within boxes represent interquartile ranges (IQRs) and median values, respectively. The upper and lower whiskers indicate 75th percentile plus 1.5 IQR and 25th percentile minus 1.5 IQR, respectively. ELF: enhanced liver fi brosis.
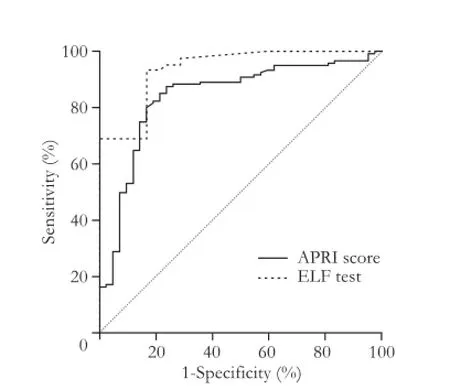
Fig. 3.Receiver operator characteristic (ROC) curves for ELF test and APRI in the diagnosis of signif i cant fi brosis (F≥2). APRI: AST-to-platelet ratio index; ELF: enhanced liver fi brosis.
Cirrhosis
The AUROC for the diagnosis of cirrhosis (Metavir F=4) was 0.94 (95% CI: 0.88-0.96), with an optimal ELF test cut-off value for the diagnosis of cirrhosis equal to 9.30 that may provide a sensitivity of 93.0%and a specif i city of 86.0% (Fig. 4). The sensitivity and specif i city of the ELF test in the diagnosis of cirrhosis are 79.1% and 90.8%, respectively (Table 3).
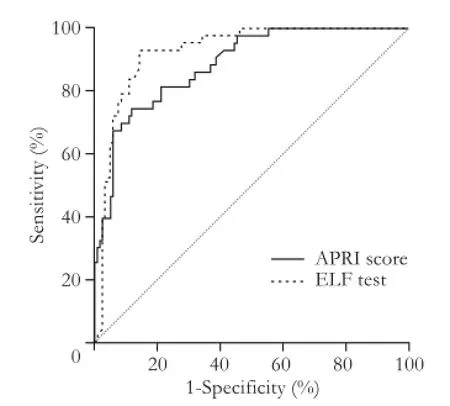
Fig. 4.Receiver operator characteristic (ROC) curves for ELF test and APRI in the diagnosis of cirrhosis (F=4). APRI: AST-toplatelet ratio index; ELF: enhanced liver fi brosis.

Table 3.Diagnostic values of ELF test for predicting fi brosis (Metavir F≥2) and cirrhosis (Metavir F=4)

Table 4.Diagnostic values of APRI score for predicting fibrosis (Metavir F≥2) and cirrhosis (Metavir F=4)

Table 5.Sensitivity analysis of observed and standardized AUROC of ELF test and APRI score for the diagnosis of advanced fi brosis, according to prevalence of fi brosis stages
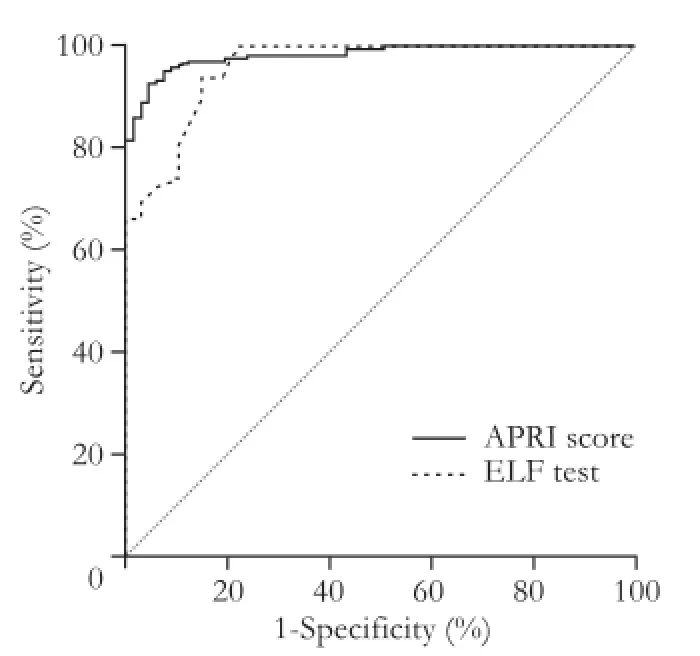
Fig. 5.Receiver operator characteristic (ROC) curves for ELF test and APRI score to distinguish healthy subjects (F=0) from patients with liver fibrosis (F≥1). APRI: AST-to-platelet ratio index; ELF: enhanced liver fi brosis.
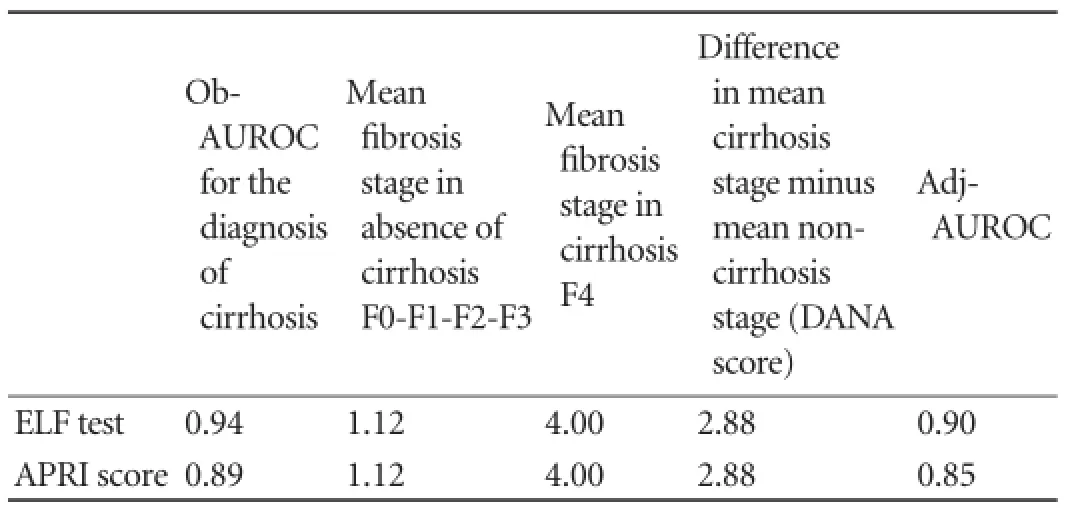
Table 6.Sensitivity analysis of observed and standardized AUROC of ELF test and APRI score for the diagnosis of cirrhosis according to prevalence of fi brosis stages
Furthermore, AUROC was calculated to distinguish the healthy controls from patients with liver fi brosis. It was 0.96 (95% CI: 0.92-0.98), with an optimal ELF test cut-off value for F≥1 equal to 7.35 that provides a sensitivity of 93.8% and a specif i city of 85.1% (Fig. 5).
The same statistical analysis was performed for the APRI score (Figs. 3-5) and the results are shown in Table 4. For this dignostic serologic test, in the diagnosis of signif i cant fi brosis in patients with chronic hepatitis C, a cut-off value ≥0.63 may provide a sensitivity of 87.5% and a specif i city of 76.2%, whereas in the diagnosis of cirrhosis a cut-off value ≥1.19 is related to a sensitivity of 74.4% and a specif i city of 87.4%, respectively. The AdjAUROCs for the ELF test and APRI score obtained by the DANA method are shown in Tables 5 and 6.
Discussion
To assess the diagnostic accuracy of the ELF test, we considered its correlation with liver fi brosis in subjects who underwent liver biopsy. The multivariable logistic regression model develops a predictive algorithm whose accuracy was examined by the analysis of the ROC curve. Binary analysis was performed by dividing patients into two groups based on their fi brosis stage. The degree of fi brosis was dichotomized into signif i cant fi brosis (no fi brosis/portal fi brosis without septa versus portal fi brosis with rare septa/many septa without cirrhosis/cirrhosis) and liver cirrhosis (present or absent). The validity of a biomarkers model should be verif i ed through the examination of accuracy in different groups, including those with concomitant diseases, with different age groups and with liver disease of different etiology. Lichtinghagen et al[26]have recently demonstrated the importance of variables such as age and gender. In our study we found a signif i cant difference (P<0.01) between men (9.16±1.19) and women (8.64±1.06). Moreover, liver disease progression in response to treatment and prognosis in terms of morbidity and mortality are both important parameters. The accuracy of diagnostic biomarkers as mentioned above has been reported in terms of AUROC with sensitivity, specif i city and predictive values calculated at specif i c cut-off points. Typically, a range of values at one end of the test result spectrum will produce a high sensitivity and a low specif i city, while a range of values at the opposite end of the spectrum will have a low sensitivity and a high specif i city. The intermediate results of the tests often determine moderate values of sensitivity and specif i city, which are not clinically signif i cant and, therefore, comprise an "indeterminate range". In our study the ELF test showed a number of results ranging between 7.10 and 11.03. For the diagnosis of signif i cant fi brosis in patients with chronic liver disease, a cut-off value ≥7.72 may provide a sensitivity of 93.0% and a specif i city of 83.0%. A cut-off value ≥9.30 for the diagnosis of cirrhosis may provide a sensitivity of 93.0% and a specif i city of 86.0%. For example, a comparison can be made with the APRI score, which typically provides a number of results ranging from 0.1 to 8.0. In the diagnosis of signif i cant fi brosis in patients with chronic hepatitis C, according to the literature, a cut-off value ≤0.5 provides a sensitivity of 81.0% and a specif i city of 50.0%, whereas a cut-off value ≥1.5 is related to a sensitivity of 35.0% and a specif i city 91.0% respectively.[27,28]Thus, most of the biomarkers will produce inconclusive results for patients who fall in the indeterminate range for a specif i c end-point of fi brosis. Parkes et al[28]examined the performance of 10 algorithms serum biomarkers and found that 65% of subjects had indeterminate results for the prediction of signif i cant fi brosis. However, the values in the indeterminate range for an end-point of fi brosis (for example, clinically signif i cant fi brosis) can still be useful for the diagnosis of fi brosis with other end-points (for example, cirrhosis). The values of APRI between 0.5 and 1.5, for example, are not useful in determining a signif i cant fi brosis, but those higher than 1.0 are related to a sensitivity of 89.0% and a specif i city of 75.0% in the diagnosis of HCV-related cirrhosis.[27]
The APRI score, in our cohort, showed similar results. The outcomes were slightly better than those reported in the literature.[27]In the diagnosis of signif i cant fi brosis in patients with chronic hepatitis C, a cut-off value ≥0 .63 may provide a sensitivity of 87.5% and a specif i city of 76.2%, whereas in the diagnosis of cirrhosis a cutoff value ≥1.19 is related to a sensitivity of 74.4% and a specif i city of 87.4%, respectively.
In our study, the ELF test in the diagnosis of signif i cant fi brosis (Metavir F≥2) showed a sensitivity of 93.3% and a specif i city of 81.0% (P<0.001). In the diagnosis of liver cirrhosis (Metavir F=4), instead, the test showed a sensitivity of 79.1%, but a specif i city of 90.8% (P<0.001). PPV and NPV represent a more useful interpretation of the test results performed on a small number of patients. Predictive values, sensitivity, and specif i city depend on the prevalence of the underlying disease. Thus, a test can be highly specif i c for the diagnosis of cirrhosis, but it is related to a low PPV if the underlying prevalence is very low (Table 7). For example, an APRI cut-point of 2.0 has a specif i city of 91.0% in the diagnosis of cirrhosis; however, if the prevalence of cirrhosis is only 15.0%, the PPV is 50.0%. Therefore, it is important to understand that the characteristics of the tests with biomarkers vary according to the setting. Selection bias may exist in studies which include patients who have undergone liver biopsy. In our study, the prevalence of signif i cant fi brosis and cirrhosis was 74.1% and 26.5%, respectively, which are higher than those (2.8% and 0.3%) in the general community.[27]Therefore, for a given biomarker, the PPV will be signif i cantly lower but the NPV signif i cantly higher in the general community than in a clinical trial (Table 7). In our study, the PPV and NPV in the diagnosis of signif i cant fi brosis were 93.3% and 81.0%, respectively. In the diagnosis of liver cirrhosis, the PPV and NPV were 75.6% and 92.3%, respectively.

Table 7.Predictive values of diagnostic biomarker with a sensitivity and specif i city of 90%, depends on the underlying prevalence of disease
Moreover, the AUROC varies because of the prevalence of fi brosis at different stages. This represents a spectrum bias that has important implications of non-invasive methods, when analyzing outcomes of a diagnostic method used in different populations. If extreme stages of fi brosis (F0 and F4) are overrepresented in a given population, the sensitivity and specif i city of a diagnostic test will be higher than in another population of patients with middle stages of fi brosis (F1 and F2). Several ways of preventing "spectrum bias" have been proposed including the AdjAUROC using the DANA method.
Clinically, an accurate determination of liver fi brosis is not as important as in other pathological scoring systems. For each diagnostic method for evaluating patients with signif i cant fi brosis, both sensitivity and specif i city of above 85% can be considered suff i cient since no relevant clinical consequences are found in case of false positives or false negatives.[29]The present study showed that the ELF test is a promising non-invasive method for assessing liver fi brosis in patients with chronic hepatitis C. The test has proven to be useful in determining the intermediate stages of fi brosis or the presence or absence of cirrhosis.
The ELF test was proved more reliable than the APRI score in the diagnosis of signif i cant fi brosis and cirrhosis. However, it was not effective in discriminating healthy volunteers from patients with liver fi brosis (Figs. 3-5).
The assessment of the liver fi brosis through the ELF test combined with other non-invasive diagnostic methods may provide high PPV or NPV, highlighting the stage of fi brosis with a high level of conf i dence. Thus a number of patients can avoid liver biopsy.
At present, liver biopsy is still considered as the essential method for the staging of fi brosis, and the ELF test might be one of the best non-invasive diagnostic methods in the selection of patients eligible for biopsy and in the follow-up of patients who already received antiviral therapy and/or dietary supplement.
Contributors:VD and AD proposed the study. MM wrote the fi rst draft, analyzed the data and contributed to the design and interpretation of the study. All authors participated in the data monitoring. MF coordinated the study. CR is the guarantor.
Funding:None.
Ethical approval:the study was approved by the local ethics committee according to theDeclaration of Helsinkiand Good Clinical Practice guidelines.
Competing interest:No benef i ts in any form have been received or will be received from a commercial party related directly or indirectly to the subject of this article.
1 Hatzakis A, Wait S, Bruix J, Buti M, Carballo M, Cavaleri M, et al. The state of hepatitis B and C in Europe: report from the hepatitis B and C summit conference. J Viral Hepat 2011;18:1-16.
2 Reiss G, Keeffe EB. Role of liver biopsy in the management of chronic liver disease: selective rather than routine. Rev Gastroenterol Disord 2005;5:195-205.
3 Crockett SD, Kaltenbach T, Keeffe EB. Do we still need a liver biopsy? Are the serum fi brosis tests ready for prime time? Clin Liver Dis 2006;10:513-534.
4 Dienstag JL. The role of liver biopsy in chronic hepatitis C. Hepatology 2002;36:S152-160.
5 Cadranel JF, Rufat P, Degos F. Practices of liver biopsy in France: results of a prospective nationwide survey. For the Group of Epidemiology of the French Association for the Study of the Liver (AFEF). Hepatology 2000;32:477-481.
6 Regev A, Berho M, Jeffers LJ, Milikowski C, Molina EG, Pyrsopoulos NT, et al. Sampling error and intraobserver variation in liver biopsy in patients with chronic HCV infection. Am J Gastroenterol 2002;97:2614-2618.
7 Sandrin L, Fourquet B, Hasquenoph JM, Yon S, Fournier C, Mal F, et al. Transient elastography: a new noninvasive method for assessment of hepatic fi brosis. Ultrasound Med Biol 2003;29:1705-1713.
8 Castéra L, Vergniol J, Foucher J, Le Bail B, Chanteloup E, Haaser M, et al. Prospective comparison of transient elastography, Fibrotest, APRI, and liver biopsy for the assessment of fi brosis in chronic hepatitis C. Gastroenterology 2005;128:343-350.
9 Friedrich-Rust M, Rosenberg W, Parkes J, Herrmann E, Zeuzem S, Sarrazin C. Comparison of ELF, FibroTest and FibroScan for the non-invasive assessment of liver fi brosis. BMC Gastroenterol 2010;10:103.
10 Stevenson M, Lloyd-Jones M, Morgan MY, Wong R. Noninvasive diagnostic assessment tools for the detection of liver fi brosis in patients with suspected alcohol-related liver disease: a systematic review and economic evaluation. Health Technol Assess 2012;16:1-174.
11 Guha IN, Parkes J, Roderick P, Chattopadhyay D, Cross R, Harris S, et al. Noninvasive markers of fi brosis in nonalcoholic fatty liver disease: Validating the European Liver Fibrosis Panel and exploring simple markers. Hepatology 2008;47:455-460.
12 Mayo MJ, Parkes J, Adams-Huet B, Combes B, Mills AS, Markin RS, et al. Prediction of clinical outcomes in primary biliary cirrhosis by serum enhanced liver fi brosis assay. Hepatology 2008;48:1549-1557.
13 Parkes J, Roderick P, Harris S, Day C, Mutimer D, Collier J, et al. Enhanced liver fi brosis test can predict clinical outcomes in patients with chronic liver disease. Gut 2010;59:1245-1251.
14 iQur Ltd. Enhanced Liver Fibrosis Test (ELFTM Test). 2006. Available from URL: http://www.iqur.com/Sampleprep.html.
15 National Institute for Health Research National Horizon Scanning Centre. Enhanced Liver Fibrosis Test (ELF) for evaluating liver fi brosis. Birmingham: National Horizon Scanning Centre 2008.
16 Rosenberg WM, Voelker M, Thiel R, Becka M, Burt A, Schuppan D, et al. Serum markers detect the presence of liver fi brosis: a cohort study. Gastroenterology 2004;127:1704-1713.
17 Castera L, Pinzani M. Biopsy and non-invasive methods for the diagnosis of liver fi brosis: does it take two to tango? Gut 2010;59:861-866.
18 Campbell S, Timms PM, Maxwell PR, Doherty EM, Rahman MZ, Lean ME, et al. Effect of alcohol withdrawal on liver transaminase levels and markers of liver fi brosis. J Gastroenterol Hepatol 2001;16:1254-1259.
19 Tsutsumi M, Urashima S, Takase S, Ueshima Y, Tsuchishima M, Shimanaka K, et al. Characteristics of serum hyaluronate concentrations in patients with alcoholic liver disease. Alcohol Clin Exp Res 1997;21:1716-1721.
20 Lieber CS, Weiss DG, Paronetto F, Veterans Affairs Cooperative Study 391 Group. Value of fi brosis markers for staging liver fi brosis in patients with precirrhotic alcoholic liver disease. Alcohol Clin Exp Res 2008;32:1031-1039.
21 Bedossa P, Poynard T. An algorithm for the grading of activity in chronic hepatitis C. The METAVIR Cooperative Study Group. Hepatology 1996;24:289-293.
22 Parkes J, Guha IN, Roderick P, Harris S, Cross R, Manos MM, et al. Enhanced Liver Fibrosis (ELF) test accurately identif i es liver fi brosis in patients with chronic hepatitis C. J Viral Hepat 2011;18:23-31.
23 Wai CT, Greenson JK, Fontana RJ, Kalbf l eisch JD, Marrero JA, Conjeevaram HS, et al. A simple noninvasive index can predict both signif i cant fi brosis and cirrhosis in patients with chronic hepatitis C. Hepatology 2003;38:518-526.
24 Poynard T, Halfon P, Castera L, Munteanu M, Imbert-Bismut F, Ratziu V, et al. Standardization of ROC curve areas for diagnostic evaluation of liver fi brosis markers based on prevalences of fi brosis stages. Clin Chem 2007;53:1615-1622.
25 Ishak K, Baptista A, Bianchi L, Callea F, De Groote J, Gudat F, et al. Histological grading and staging of chronic hepatitis. J Hepatol 1995;22:696-699.
26 Lichtinghagen R, Pietsch D, Bantel H, Manns MP, Brand K, Bahr MJ. The Enhanced Liver Fibrosis (ELF) score: Normal values, inf l uence factors and proposed cut-off values. J Hepatol 2013;59:236-242.
27 Shaheen AA, Myers RP. Diagnostic accuracy of the aspartate aminotransferase-to-platelet ratio index for the prediction of hepatitis C-related fi brosis: a systematic review. Hepatology 2007;46:912-921.
28 Parkes J, Guha IN, Roderick P, Rosenberg W. Performance of serum marker panels for liver fi brosis in chronic hepatitis C. J Hepatol 2006;44:462-474.
29 Martínez SM, Crespo G, Navasa M, Forns X. Noninvasive assessment of liver fi brosis. Hepatology 2011;53:325-335.
Received April 20, 2013
Accepted after revision June 5, 2013
AuthorAff i liations:Department of Medical and Pediatric Sciences, Institute of Internal Medicine "A. Francaviglia", Section of Gastroenterology, University of Catania, "G. Rodolico" Hospital, Via S. Sof i a, 78-95123-Catania, Italy (Catanzaro R, Milazzo M, Arona S and Sapienza C); Laboratory analysis "MedLab-Analisi Cliniche", Catania, Italy (Vasta D); Specialist in diabetes and metabolic diseases, Catania, Italy (Arcoria D); and ReGenera Research Group for Aging Intervention, Milano, Italy (Marotta F)
Professor Roberto Catanzaro, Department of Medical and Pediatric Sciences, Institute of Internal Medicine "A. Francaviglia", Section of Gastroenterology, University of Catania, "G. Rodolico" Hospital, Pad. 4, I Piano, Stanza 17, Via S. Sof i a, 78-95123-Catania, Italy (Tel: 39-95-3782902; Fax: 39-95-3782376; Email: rcatanza@ unict.it)
© 2013, Hepatobiliary Pancreat Dis Int. All rights reserved.
10.1016/S1499-3872(13)60079-X
杂志排行
Hepatobiliary & Pancreatic Diseases International的其它文章
- Simultaneous recovery of dual pathways for ammonia metabolism do not improve further detoxif i cation of ammonia in HepG2 cells
- Optimal central venous pressure during partial hepatectomy for hepatocellular carcinoma
- Risk factors and clinical characteristics of portal vein thrombosis after splenectomy in patients with liver cirrhosis
- Fine needle aspirating and cutting is superior to Tru-cut core needle in liver biopsy
- Mattress sutures for the modif i cation of end-toend dunking pancreaticojejunostomy
- Retrohepatic vena cava deroof i ng in living donor liver transplantation for caudate hepatocellular carcinoma
