Glutamine synthetase as an early marker for hepatocellular carcinoma based on proteomic analysis of resected small hepatocellular carcinomas
2010-07-05
Beijing, China
Glutamine synthetase as an early marker for hepatocellular carcinoma based on proteomic analysis of resected small hepatocellular carcinomas
Jiang Long, Zhen-Wei Lang, Hua-Guang Wang, Tai-Ling Wang, Bao-En Wang and Si-Qi Liu
Beijing, China
BACKGROUND: Hepatocellular carcinoma (HCC) is a highly malignant tumor with a poor prognosis. Because small HCCs possess most of the characteristics of early HCC, we investigated small HCCs to screen potential biomarkers for early diagnosis.
METHODS: Proteins were extracted from 10 sets of paired tissue samples from HBV-infected small-HCC patients. The extracted proteins were well resolved by two-dimensional electrophoresis. These HCC-associated proteins were then identified by MALDI-TOF/TOF MS following image analysis. Western blotting and immunohistochemistry were used to assess glutamine synthetase (GS) and phenazine biosynthesislike domain-containing protein (PBLD) expression in liver tissue. Enzyme-linked immunosorbent assays in 152 serum samples (from 49 healthy donors, 24 patients with liver cirrhosis, and 79 with HCC) were used to further assess the significance of GS clinically.
RESULTS: Fifteen up-regulated and three down-regulated proteins were identified. Western blotting confirmed GS overexpression and decreased PBLD expression in liver tissue. Immunohistochemistry showed that GS was expressed in 70.0% (84/120) of HCCs and 35.8% (43/120) of nontumor tissues; PBLD was expressed in 74.2% (89/120) of nontumor tissues and 40.8% (49/120) of HCCs. The Chi-square test showed significant expression differences between HCCs and adjacent tissues. Consistent with this, serum GS levels in HCC patients were significantly higher than those in liver cirrhosis patients and healthy donors, while the latter two groups were also significantly different. In addition, a diagnostic cutoff value of 2.6 mg/ml was used for GS; it was elevated in 19 (76.0%) of 25 HCC patients with AFP ≤20 ng/ml and 47 (88.7%) of 53 HCC patients with AFP ≤200 ng/ml.
CONCLUSION: GS and PBLD are abnormally expressed in most HCCs. GS may be a novel serum marker for early HCC, especially for those patients with low AFP levels (≤200 ng/ml).
(Hepatobiliary Pancreat Dis Int 2010; 9: 296-305)
glutamine synthetase; phenazine biosynthesis-like domain-containing protein; proteomics
Introduction
Hepatocellular carcinoma (HCC) is one of the leading causes of cancer deaths in Asia. Owing to the prevalence of chronic HBV infection, HCC in China has been the second most fatal cancer since the 1990s.[1]HBV infects more than 350 million people worldwide.[2]At present, only a few biomarkers are available for the diagnosis and monitoring of HCC. By its sensitivity, specificity, and operability, alphafetoprotein (AFP) cannot fulfill the requirements of an ideal tumor marker, although it remains the best one clinically available for HCC.[3]During early HCC, asymptomatic patients with negative serum markers (AFP and PIVKA-Ⅱ) are usually not diagnosed until the advanced stages. Early diagnosis of HCC can greatly improve the outcome, with better long-term survival and reduced recurrence risk for operative treatment. The only potentially curative therapies depend on detection and resection of small HCCs.[4]Because the purely morphological concept of small HCC (diameter≤3 cm) encompasses early HCC, small HCCs possess most of the characteristics of early HCCs. Therefore, selecting small single-nodule HCCs might be suitablefor studies on the diagnosis of, or therapy for, early HCC. These results indicate the information about potential markers for HBV-related small HCC diagnosis and/or prognosis and the clues for elucidation of the mechanism of HCC carcinogenesis.
Methods
Liver tissue specimens, serum specimens, and sample preparation
To minimze individual variability, we selected 10 HCC patients with similar pathological characteristics. These patients were in Edmondson grades Ⅱ-Ⅲ and their average age was 52.4 years (range 38-64). They were HBV-infected, as most clinical HCC patients. Tumors in all patients were ≤3 cm in diameter, representing small HCCs.
HCC tissues and adjacent paired nontumorous tissues (5 cm away from the edge of the HCC lesion) for twodimensional electrophoresis (2-DE) were isolated from 10 HBV-associated small-HCC patients who underwent liver transplantation at Beijing Youan Hospital or Beijing Chaoyang Hospital Affiliated to Capital Medical University. No patients received anti-tumor therapy prior to surgery. The samples were washed thoroughly three times with ice-cold phosphate buffered saline (PBS) and then snap-frozen in liquid nitrogen. The diagnosis of HCC was routinely conducted by senior pathologists based on hematoxylin and eosin staining and the Edmondson-Steiner classification. The collection of these samples complied with the Ethics Committee guidelines of the University. Data on the 10 patients are summarized in Table 1. For the immunohistochemistry staining study, 120 pairs of liver tissues were collected from both Beijing Youan Hospital and Chaoyang Hospital. Routine formalin fixation and paraffin embedding were used to process these tissue samples for immunohistochemistry.
Protein extraction and 2-DE analysis were performed as previously described with minor modifications.[5]For each sample, 50 mg of tissue was ground into powder in a metal mortar immersed in liquid nitrogen, then precipitated with 10% TCA/acetone for 2 hours. The precipitate was washed with pre-cooled acetone, which was removed by vacuum evaporation. Samples were then homogenized on ice in lysis buffer containing 20 mmol/L Tris-HCl, pH 7.5, 8 mol/L urea, 4% 3-[(3-cholamidopropyl) dimethylammonio]-1-propanesulfonate, 0.5% pharmalyte (pH 3-10), 10 mmol/L dithiothreitol (DTT), 1 mmol/L phenylmethylsulfonyl fluoride, and 2 mmol/L ethylenediamine tetraacetic acid (EDTA). After sonication for 5 minutes in an ultrasonic processor, the lysate was centrifuged at 40 000 g for 30 minutes. After determining protein concentrations by the Bradford method, the supernatant was stored at -80 ℃until use.
Blood samples were obtained from 79 patients with HCC (Table 2): 24 patients with liver cirrhosis (Beijing Youan Hospital), 20 with Child-Pugh class A and four with Child-Pugh class B (Beijing Friendship Hospital), and 49 healthy blood donors (Beijing Friendship Hospital). Signed consent was given by all participants. The serum was immediately separated by centrifugation and frozen at -80 ℃. Only sera from patients who were diagnosed with nonmalignant liver disease (cirrhosis) at the time of serum collection and had no sign of malignant disease 6 months later were included in this study.
2-DE and image analysis
Total protein (150 μg) was applied to an IPG strip(pH 3-10, 18 cm; Amersham Biosciences, Sweden) and subjected to isoelectric focusing in IPGphor (Amersham). Briefly, after rehydration for 4 hours at 0 V and 8 hours at 50 V, isoelectric focusing was carried out with gradient voltages at 500, 1000, and 8000 V each for 1 hour, then finally kept at 8000 V until the Vh value reached 56 000. The gel strips were equilibrated in equilibration buffer (6 mol/L urea, 50 mmol/L Tris-HCl, pH 8.8, 30% glycerol, 2% SDS, and trace bromophenol blue); 1% DTT was added to the first buffer and 2.5% iodoacetamide (IAM) was added to the second buffer for alkylation. A 12% SDS-PAGE gel (1 mm thick) was run in an Ettan DALT ⅡSystem (Amersham) for the secondary electrophoresis. The gels were visualized with silver staining.
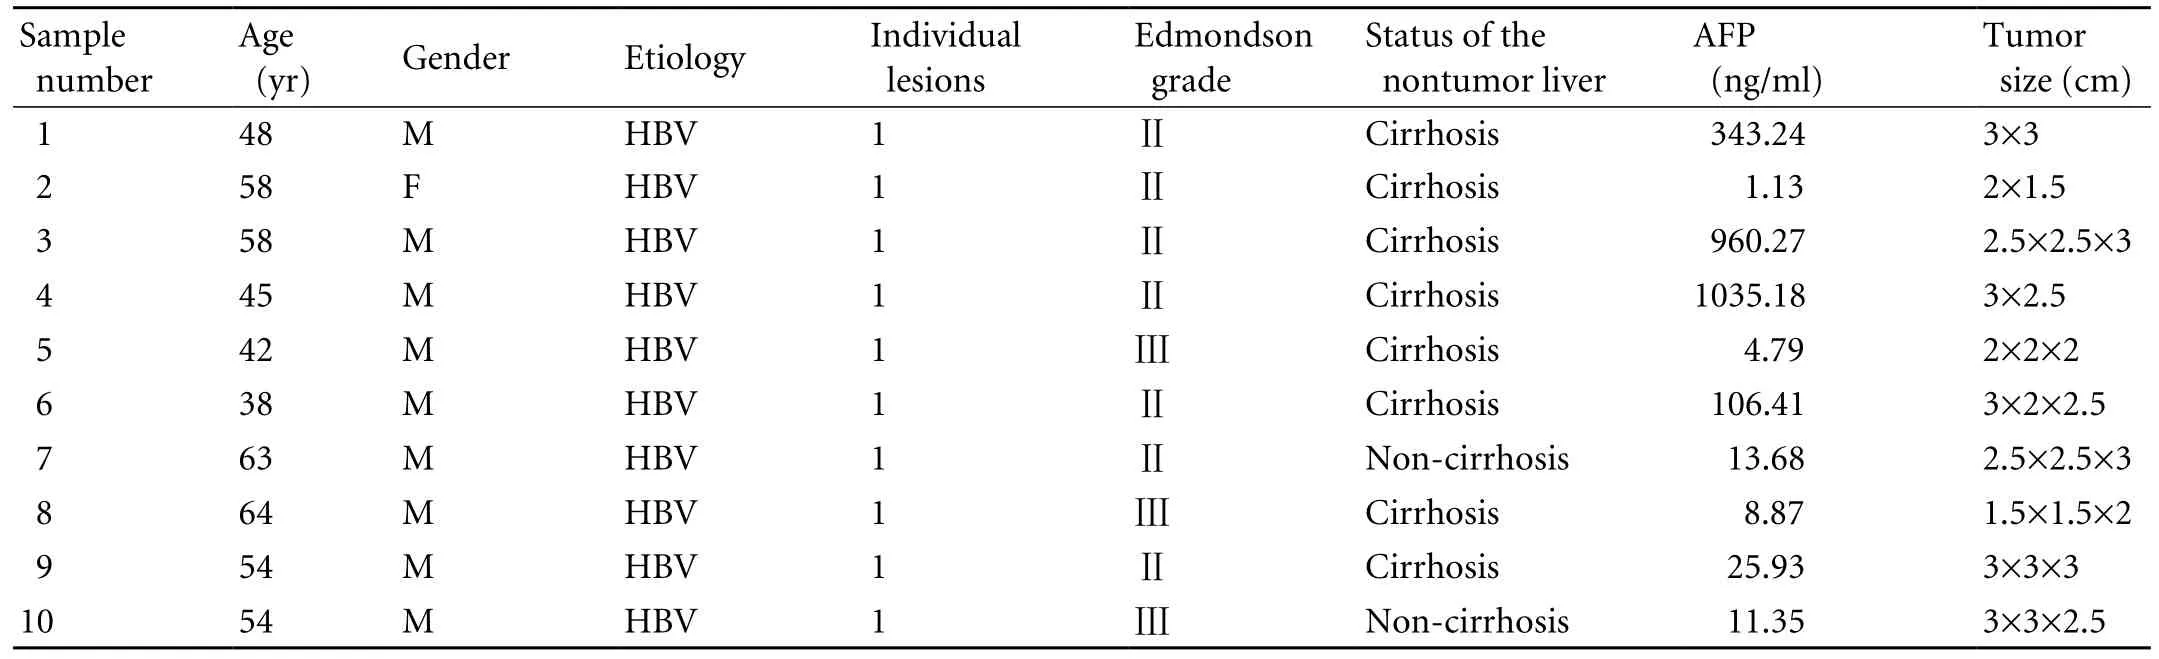
Table 1. The clinical and pathologic data of HCC patients
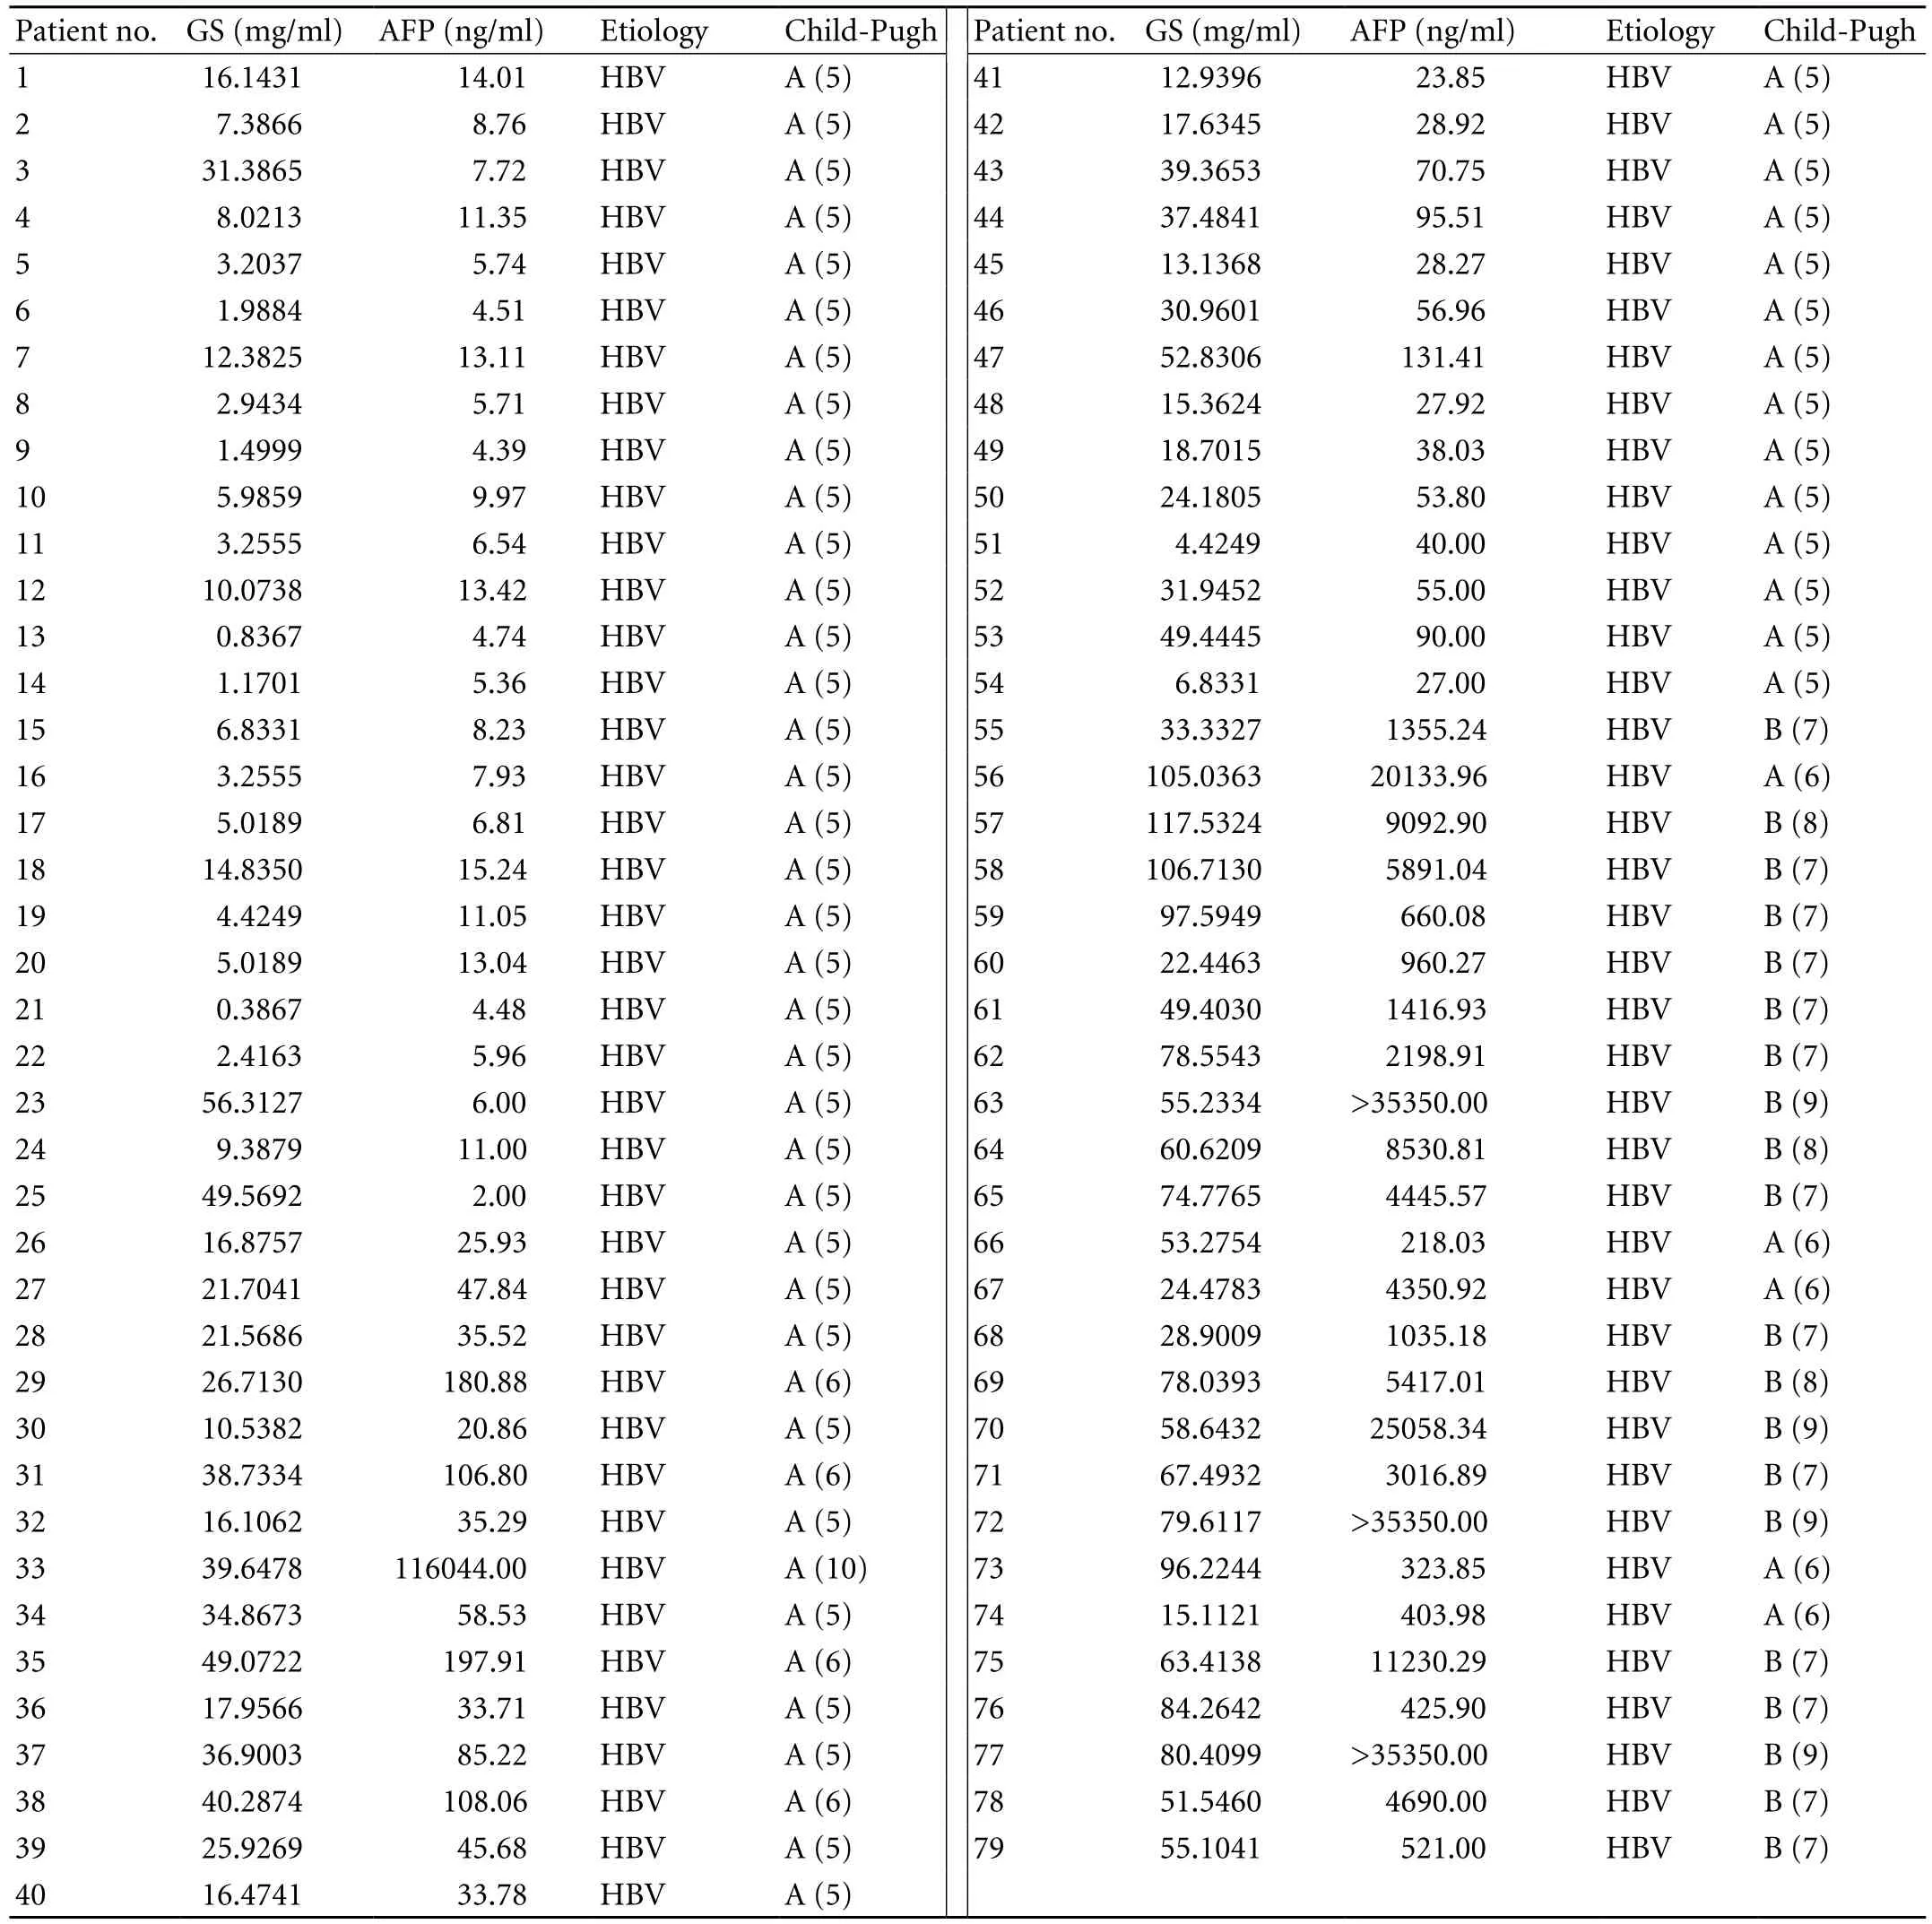
Table 2. Serum concentration of GS and AFP in patients with HCC
The silver-stained 2-DE gels were scanned by Imagescanner (Amersham) at 300 dpi. Relative spot volumes were estimated with ImageMaster 2-D Platinum, version 3.0 (Amersham).
The samples from the 10 patients were evenly and randomly separated into two groups. Equal amounts of protein from each sample, both the HCCs and their adjacent tissues, were evenly mixed and run on 2-DE gels for each group. On the 2-DE gels, those spots which appeared on parallel gels of the "mixed pools" were selected for image analysis. After identifying the spots with significant changes in relative spot volume (>3-fold), the differential spots found in the "mixed pools" of the two patient groups were further overlapped to identify the ones with high incidence rates. The normalized volume of these proteins was quantified as percent volume (%v), where (%v)=(spot volume/spot volume of all spots resolved in the gel). Spots with similar 2-DE positions in different gels, and those with ≥3-fold differences in relative spot volumes were defined as differential spots.
Protein identification by mass spectrometry
Protein spots were excised and placed in 96-well plates. The gel particles were reduced with 10 mmol/L DTT, alkylated with 55 mmol/L IAM, and subjected to in-gel digestion with 0.01 μg trypsin (Sigma) at 37 ℃overnight. Trifluoroacetic acid (0.1%) was used to stop the reaction. Peptide solutions were spotted onto Anchorchip (Bruker, Germany) and co-crystallized with cyano-4-hydroxycinnamic acid (4 mg/ml). The mass spectra of peptides were acquired with an Ultraflex MALDI-TOF/TOF MS (Bruker). A commercial peptide mixture was used to calibrate the accuracy and resolution of the mass spectrometry. Peptide mass fingerprinting searching was performed with the MASCOT engine (Matrix Science, UK) against NCBI's nonredundant human genome database (NCBInr). The protein identification criteria for this work were based on a probability-based MOWSE scoring algorithm with 95% confidence level in MASCOT. To more accurately identify the proteins, we set two conditions: a) identifying >20% of the total peptides of the full length of the protein; and b) identifying at least the first five peptides of the protein.
Western blotting
Proteins from the 10 paired tumor and nontumor tissues were separated on 12% SDS-PAGE and transferred to NC membranes (Amersham). The electro-blotted membranes were soaked in Tris-buffered saline (20 mmol/L Tris-Cl, 140 mmol/L NaCl, pH 7.5) containing 5% skimmed milk and 0.1% Tween 20 for 2 hours at room temperature. Primary antibodies used were glutamine synthetase (1∶2500, Abcam), and PBLD (1∶1000, Beijing Institute of Genomics, Chinese Academy of Sciences). Blots were incubated with primary antibodies overnight at 4 ℃. Anti-β-actin antibody (1∶4000, Sigma) was used as a reference to normalize the intensities of immunoreactions with different antibodies. The antibody against rabbit-IgG and mouse-IgG conjugated with horseradish peroxidase (1∶5000, Zhongshan Golden Bridge Biotechnology, China) was used as the secondary antibody. Signals were developed with a SuperSignal WestPico Trial kit (an enhanced chemiluminescent substrate for detection of HRP; Thermo Scientific, USA) according to the manufacturer's instructions.
Immunocytochemical staining
Paired HCC tumor and nontumor liver tissues from each patient were fixed in formalin and embedded in paraffin. One hundred and twenty HCC samples (84 male; 36 female; age 54±10 years) were used for GS and PBLD immunohistochemical staining, including 10 samples analyzed by 2-DE.
Paraffin sections (5 μm) were deparaffined with xylene and rehydrated in a graded alcohol series. Antigen retrieval was performed in 1 mmol/L EDTA solution, pH 8.0 (Zhongshan Golden Bridge Biotechnology, China) in a microwave oven. The activity of endogenous peroxidase was blocked by incubation in 3% H2O2at room temperature for 10 minutes. After thorough washing with PBS, the slides were incubated with the primary antibody, polyclonal GS (1∶400, Abcam) and anti-PBLD (1∶100, Beijing Institute of Genomics) at 37 ℃ for 2 hours in a moist chamber. After thorough washing with PBS, the slides were incubated with the polymer Helper or poly-HRP anti-Rabbit IgG (Zhongshan Golden Bridge) for 20 minutes at 37 ℃. Brown signals were visualized with a 3, 3'-diaminobenzidine tetrahydrochloride substrate kit (DAB kit; Zhongshan Golden Bridge). After counterstaining with hematoxylin, the slides were dehydrated and mounted for viewing under a microscope.
Enzyme-linked immunosorbent assay
GS levels in parallel serum samples were determined using a commercially available ELISA kit (Groundwork Biotechnology Diagnosticate, Canada). AFP levels in parallel serum samples were determined using a commercially available ELISA kit (CanAg, Sweden).
Statistical analysis
The data were evaluated statistically using SPSS version 13.0 (SPSS Inc, Chicago, IL, USA). The Chisquare test was used to define significant differences among the pathological samples, and the Mann-WhitneyUtest was used to determine significant differencesbetween the groups for GS in sera. A diagnostic cutoff value for GS was set two standard deviations above the mean of healthy controls. The cutoff value considered positive for AFP was 20 ng/ml, as described previously.[6]P≤0.05 was set as the significance threshold.
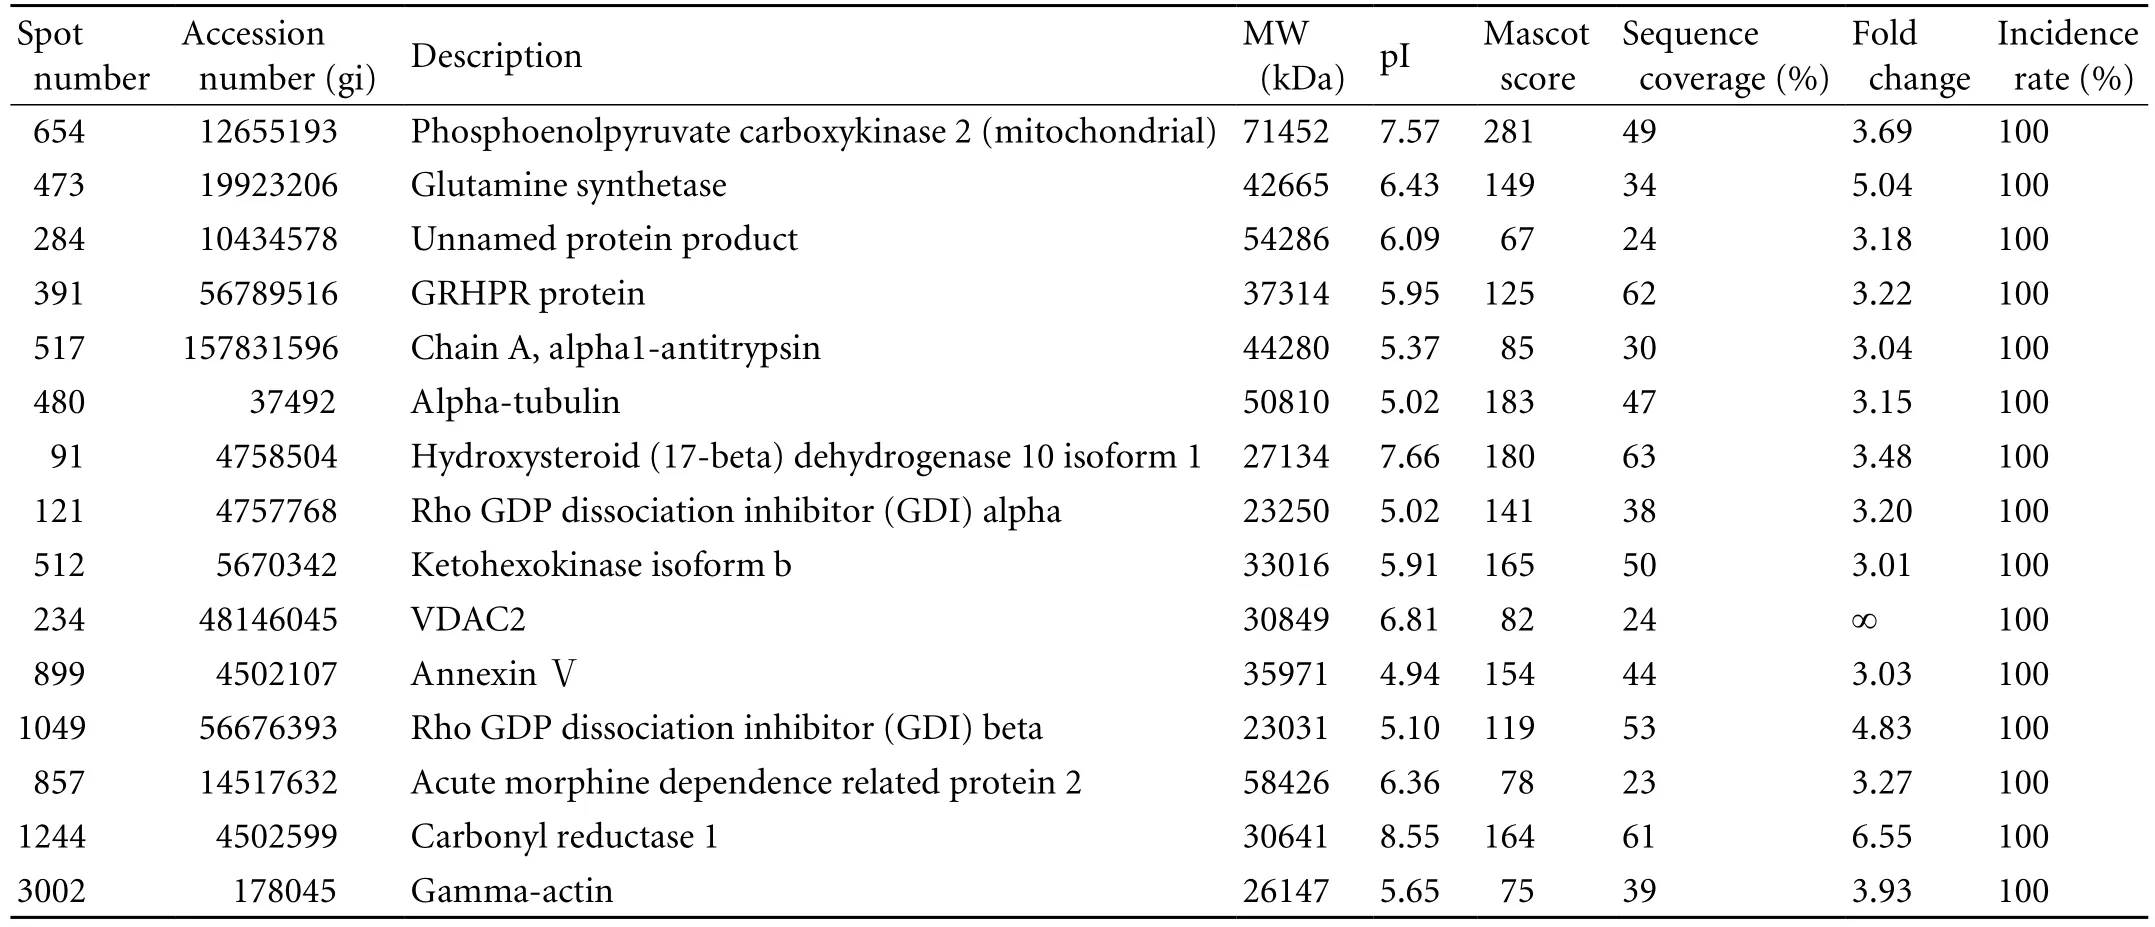
Table 3. The up-regulated proteins identified in the HCC tissues
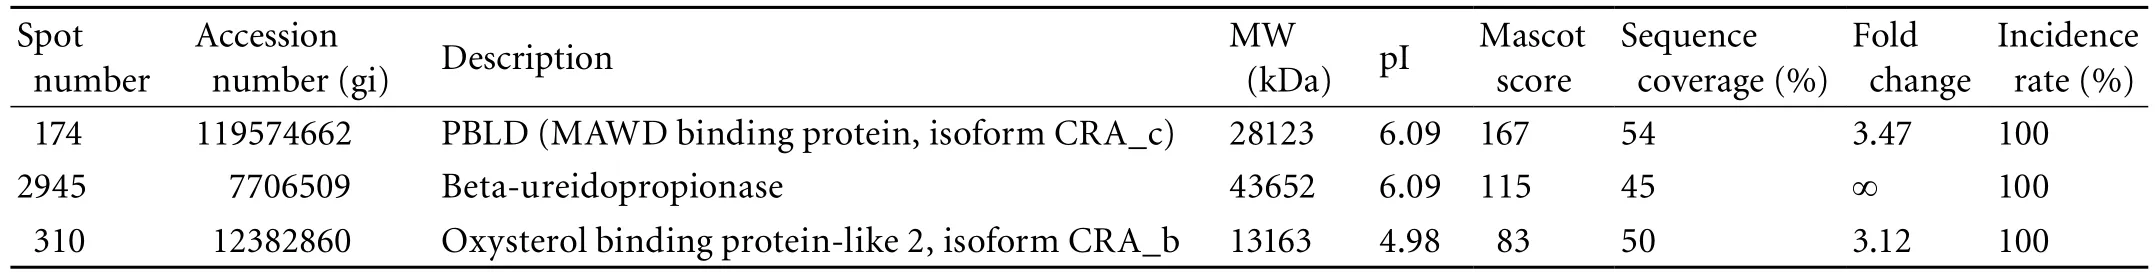
Table 4. The down-regulated proteins identified in the HCC tissues
Results
Analysis of differentially expressed proteins
After processing the 2-DE gels of the HCC tissues and their paired non-tumorous tissues, we obtained well-resolved gels, with the stained spots both sharply focused and widely distributed along pH 3-10 (Fig. 1A). Using Image-2D analysis software, about 950 spots per gel were detected; their numbers were automatically determined. Using the procedures described above, we found 42 spots from HCC and 47 from non-tumorous tissues. After carefully overlapping these spots, we found 23 differential 2-DE spots in the tumor tissues: 18 upregulated and five down-regulated.
Identification of proteins by MALDI-TOF/TOF MS
Among the 23 differential spots, 18 (corresponding to 18 different gene products, 15 up-regulated and three down-regulated) were identified in the tumor tissues (Tables 3 and 4). Spots 473 (GS) and 174 (PBLD) were expressed in six paired gels of HCC samples (Fig. 1B). Among the 15 significantly up-regulated spots in the tumor group, three were oxidoreductases: GRHPR protein, carbonyl reductase-1, and hydroxysteroid (17-beta) dehydrogenase 10 isoform-1. Other proteins were associated with amino acid metabolism, glucose metabolism, apoptosis, cytoskeleton and cell mobility, regulation of signal transduction, immune function, lipoid metabolism and molecular chaperones, and were located in the cytoplasm (66%), mitochondria (11%), secreted protein (6%) and the mitochondrial outer membrane (6%). Some previously reported HCC-associated proteins, such as GS,[7]chain A, alpha 1-antitrypsin,[7]annexin Ⅴ, rho-GDP dissociation inhibitor-beta, and PBLD[7-9]were also found in our study, and they are consistent with our proteomic results.
Validation of proteins by Western blotting
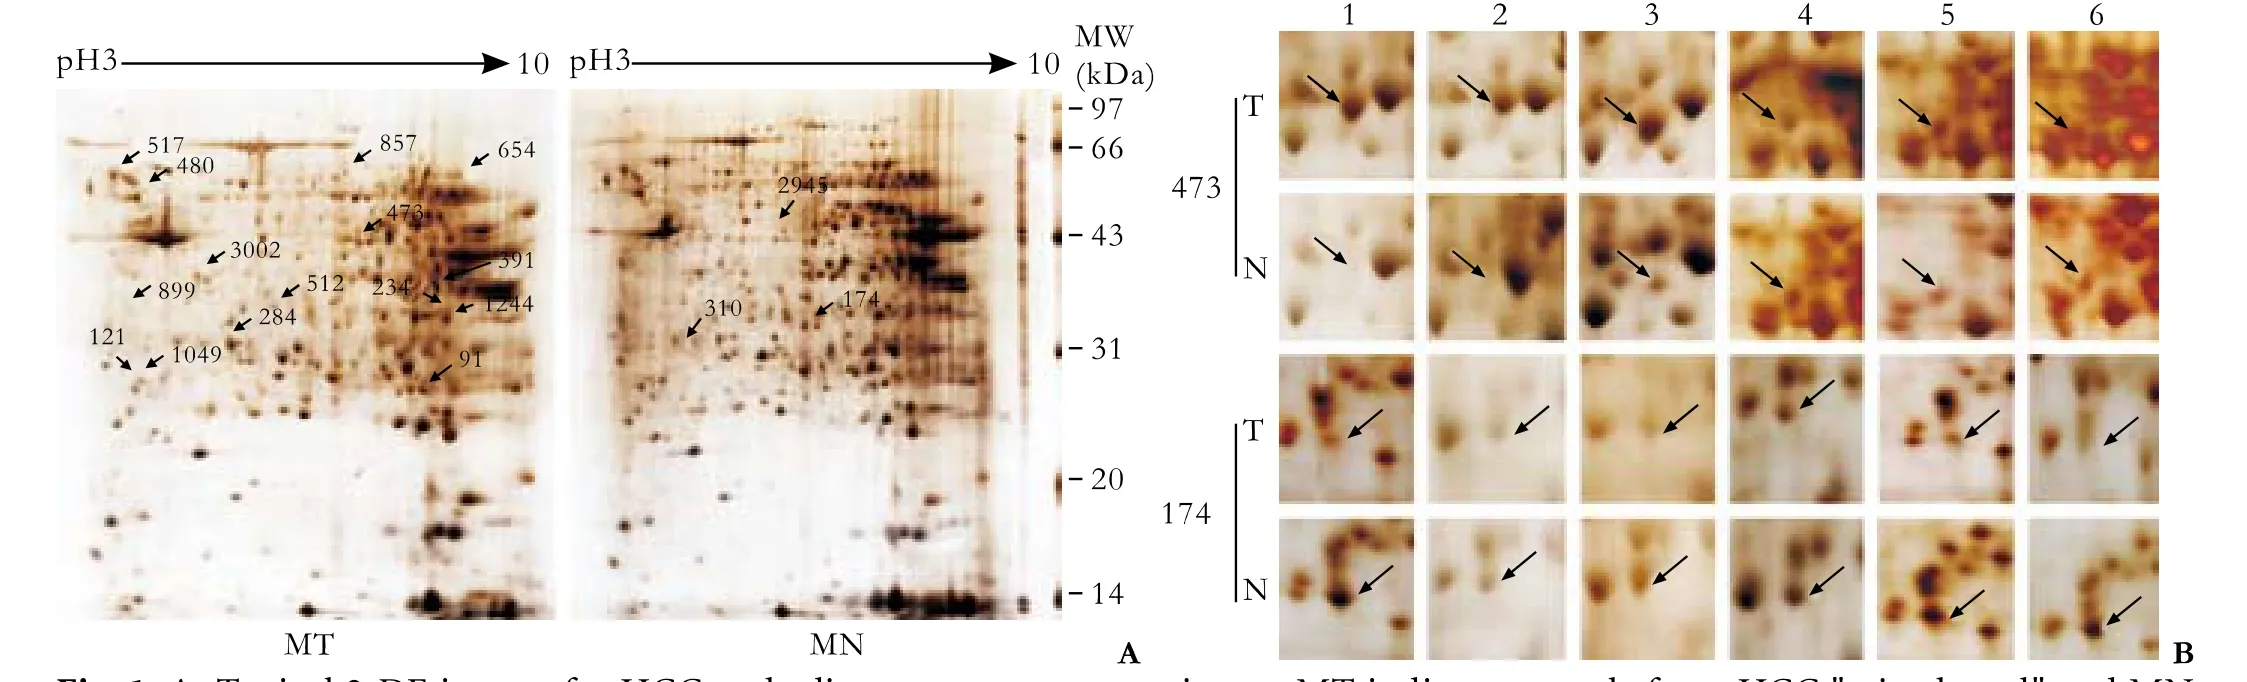
Fig. 1. A: Typical 2-DE images for HCC and adjacent noncancerous tissues. MT indicates sample from HCC "mixed pool" and MN indicates sample from adjacent noncancerous tissues. Differential spots are labeled with arrows. B: Expression of spots 473 (GS) and 174 (PBLD) in six paired gels (mixed pool) of HCC samples.
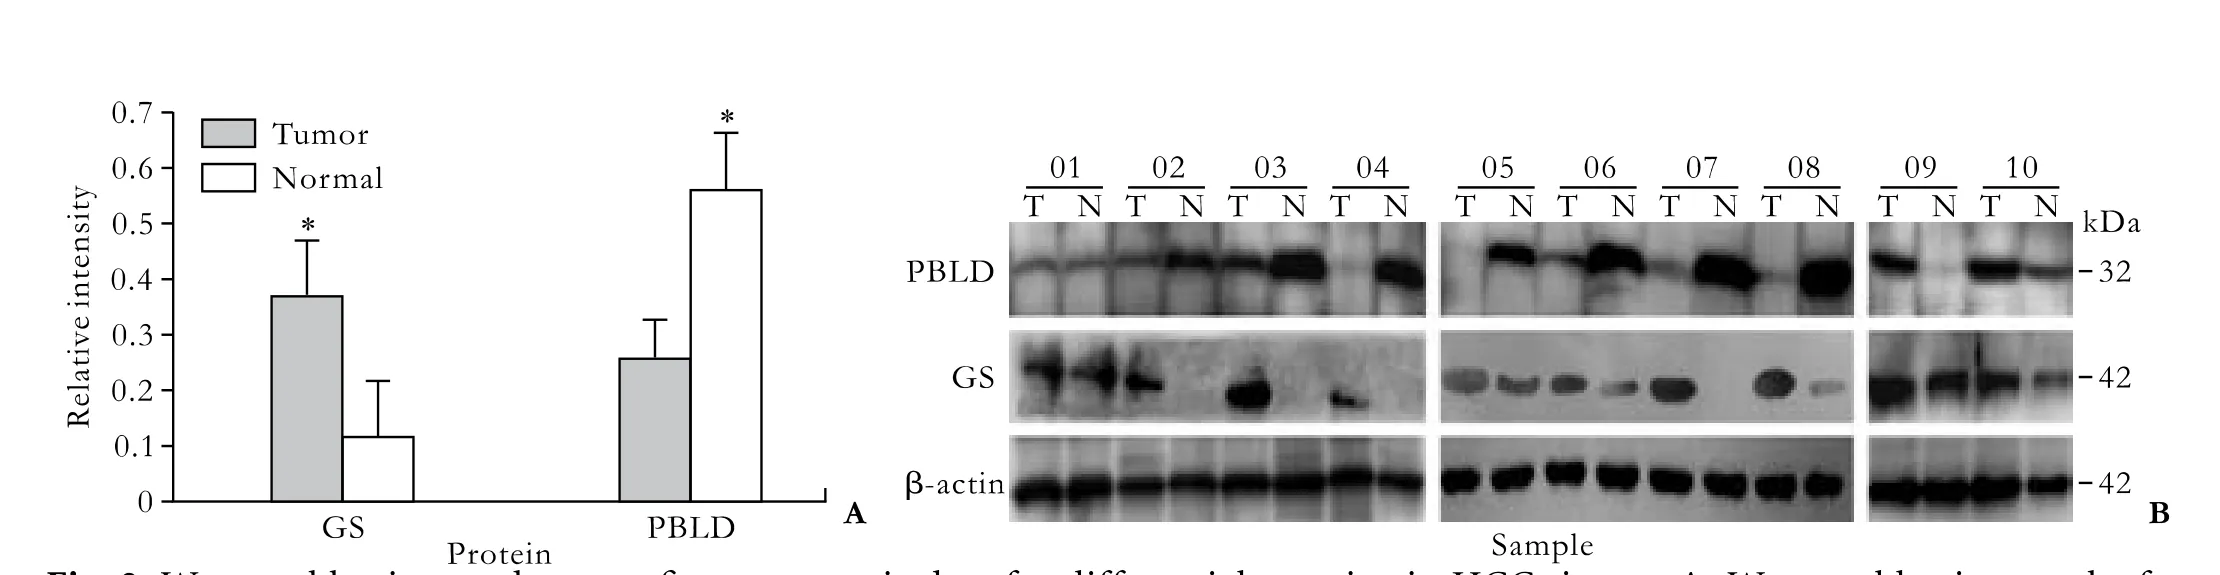
Fig. 2. Western blotting made to confirm proteomic data for differential proteins in HCC tissues. A: Western blotting results for 10 paired samples; two proteins, GS and PBLD, were used as potential markers for HCC; failure of detection in some samples may be due to very low abundance. β-actin was used as reference protein. (*:P<0.01). B: Comparison of relative levels of GS and PBLD proteins in 10 paired samples using Western blotting. In all experiments, β-actin was used as reference for normalization in quantitative estimations.
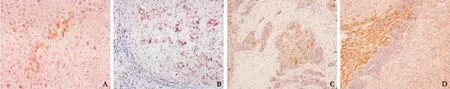
Fig. 3. Immunohistochemistry for GS (A-C) and PBLD (D). A: Normal tissue showing strong GS immunoreactivity of pericentral hepatocytes (original magnification ×200). B: Strong, diffuse cytoplasmic GS immunoreactivity in cirrhosis tissue (original magnification ×200). C: HCC showing cytoplasmic GS immunoreactivity of tumor cells (original magnification ×200). D: HCC showing faint staining for PBLD as opposed to the strong staining of adjacent control tissue (original magnification ×100).
To confirm the identification results, we selected several identified proteins which were previously reported to be tumor-related and were detectable in the serum. Fig. 2 shows immunostaining intensity changes for two proteins in the paired tissues. From semiquantitative estimation, GS was up-regulated 3.2-fold, and PBLD was down-regulated 2.2-fold in HCC tissues compared with adjacent tissues. The data verified the proteomic results from 2-DE analysis.
Immunocytochemical staining
Samples were semi-quantitatively evaluated andsemi-quantitatively scored according to the number of immunoreactive (IR) cells. Individual samples were considered IR for individual antigens when more than 5% of cells were IR. Positive signals for both proteins were in the cytoplasm. Immunoreactive tissues were further subclassified as follows: +, 5%-10% IR cells (low expressor); ++, 11%-50% IR cells (intermediate expressor); and +++, ≥50% IR cells (high expressor). We also evaluated the staining intensity of GS as faint, moderate, or strong, the latter being detectable in control pericentral and periseptal hepatocytes.[10]
The positive staining rate for GS was 70.0% (84/120) in tumor tissues and 35.8% (43/120) in nontumor tissues. Furthermore, it is noteworthy that most nontumor tissues appearing IR for GS were cirrhotic, with inflammation, necrosis, and regeneration. PBLD was expressed in 74.2% (89/120) of tumor tissues and in 40.8% (49/120) of nontumor tissues; the sensitivity was 70.0% for GS and 74.2% for PBLD, and the specificity was 64.2% and 59.2%, respectively. These data showed significant differences in GS and PBLD expression between HCC tissues and their adjacent counterparts (P=0.001 for both); both proteins were stained in the cytoplasm or/and membrane of hepatocytes (Fig. 3).
Serum levels of GS
We investigated whether GS is detectable in the sera of HCC patients. Serum GS levels were measured in 49 healthy individuals, 24 liver cirrhosis patients, and 79 HCC patients. Statistical analysis using the Mann-WhitneyUtest showed that the distribution of serologic levels of GS in HCC patients was significantly higher than in those with cirrhosis or healthy donors, and the latter two groups were significantly different.
We also measured serum AFP levels in the sample set. The values were normal in healthy donors, but elevated in two of 24 patients with cirrhosis (37.3 and 62.5 ng/ml). AFP was also elevated in 54 of the 79 HCC patients (68.4%) using a cutoff value of 20 ng/ml (Table 2). Moreover, if a cutoff of 200 ng/ml (which is considered highly specific for HCC) was used, AFP was increased in 25 of the 79 HCC samples (31.6%). In the HCC group, elevated GS values were correlated with elevated AFP values (after taking the natural logarithm, Pearson's product-moment correlation coefficient for GS and AFP values,r=0.728,P=0.000; regression Y (ln GS)=1.408+0.33×(ln AFP),P=0.000). In addition, GS was elevated in 19 out of 25 (76.0%) HCC patients with AFP ≤20 ng/ml using a cutoff of 2.6 mg/ml. On the other hand, if a cutoff value of 200 ng/ml was used for AFP, GS was elevated in 47 of 53 HCC patients (88.7%). Thus, the simultaneous use of the two markers significantly increased the sensitivity of diagnosis, especially for patients with low AFP levels (≤200 ng/ml).
Discussion
Because disease-related proteins are more concentrated in tissues than in body fluids, much attention has been paid to the comparisons of tissues among populations suffering from HCC at different stages.[11]Studies using tissue proteomics could help to uncover carcinogenetic mechanisms and find potential biomarkers.
Previous studies demonstrated that most proteomic data from HCC tissues overlap poorly with other reports.[12]This is partly because tumorigenesis in humans is a multistep process and these steps reflect genetic alterations that drive the progressive transformation of normal cells into malignant derivatives. Moreover, proteomic measurements can only provide an average of protein levels in a tissue instead of distinguishing variations in protein expression in different tissue regions.
In order to acquire accurate data and to reduce misinterpretation, a corresponding strategy was adopted in our study. First, we strictly selected the clinical samples, which were all small HCCs with similar pathologic characteristics. Second, our experimental design called for the 10 pairs of HCC tissues to be divided into two groups, which were used for separating proteins by 2-DE; the differential spots from these two groups were then overlapped to reduce the number of candidates. Third, Western blotting and immunohistochemistry were used to specifically localize (and thus validate) the HCC-associated proteins in tissues. Finally, ELISA was used to determine serum GS and AFP concentrations and study their relationship in order to assess them as potential serum markers for HCC. In view of individual differences and the possibility of experimental error, we expanded the clinical sample size to confirm the proteomic conclusions to 120 HCC tissue samples and 152 serum samples.
In our results, 66% of the proteins were located in the cytoplasm, where they might be released into blood and become easily detectable in body fluids. Mitochondria might also be a critical site in HCC tumorigenesis, as 11% of the proteins were located there.
We paid particular attention to two proteins (GS and PBLD) associated with small HCCs. GS catalyzes the synthesis of glutamine from glutamate and ammonia and plays an important role in ammonia detoxification, nitrogen balance, and pH regulation in the liver.[10,13,14]GS has been shown by immunohistochemistry andin situhybridization to be located in a small populationof hepatocytes (<8% of total hepatocytes) surrounding the terminal hepatic venules in human liver.[15]Poyck et al suggested that cell-cell and cell-matrix interactions cause this unique expression during development.[16,17]We and others have demonstrated that positive GS staining of hepatocytes forms a "map-like" pattern in normal liver tissues. However, in HCC or cirrhotic liver tissues, GS is positive with a completely different pattern that appears diffuse and not "map-like".[10]A recent study in transgenic mice has shown that the restricted expression of the enzyme in HCC is regulated by relevant morphogen signaling.[18]The aspect of distribution of the enzyme in liver tissues may also be valid for other tissues. Thus, understanding the heterogeneous expression of GS may help to understand fundamental mechanisms of cell differentiation and cooperation and may provide initial glimpses into the blueprint of tissue architecture and function. Researchers[19-22]measured the serum concentration of glutamine and noted that it decreases in advanced cancers, especially in the parenchyma of cirrhotic liver where HCC occurs. Glutamine is the endproduct of GS activity, and is the main energy source of tumor cells.[23-25]Saitoh and Araki[26]found that a low glutamine concentration increases the half-life of GS protein. It is reasonable to hypothesize that increased GS might be the result of glutamine deficiency. It was also demonstrated that GS mRNA, GS protein, and GS activity are upregulated in human HCCs, and Di Tommaso et al further confirmed GS to be a useful biomarker for early diagnosis and prognosis in HCC patients.[27,28]β-catenin is a chief component of the canonical Wnt pathway, and is involved in a variety of cancers, including HCC. The GS gene, the target gene of β-catenin, plays a crucial role in protein metabolism in the liver and in other tissues.[29]Cieply et al[30]reported that the overexpression of GS is highly correlated with β-catenin mutation, and proposed GS as an overall reliable marker of β-catenin activation secondary to its mutation. Behari et al[31]proposed that targeting β-catenin may be an attractive approach to HCC treatment. Since all HCCs in our proteomics study were small, and the Edmondson grades of most HCCs in our immunohistochemistry study were Ⅱ-Ⅲ. We suggest that strong and widespread GS expression takes place in the early phases of malignant transformation. Di Tommaso et al[32]suggested that, in keeping with this early role in hepatic tumorigenesis, GS overexpression is associated with tumor dedifferentiation. In fact, we noted the interesting phenomenon that strong and diffuse cytoplasmic immunoreactivity frequently appeared not only in tumor tissue, but also in cirrhotic tissue with inflammation, necrosis, or/and regeneration, indicating that GS is associated with inflammation and regeneration. In a dose-response study using CD1-mice injected with nonlethal or lethal doses of acetaminophen, Apte et al[18]identified that β-catenin activation is related to increased liver regeneration and that β-catenin plays a positive role in driving regeneration after toxicantinduced liver failure by mediating proliferation through regulation of cyclin-D1 levels. They noted that β-catenin activation is an early event and is vital for regeneration. Researchers[33,34]also demonstrated that β-catenin activation is crucial for liver regeneration and plays a key role in regulating the expression of various cyclins (A, D, and E), which are critical for the G1 to S phase transition of the cell cycle. This is of special interest, since there is currently no sensitive marker for liver regeneration except AFP.[35]In light of the high correlation between GS overexpression and β-catenin mutation, it is reasonable to suggest that GS and β-catenin play potential roles in regeneration and they may be sensitive markers for liver regeneration besides AFP.
Our study of the HCC group demonstrated that elevated GS values were highly correlated with elevated AFP values, suggesting that GS levels in HCC patients are closely related to tumorigenesis or/and its progression.
Iriyama et al[36]first reported that the PBLD gene is widely expressed in human tissues, such as brain, heart, lung, liver, pancreas, kidney, and placenta. Rebouisson et al[37]found that TNF-α induces the expression of PBLD protein in H411E liver cells. Recently Zhang et al[38]reported that PBLD is down-regulated in gastric cancer tissue, suggesting its potential as a gastric cancer-related marker. Li et al[9]found in proteomic analysis of HBV-associated HCC that PBLD decreases in tumor tissues compared with nontumor tissues, as was seen in our study. However, they did not validate their findings with regard to PBLD or study its biological function. Although there is little systematic information about its biological functions, Iriyama and Datta have confirmed that PBLD is an isomerase protein with high affinity for serine-threonine kinase receptor-associated protein, which participates in interactions leading to inhibition of transcriptional activation mediated by TGF-β signaling that may promote cell growth leading to tumorigenicity.[36,39]Taken together, we hypothesize that the interaction of PBLD and MAWD plays an essential role in HCC tumorigenesis.
GS and PBLD could be potential markers for HCC, and GS could be a novel serum marker for early HCC, especially in patients with low AFP levels (≤200 ng/ml). Further studies on these patients may shed some light on mechanisms that cause HCC, and contribute to research and development of chemotherapy for HCC.
Acknowledgments
We thank the Department of Hepatobiliary Surgery of Chaoyang Hospital and the Department of Surgery of Youan Hospital for the preparation of hepatic tissue specimens.
Funding: This study was supported by a grant from the Beijing Municipal Science and Technology Commission (No. Z0006264040791). Ethical approval: Not needed.
Contributors: LJ and WBE proposed the study. LJ wrote the first draft. All authors contributed to the design and interpretation of the study and to further drafts. WBE and LSQ are the guarantors.
Competing interest: No benefits in any form have been received or will be received from a commercial party related directly or indirectly to the subject of this article.
1 Mendizabal M, Reddy KR. Current management of hepatocellular carcinoma. Med Clin North Am 2009;93:885-900, viii.
2 Pawlotsky JM, Cocquerel L, Durantel D, Lavillette D, Lerat H, Pécheur EI, et al. HCV research 20 years after discovery: a summary of the 16th international symposium on hepatitis C virus and related viruses. Gastroenterology 2010;138:6-12.
3 Seow TK, Liang RC, Leow CK, Chung MC. Hepatocellular carcinoma: from bedside to proteomics. Proteomics 2001;1: 1249-1263.
4 Zhou XD, Tang ZY, Yang BH, Lin ZY, Ma ZC, Ye SL, et al. Experience in one thousand hepatectomy for small hepatocellular carcinoma. Zhong Guo Shi Yong Wai Ke Za Zhi 2001;21:41-44.
5 Li N, Zhang J, Liang Y, Shao J, Peng F, Sun M, et al. A controversial tumor marker: is SM22 a proper biomarker for gastric cancer cells? J Proteome Res 2007;6:3304-3312.
6 Oka H, Tamori A, Kuroki T, Kobayashi K, Yamamoto S. Prospective study of alpha-fetoprotein in cirrhotic patients monitored for development of hepatocellular carcinoma. Hepatology 1994;19:61-66.
7 Blanc JF, Lalanne C, Plomion C, Schmitter JM, Bathany K, Gion JM, et al. Proteomic analysis of differentially expressed proteins in hepatocellular carcinoma developed in patients with chronic viral hepatitis C. Proteomics 2005;5:3778-3789.
8 Feng JT, Liu YK, Song HY, Dai Z, Qin LX, Almofti MR, et al. Heat-shock protein 27: a potential biomarker for hepatocellular carcinoma identified by serum proteome analysis. Proteomics 2005;5:4581-4588.
9 Li C, Tan YX, Zhou H, Ding SJ, Li SJ, Ma DJ, et al. Proteomic analysis of hepatitis B virus-associated hepatocellular carcinoma: Identification of potential tumor markers. Proteomics 2005;5:1125-1139.
10 Bioulac-Sage P, Laumonier H, Rullier A, Cubel G, Laurent C, Zucman-Rossi J, et al. Over-expression of glutamine synthetase in focal nodular hyperplasia: a novel easy diagnostic tool in surgical pathology. Liver Int 2009;29:459-465.
11 Sun W, Xing B, Sun Y, Du X, Lu M, Hao C, et al. Proteome analysis of hepatocellular carcinoma by two-dimensional difference gel electrophoresis: novel protein markers in hepatocellular carcinoma tissues. Mol Cell Proteomics 2007; 6:1798-1808.
12 Sun S, Lee NP, Poon RT, Fan ST, He QY, Lau GK, et al. Oncoproteomics of hepatocellular carcinoma: from cancer markers' discovery to functional pathways. Liver Int 2007;27: 1021-1038.
13 Brosnan ME, Brosnan JT. Hepatic glutamate metabolism: a tale of 2 hepatocytes. Am J Clin Nutr 2009;90:857S-861S.
14 Gebhardt R, Baldysiak-Figiel A, Krügel V, Ueberham E, Gaunitz F. Hepatocellular expression of glutamine synthetase: an indicator of morphogen actions as master regulators of zonation in adult liver. Prog Histochem Cytochem 2007;41:201- 266.
15 Haussinger D, Schliess F. Glutamine metabolism and signaling in the liver. Front Biosci 2007;12:371-391.
16 Poyck PP, Hoekstra R, Vermeulen JL, van Wijk AC, Chamuleau RA, Hakvoort TB, et al. Expression of glutamine synthetase and carbamoylphosphate synthetase i in a bioartificial liver: markers for the development of zonation in vitro. Cells Tissues Organs 2008;188:259-269.
17 Malarkey DE, Johnson K, Ryan L, Boorman G, Maronpot RR. New insights into functional aspects of liver morphology. Toxicol Pathol 2005;33:27-34.
18 Apte U, Singh S, Zeng G, Cieply B, Virji MA, Wu T, et al. Beta-catenin activation promotes liver regeneration after acetaminophen-induced injury. Am J Pathol 2009;175:1056-1065.
19 Medina MA. Glutamine and cancer. J Nutr 2001;131:2539S-2542S.
20 Parry-Billings M, Leighton B, Dimitriadis GD, Curi R, Bond J, Bevan S, et al. The effect of tumour bearing on skeletal muscle glutamine metabolism. Int J Biochem 1991;23:933-937.
21 Souba WW. Glutamine and cancer. Ann Surg 1993;218:715-728.
22 Kaiser S, Gerok W, Haussinger D. Ammonia and glutamine metabolism in human liver slices: new aspects on the pathogenesis of hyperammonaemia in chronic liver disease. Eur J Clin Invest 1988;18:535-542.
23 Yang C, Sudderth J, Dang T, Bachoo RM, McDonald JG, DeBerardinis RJ. Glioblastoma cells require glutamate dehydrogenase to survive impairments of glucose metabolism or Akt signaling. Cancer Res 2009;69:7986-7993.
24 Dang CV. MYC, microRNAs and glutamine addiction in cancers. Cell Cycle 2009;8:3243-3245.
25 DeBerardinis RJ, Cheng T. Q's next: the diverse functions of glutamine in metabolism, cell biology and cancer. Oncogene 2010;29:313-324.
26 Saitoh F, Araki T. Proteasomal degradation of glutamine synthetase regulates schwann cell differentiation. J Neurosci 2010;30:1204-1212.
27 Di Tommaso L, Destro A, Seok JY, Balladore E, Terracciano L, Sangiovanni A, et al. The application of markers (HSP70 GPC3 and GS) in liver biopsies is useful for detection of hepatocellular carcinoma. J Hepatol 2009;50:746-754.
28 Bioulac-Sage P, Rebouissou S, Thomas C, Blanc JF, Saric J, Sa Cunha A, et al. Hepatocellular adenoma subtype classification using molecular markers and immunohistochemistry. Hepatology 2007;46:740-748.
29 Cadoret A, Ovejero C, Terris B, Souil E, Lévy L, Lamers WH, et al. New targets of beta-catenin signaling in the liver are involved in the glutamine metabolism. Oncogene 2002;21: 8293-8301.
30 Cieply B, Zeng G, Proverbs-Singh T, Geller DA, Monga SP.Unique phenotype of hepatocellular cancers with exon-3 mutations in beta-catenin gene. Hepatology 2009;49:821-831.
31 Behari J, Zeng G, Otruba W, Thompson MD, Muller P, Micsenyi A, et al. R-Etodolac decreases beta-catenin levels along with survival and proliferation of hepatoma cells. J Hepatol 2007;46:849-857.
32 Di Tommaso L, Franchi G, Park YN, Fiamengo B, Destro A, Morenghi E, et al. Diagnostic value of HSP70, glypican 3, and glutamine synthetase in hepatocellular nodules in cirrhosis. Hepatology 2007;45:725-734.
33 Sekine S, Gutiérrez PJ, Lan BY, Feng S, Hebrok M. Liverspecific loss of beta-catenin results in delayed hepatocyte proliferation after partial hepatectomy. Hepatology 2007;45: 361-368.
34 Tan X, Behari J, Cieply B, Michalopoulos GK, Monga SP. Conditional deletion of beta-catenin reveals its role in liver growth and regeneration. Gastroenterology 2006;131:1561-1572.
35 Schmidt LE, Dalhoff K. Alpha-fetoprotein is a predictor of outcome in acetaminophen-induced liver injury. Hepatology 2005;41:26-31.
36 Iriyama C, Matsuda S, Katsumata R, Hamaguchi M. Cloning and sequencing of a novel human gene which encodes a putative hydroxylase. J Hum Genet 2001;46:289-292.
37 Rebouissou S, Imbeaud S, Balabaud C, Boulanger V, Bertrand-Michel J, Tercé F, et al. HNF1alpha inactivation promotes lipogenesis in human hepatocellular adenoma independently of SREBP-1 and carbohydrate-response element-binding protein (ChREBP) activation. J Biol Chem 2007;282:14437-14446.
38 Zhang J, Kang B, Tan X, Bai Z, Liang Y, Xing R, et al. Comparative analysis of the protein profiles from primary gastric tumors and their adjacent regions: MAWBP could be a new protein candidate involved in gastric cancer. J Proteome Res 2007;6:4423-4432.
39 Datta PK, Moses HL. STRAP and Smad7 synergize in the inhibition of transforming growth factor beta signaling. Mol Cell Biol 2000;20:3157-3167.
Received November 16, 2009
Accepted after revision April 8, 2010
Author Affiliations: Liver Research Center, Beijing Friendship Hospital, Capital Medical University, Beijing 100050, China (Long J and Wang BE); Department of Hepatology (Long J), Department of Pathology (Lang ZW), Beijing Youan Hospital, Capital Medical University, Beijing 100069, China; Department of Pharmaceutical Affairs, Beijing Chaoyang Hospital, Capital Medical University, Beijing 100020, China (Wang HG); Department of Pathology, China-Japan Friendship Hospital, Beijing 100029, China (Wang TL); Beijing Genomics Institute, Chinese Academy of Science, Beijing Airport Industrial Zone B-6, Shunyi, Beijing 101300, China (Liu SQ)
Bao-En Wang, MD, Professor, Liver Research Center, Beijing Friendship Hospital, Capital Medical University, Beijing 100050, China (Tel: 86-10-63164411; Fax: 86-10-63164411; Email: wangbbee@126.com)
© 2010, Hepatobiliary Pancreat Dis Int. All rights reserved.
杂志排行

Hepatobiliary & Pancreatic Diseases International的其它文章
- Pancreas transplantation in the mouse
- Modified arteriaIization of orthotopic Iiver transpIantation in a mouse modeI
- Relationship between the expression of IP-10 and IP-10 mRNA in peripheral blood and HBV DNA level in patients with cirrhosis
- Integrity of the pancreatic duct-acinar system in the pathogenesis of acute pancreatitis
- Adult-to-adult living donor liver transplantation for malignant metastatic melanoma to the liver
- An effective model for predicting acute kidney injury after liver transplantation