Effects of orientation on the fatigue crack growth behaviors of the ZK60 magnesium alloy in air and PBS
2024-04-18JiqiHuZhengLiuZuolingNingHongGo
Jiqi Hu ,Zheng Liu ,Zuoling Ning ,Hong Go,b,∗
a School of Chemical Engineering and Technology, Tianjin University, Tianjin 300072, China
b Tianjin Key Laboratory of Chemical Process Safety and Equipment Technology, Tianjin 300072, China
Abstract Strong anisotropic corrosion and mechanical properties caused by specimen orientations greatly limit the applications of wrought magnesium alloys.To investigate the influences of specimen orientation,the corrosion tests and (corrosion) fatigue crack growth tests were conducted.The rolled and transverse surfaces of the materials show distinct corrosion rate differences in the stable corrosion stage,but the truth is the opposite for the initial stage of corrosion.In air,specimen orientations have a significant influence on the plastic deformation mechanisms near the crack tip,which results in different fatigue fracture surfaces and cracking paths.Compared with R-T specimens,N-T specimens show a slower fatigue crack growth (FCG) rate in air,which can be attributed to crack closure effects and deformation twinning near the crack tip.The corrosion environment will not significantly change the main plastic deformation mechanisms for the same type of specimen.However,the FCG rate in phosphate buffer saline (PBS) is one order of magnitude higher than that in air,which is caused by the combined effects of hydrogen-induced cracking and anodic dissolution.Owing to the similar corrosion rates at crack tips,the specimens with different orientations display close FCG rates in PBS.
Keywords: Magnesium alloy;Orientation;Corrosion;Fatigue crack growth.
1.Introduction
Due to its excellent physical properties such as low density,good machinability,and high specific strength,magnesium(Mg) and its alloys have received increasing attention in numerous fields,including aerospace,automobile,and biomedical [1–3].Especially for biological implantations,Mg alloys possess excellent bio-degradability,comparable mechanical properties with natural bone,and the best bio-compatibilities with human physiology.Over the past two decades,many studies were conducted to explore,understand,and improve their mechanical and corrosion properties.
Mg and its alloys have a hexagonal close-packed (HCP)crystal structure,and their mechanical properties are different from those of more commonly used cubic materials due to fewer and more difficult to activate slip systems[4].The basal slip (i.e.(0001)<110>) and two non-basal slip modes (the prismatic ({100}<110>) and the pyramidal({101}<110>)) provide deformation parallel to the basal plane only.Furthermore,the pyramidal
Specimen orientation has a significant influence on deformation mechanisms [7],fatigue behaviors [8],and crack propagation performance [9].Owing to the combined effect of Schmid factor (SF) and CRSS,0° (rolled direction) ∼90°(normal direction) orientation specimens display the different yield stresses and deformation modes under tensile tests[10].In air,0° specimens show the highest fatigue strength while the 45° specimens display the lowest fatigue strength and hysteresis with the best symmetry [8].In the Mode-I fatigue crack growth experiments,the orientation of extruded Mg alloy also has a significant influence on the crack growth rate and path [11].As an implant for the human body,Mg alloys not only bear the cyclic load required by body movement but also suffer from corrosion from the human environment.Under the coupling of stress and corrosion,Mg alloys have proved to be susceptible to environmentally assisted cracking in corrosion environments,displaying significantly lower corrosion fatigue resistance in the modified simulated body fluids than in air [12].Solution treatment can increase the corrosion fatigue resistance of as-forged Mg-Zn-Y-Zr alloy by suppressing localized corrosion sites [13].Ultrafine-grains obtained by carefully designed multi-directional compression treatment greatly improve the strength and corrosion resistance of the AZ91 Mg alloy [14].The change of solution pH values also has an obvious influence on the corrosion and crack growth behaviors of the ZK60 Mg alloy [15].Few studies have discussed the effect of orientation on mechanical and chemical coupling failure behaviors of ZK60 Mg alloys.Therefore,revealing the interaction between corrosion and cyclic stress of specimens with different orientations is crucial for Mg alloys’application.
In the current study,the corrosion and electrochemical corrosion experiments of two oriented surfaces were carried out to analyze their corrosion behavior and provide evidence for the following discussion.The failure behaviors of different specimen orientations were explored through crack growth experiments in air and corrosion environment.Meanwhile,their deformation and failure mechanisms were analyzed by microstructure characterization means.
2.Materials and methods
Commercial rolled ZK60 plates of 40 mm thickness are used in the current study,the element composition is listed in Table 1.To distinguish the orientations of rolled plates,the marks of three directions (Rolled Direction (RD),Transverse Direction (TD),Normal Direction (ND)) and three surfaces (Rolled Surface (RS),Transverse Surface (TS),Longitudinal Surface (LS)) of plates are arranged and shown in Fig.1.The metallography of different surfaces was observed by KEYENCE (VHX-900F) optical microscope (OM).The texture of the material was inspected by the FEI (Apreo S LoVac) scanning electron microscope (SEM) equipped with an EDAX (Hikari Super) electron backscattering diffraction(EBSD) detector.

Table 1 Chemical element composition of ZK60 Mg alloys.
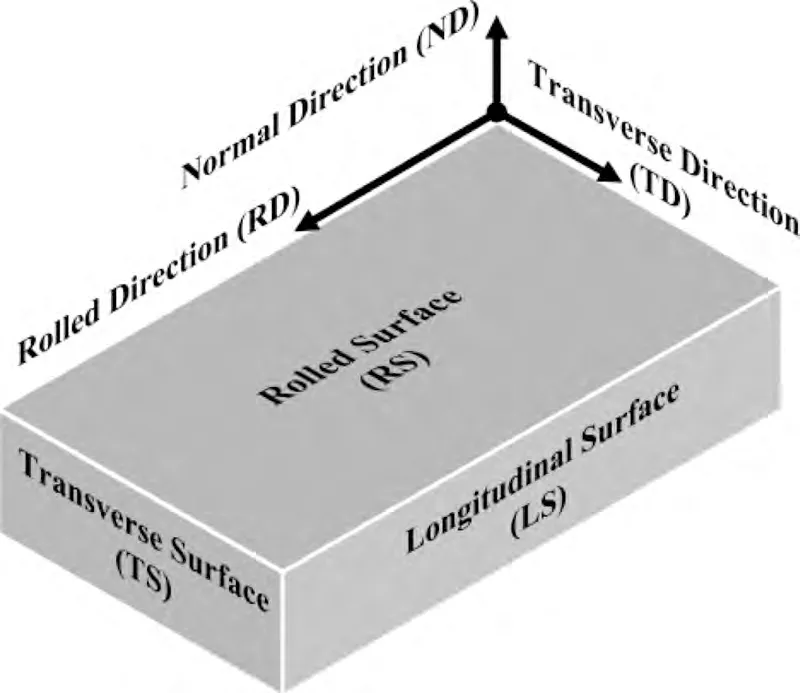
Fig.1.Schematic diagram of the orientation marks of rolled plate.
The hydrogen evolution tests were carried out on the RS and TS,and other surfaces were protected with epoxy.Before the tests,the measured surface was also grounded with 1000-grit green silicon carbide papers.Then,the specimens were horizontally immersed for 50 h in 37 °C PBS solution (8 g/L NaCl,0.2 g/L KCl,1.44 g/L Na2HPO4,and 0.24 g/L KH2PO4) with saturated hydrogen,and the evolved hydrogen was collected in a burette above the corroded specimens and regularly recorded.Meanwhile,electrochemical tests were also conducted on the RS and TS using a threeelectrode system with a saturated calomel electrode (SCE)acting as the reference electrode,a platinum electrode acting as the counter electrode,and the specimen acting as the working electrode.Electrochemical impedance spectroscopy(EIS) tests were conducted at different immersion times (2,4,6,8,10,and 12 h).The frequency range and amplitude of EIS were 100 kHz–0.01 Hz and 10 mV,respectively.Following the last EIS test,potentiodynamic polarization tests were conducted with a scan rate of 2 mV/s from -0.5 VSCEto+0.5 VSCErelative to the open circuit potential.
The mechanical experiments were carried out on IBTC-4000in-situmechanical test system.The dog-bone-shaped specimen was prepared for monotonic mechanical tests,which were controlled by machine displacement with a speed of 0.03 mm/s at room temperature,specimens’ dimensions were shown in Fig.2(a).Compact tension(CT)specimens with two orientations were prepared for fatigue crack growth (FCG)experiments,specimens’ dimensions and orientations were shown in Fig.2(b) and 2(c),respectively.The "X-Y" was used to mark specimens with different orientations,"X" and"Y" represented the normal direction of the notch plane and the direction of crack propagation,respectively.Before the test,the surfaces of the CT specimen were protected by grease,and only the fracture surfaces were exposed to PBS.A triangular wave with a peak value of 235 N,a stress ratio (minimum load over maximum load in a loading cycle) of 0.1,and a frequency of 0.5 Hz was used as the testing load.For the FCG tests in PBS,an online system shown in Fig.3 was built.The CT specimen was vertically set in a corrosion chamber containing PBS,which maintained a constant temperature (37 °C) and a constant flow rate (160 mL/min).The crack length was observed by the camera and recorded by counting screw with an accuracy of 10 μm.

Fig.2.(a) Dog-bone-shaped specimen,(b) CT specimen,and (c) the orientation of CT specimens.

Fig.3.Schematic diagram of online fatigue crack growth system.
The corrosion product layer and corrosion surface of the hydrogen evolution specimens were observed by SEM.After FCG tests,the fracture surfaces and crack growth paths of the specimens were inspected using OM and SEM.In addition,the microstructure near the crack tip in air was observed by SEM and EBSD,before the FCG tests,the CT specimen’s surface was electrochemical polished using AC2 solution.
3.Results
3.1. Metallography, texture, and tensile properties
Fig.4 shows the three-dimensional metallography and texture of rolled plate.According to the metallography in Fig.4(a),the RS is composed of irregular large-grains,equiaxed small-grains,and cluster fine-grains.The TS and LS have a similar grain structure,which is composed of long strip large-grains,equiaxed small-grains,and cluster fine-grains.According to the results of EBSD shown in Fig.4(b,c),the rolled plate has a strong basal texture,that is,the c-axis of most grains are parallel to the ND.
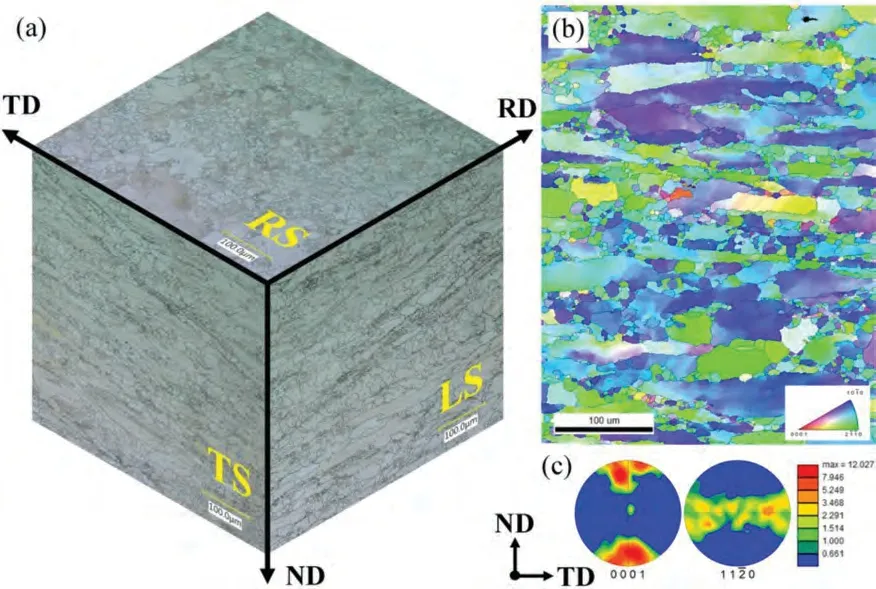
Fig.4.(a) Three-dimensional metallography of rolled plate,(b) inverse pole figure of the TS,and (c) pole figure of {0001} and {110} crystal planes.
The uniaxial tensile curves of ZK60 plates in RD,TD,and ND are shown in Fig.5.The mechanical property parameters in different directions are listed in Table 2.Under the tension loading,the {102} tension twin and basal slip are in hard orientation for RD and TD,but ND specimen can activate extension twins easily,thereby showing low yield stress (the stress corresponding to 0.2% plastic strain).The existence of twins hinders the prismatic slip system in the subsequent stage of tension,resulting in greater engineering stress in ND than that in RD and TD.The ND specimen also shows better elongation and ductility due to more available deformation systems.According to the {110} pole figure shown in Fig.4(c),the distribution of grain a-axis is random,resulting in similar mechanical properties of TD and RD.

Table 2 Uniaxial mechanical property parameters in different directions of ZK60 plates.
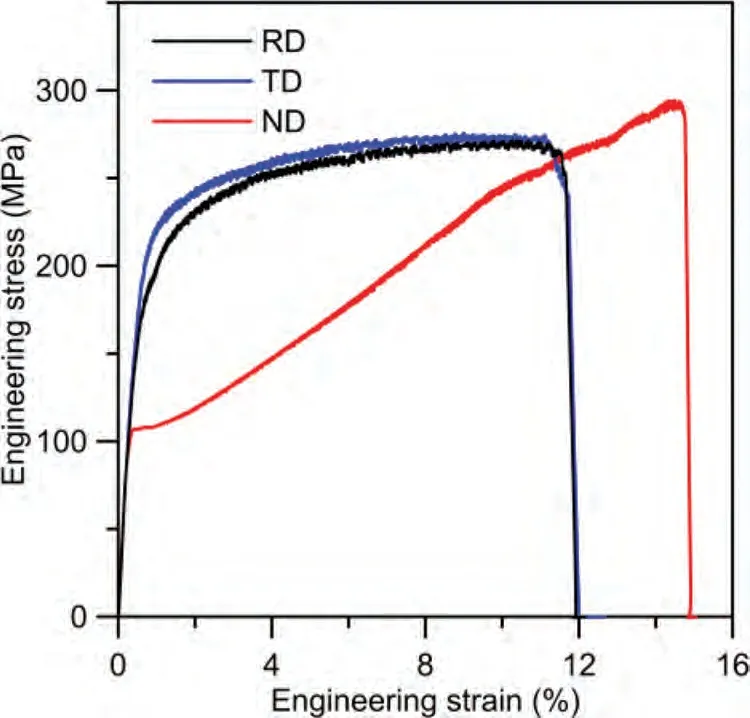
Fig.5.Uniaxial tensile curves of ZK60 plate along RD,TD,and ND.
3.2. Corrosion and electrochemical corrosion
Fig.6 shows the hydrogen evolution curves of RS and TS.According to the enlarged figure,the difference in hydrogen evolution volume between the two orientations is small within 4 h.After that,TS specimens directly enter the stable corrosion stage,while RS specimens take a longer time to stabilize.During the stable corrosion stage,the hydrogen evolution rate of the TS specimen is twice as fast as that of the RS specimen.After hydrogen evolution tests,the corrosion morphology of RS and TS is observed.As shown in Fig.7(a,b),the corrosion layers on two types of specimens both consist of cracked block products and fine powdery products.The block products are Mg(OH)2formed by the reaction of magnesium matrix and aqueous solution,and the powdery products are poorly soluble phosphate Mg3(PO4)2formed by magnesium ions and phosphate ions in PBS [15].After immersion for 2 h,RS (Fig.7(c)) and TS (Fig.7(d)) without corrosion products both show typical filiform corrosion characteristics.Due to the different metallographic structures shown in Fig.4(a),their filiform corrosion traces display different geometry.In addition,a few small pitting pits are observed on the path of filiform corrosion.After immersion for 50 h,RS is mainly composed of fine and shallow pitting corrosion pits shown in Fig.7(e),while TS has a lot of large pitting pits shown in Fig.7(f).According to the three-dimensional morphology results shown in Fig.7(g,h),the surface corrosion of the TS specimen is more serious,which is consistent with the results of hydrogen evolution tests.

Fig.7.The corrosion product layers ((a),(b)),corrosion surfaces for 2 h ((c),(d)) and 50 h ((e) (f)),three-dimensional surface morphology ((g),(h)) after immersion tests.
Fig.8 shows the electrochemical corrosion results of RS and TS.The Nyquist diagrams of different immersion times shown in Fig.8(a) are fitted using the equivalent circuit in Fig.8(b),and fitting results are listed in Table 3.In the equivalent circuit,Rsrepresents the solution resistance.Doublelayer capacitanceCtin parallel with charge transfer resistanceRtis used to simulate the capacitive reactance arc in the middle-frequency region.Rtis related to the interface charge transferability when the alloys dissolve,the larger value means the slower dissolution rate of the anode i.e.,Mg matrix.The inductive arc in the low-frequency region is simulated by equivalent resistanceRLand equivalent inductanceL[16].The occurrence of inductive arc is concerned with the formation of pitting nucleation,and the inductive response mainly comes from the change of film thickness and adsorption film coverage at pitting corrosion.Fig.8(c,d) summarize the varieties ofRtandRLwith immersion time.The trends ofRtare in good agreement with the results of hydrogen evolution tests shown in Fig.6.In terms of the equivalent pitting resistanceRL,the TS specimen is always lower than the RS specimen,that is,the pitting tendency of the TS specimen is greater.Coupled with the higher anodic dissolution rate of the TS specimen,larger pitting corrosion pits shown in Fig.7(f) are formed on its surface.Fig.8(e) shows the potentiodynamic polarization results of RS and TS specimens after 12 h’ immersion.The Tafel curves of both show a similar shape,which indicates that they have similar electrochemical corrosion behavior.According to the fitting results of the Tafel curves in Table 4,the corrosion potentialVcorrof RS and TS is almost equal.The results of corrosion current densityicorrare in good agreement with the results of hydrogen evolution,in which the corrosion rate of RS is about half of that of TS during the stable corrosion stage.

Table 3 EIS fitting results of different immersion times for RS and TS specimens.

Table 4 The fitting results of Tafel curves.
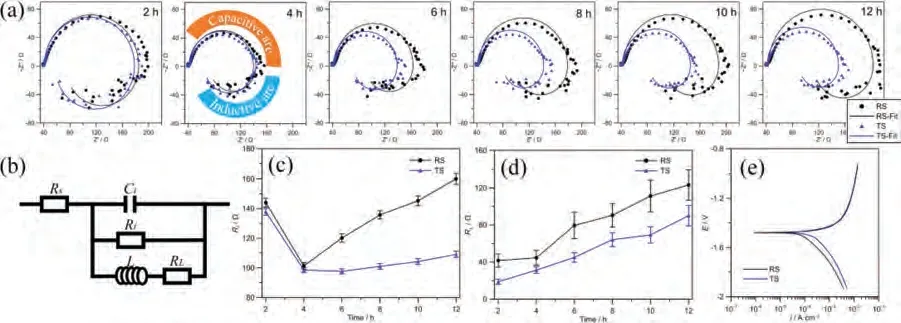
Fig.8.(a) Nyquist diagram of different immersion time,(b) equivalent circuit,(c) varieties of charge transfer resistance Rt and (d) inductance equivalent resistance RL and with immersion time,and (e) Tafel curves for RS and TS specimens.
3.3. Fatigue crack growth rate
Fig.9 shows the FCG rate curves of CT specimens with different orientations in air and PBS.The crack growth rate(da/dN) can be obtained from Eq.(1):

Fig.9.FCG rate of CT specimens with different orientations in air and PBS.
whereΔPis the difference between maximum load and minimum load,Bis the thickness of specimens,Wis the width of specimens andα=/W.In the logarithmic coordinate system,da/dNandΔKshow a good linear relationship,which can be described by the following Paris formula:
whereCandmare material parameters.
As shown in Fig.9,the corrosion FCG rate of specimens is about one order of magnitude higher than the atmospheric FCG rate.In air,the FCG rate of R-T specimens is higher than that of N-T specimens.In PBS,the difference in FCG rate between them is not obvious.In the current study,no obvious three sub-stages reported in Ref.[9],which is characterized by three distinguishable Paris law slopes during the stable crack growth,are found.Only a single slope commonly occurring in traditional materials is observed,which may be concerned with the relatively continuous crack growth path and limitedΔKrange.
3.4. Fatigue fracture observation
Fig.10 shows the overall and partial enlarged detail of fracture for the FCG tests in air and PBS.As shown in Fig.10(a–d),for the same specimen orientation,the fracture surface in air is flatter than that in PBS.Under the same environment,the fracture surface of R-T specimens is significantly smoother than that of N-T specimens.From the partial enlarged detail in Fig.10(e),it can be found that the fracture surface of R-T specimens in air shows typical quasicleavage fracture characteristics,which are composed of many river-like cleavage planes and tear ridges along the crack’s growth direction.In contrast,the tear ridges of N-T specimens shown in Fig.10(f) are disordered,and larger cleavage planes and V-shaped patterns with an included angle of about 122° can be found at local positions.These characteristics indicate that the N-T specimens frequently pass through the long strip large-grains,and similar phenomena have occurred in the Ref.[11].Under the influence of chemical corrosion,the cleavage planes and tear ridges of fracture in PBS become not obvious,which is shown in Fig.10(g,h).In addition,many secondary cracks appear on the corrosion fatigue fracture surface,which is usually related to hydrogen embrittlement [17].Many small-sized secondary cracks along the propagation direction are found on the fracture surface of R-T specimens.While the fracture surface of the N-T specimen appears many large-sized secondary cracks with irregular distribution directions.

Fig.10.Overall morphology and partially enlarged detail of FCG fracture for ((a),(e)) R-T specimens in air,((b),(f)) N-T specimens in air,((c),(g)) R-T specimens in PBS,((d),(h)) N-T specimens in PBS.
3.5. Crack propagation path observation
According to the crack propagation path shown in Fig.11(a–d),the FCG paths of all specimens follow mode-I on the whole.Similar to the features of the aforementioned fractures,the FCG path in air of specimens with the same orientation is straighter than that in PBS.Under the same test environment,the FCG path of R-T specimens is significantly smoother than that of N-T specimens.Especially for the N-T specimens in PBS shown in Fig.11(d),the crack path appears obvious localized deflections,and secondary cracks or bifurcation cracks.
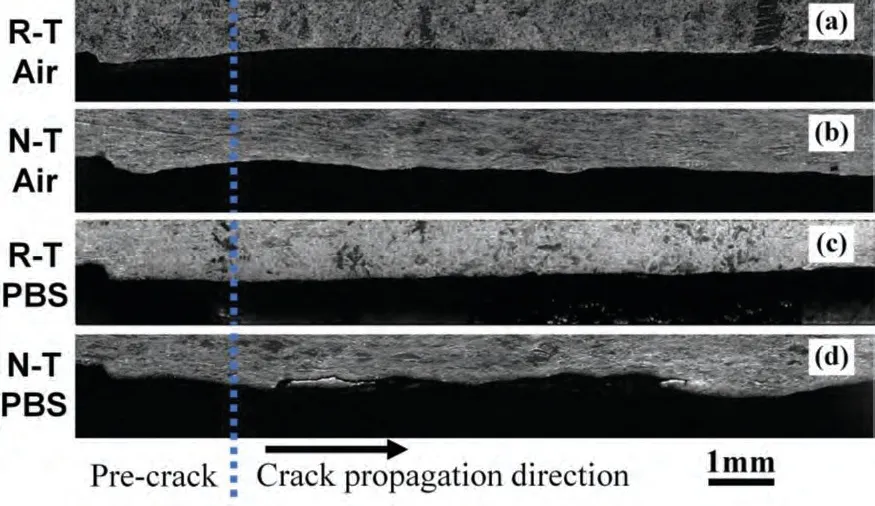
Fig.11.Overall fatigue crack propagation path: (a) R-T specimen in air,(b) N-T specimen in air,(c) R-T specimen in PBS,and (d) N-T specimen in PBS.
The microstructure near the propagation path at differentΔK(4 MPa•m1/2,6 MPa•m1/2,9.5 MPa•m1/2) is further examined,and the twins are marked in red as shown in Fig.12.Whether in air or PBS,the main fracture mode is the transgranular fracture,and occasionally intergranular fracture occurs at the position of cluster fine-grains.For the same specimen orientation,the microstructure near the crack is similar in the different environments,which indicates that the corrosion environment won’t significantly change their main plastic deformation mechanisms.As shown in Fig.12(a,c),for the R-T specimens under the smallerΔK,no obvious twins are observed near the crack.UntilΔKreaches 9.5 MPa•m1/2,a few fine twins can be found along the crack edge.Jiang et al.also found similar results for R-T specimens,in which twins are difficult to be activated.Only ifΔKis up to 7 MPa•m1/2only,obvious residual twins can be observed near the crack using OM [9].In PBS,underΔK=9.5 MPa•m1/2,many secondary cracks appear along the edge of the grains and residual twins,which indicates that the coupling of corrosion and stress promotes the tendency of intergranular cracking.For the N-T specimens in Fig.12(b,d),the number and size of twins near the crack increase with theΔK.In addition,the number of twins within the 20 μm area of the crack edge of N-T specimens in PBS (Fig.12(d)) is more than that in air(Fig.12(b)),which will be explained in the following discussion.

Fig.12.The microstructure along the propagation path at different ΔK: (a) R-T specimens in air,(b) N-T in air,(c) R-T specimens in PBS,(d) N-T specimens in PBS.
4.Discussion
4.1. Fatigue crack growth behaviors of different specimen orientations in air
In the stable FCG stage (Paris region),the crack growth is closely related to the plastic zone at the crack tip.According to the alternating slip model [18],irreversible hardening slip and reversible non-hardening slip successively emanate on the specific system under tension loading.In the following unloading stage,the non-hardening system slip completely returns to the crack tip,while the irreversible slip is retained,which leads to crack propagation along a specific plane.Hardening and non-hardening slip appear alternately on both sides of the crack tip,which leaves regular strips on the fracture surface.To further understand the plastic deformation mechanisms of different specimen orientations in air,the surface morphology and crystal orientation near the crack tip under smallΔKare observed and shown in Fig.13.Deformation traces on the specimens’ surface are marked with three black straight lines,and the corresponding crystal plane traces parallel to the surface deformation traces are marked with a color line.For the R-T specimens shown in Fig.13(a),the plastic zone near the crack tip is very small,and the surface deformation traces are mainly distributed at the edge of the crack in an emission shape.Due to the smallerΔKand hard orientation,no extension twins are directly observed in Fig.13(a).Only by carefully observing the EBSD results(Fig.13(c)) can a small number of fine residual twins be found.The surface deformation traces or bifurcated secondary cracks are mainly parallel to the {101} and {0001} crystal planes,which is similar to the research results of pure magnesium single crystal by Ando et al.[19].At room temperature,this oriented Mg alloy can activate the pyramidal

Fig.13.The surface morphology and crystal orientation near the crack tip under small ΔK: (a) and (c) for R-T specimens;(b) and (d) for N-T specimens.
For the N-T specimens shown in Fig.13(b),the plastic zone around the crack tip is significantly larger,and the surface deformation traces have a wider distribution range.Since the deformation twinning is in soft orientation,a large number of coarse {102} extension twins (regions painted red) appear at both sides away from the crack path and on the lateral leading edge of the crack tip.Similarly,due to the non-ideal crystal orientation,the local positions also activate the basalslips.Moreover,some surface wrinkled traces parallel to the {102} crystal plane can be found at the edge of the crack.This finding indicates that the detwinning process occurs in these regions,which can be attributed to the crack closure effect.The appearance of a large number of extension twins results in the out-of-plane shrinkage near the crack path due to the rotation of crystals.During the cyclic unloading stage,the separated crack surface will close in advance and squeeze each other,thereby causing the de-twinning behavior at the crack edge.As shown in Fig.13(b),the crack path has obvious signs of squeezing each other.
The difference in FCG rate between the two specimen orientations in air can be explained from the following two aspects.One is the aforementioned crack closure effect,which can reduce the effective stress intensity factor range of N-T specimens,thus weakening the driving force of crack growth.In addition,from the perspective of energy conservation,the energy input from the outside to the system can be used in three parts: increasing the strain energy of the system,forming the new crack surfaces,and changing the kinetic energy of the system.Among them,the change of kinetic energy can be ignored during the stable cracking stage.Comparing Fig.13(a,b),it is not difficult to find that the deformation of the crack tip of the N-T specimen is larger than that of the R-T specimen,that is,the energy that can be used to form the new crack surface of the N-T specimen is less than that of the R-T specimen,which leads to the lower FCG rate of N-T specimen.
4.2. Corrosion and FCG behaviors of different specimen orientations in PBS
In an aqueous solution,the Mg matrix and the secondphase form the corrosion galvanic cell,and the following reactions occur:
the deposition of Mg(OH)2on the surface (Fig.6(a,b)) can protect the Mg matrix.When the deposition and dissolution of Mg(OH)2reach equilibrium,the corrosion rate of the material enters the stable stage.In the stable corrosion stage,the difference in corrosion rate between the two surfaces is mainly concerned with the crystal orientation.Fig.4(b) shows that the TS is mainly composed of {100} and {110} prismatic planes.Combined with the pole figure in Fig.4(c),it is clear that the RS is mainly composed of {0001} basal planes.Owing to higher binding energy and lower surface energy of the basal planes with higher atomic arrangement density,they often display higher corrosion resistance than non-basal planes.Theoretically,the dissolution rate of prismatic planes is 18–20 times higher than that of basal planes [21].However,as shown in Fig.6,the actual corrosion rate of TS specimens is about twice that of RS specimens due to the influence of microstructure defects (vacancies,dislocations,etc.),secondphase galvanic corrosion,and nonideal texture in polycrystalline materials.It is worth noting that the corrosion rate between RS and TS specimens is no obvious difference in the early stage of the hydrogen evolution test,which may be related to the participation of filiform corrosion.Our previous research [15]results show that ZK60 Mg alloy displays filiform corrosion at the initial stage of immersion in neutral PBS.Because the main factor controlling filiform corrosion is the concentration of Cl-adsorbed on the head of filiform corrosion,which is influenced by the properties of the solution itself (such as pH value,Cl-concentration,etc.),the two specimens show similar hydrogen evolution rate in the early corrosion stage.With the extension of immersion time,pitting corrosion and filiform corrosion develop synchronously,the filiform corrosion area will be covered by shallow pitting pits.After entering the stable corrosion stage,pitting corrosion replaces filiform corrosion as the main corrosion form.For the TS specimens,the rapid entry into the stable corrosion stage makes the pitting corrosion on its surface more serious shown in Fig.7(f).
According to the EIS results shown in Fig.8(a),no obvious low-frequency capacitive reactance arc related to surface passivation film is found in the early corrosion stage.In addition,at the anodic polarization stage of Tafel curves shown in Fig.8(e),no breakdown potential is found.These results fully indicate that no strong protection passivation film can be formed for the two specimens.The weak corrosion film provides channels for hydrogen atoms generated by Eq.(6) to enter the Mg matrix.Solute hydrogen atoms diffuse between the lattice gaps,and many hydrogen traps with low potential energy near the crack tip,such as dislocations,(twin) grain boundaries,microcracks,and voids,will capture more solute hydrogen atoms.In the deformation process of materials,the diffused hydrogen atoms can significantly promote the nucleation and movement of dislocations,and dislocation will also carry hydrogen atoms to migrate to (twin) grain boundaries,microcracks,voids,and other defect locations faster [17].In PBS,the localized accumulation of dislocations and hydrogen atoms will significantly increase the stress concentration at defect positions,which makes the matrix crack under lower stress and display an obvious embrittlement tendency.The secondary cracks shown in Fig.10(g,h) are favorable evidence of matrix embrittlement.Moreover,the increase in the stress concentration at defect positions also induces more deformation twins for N-T specimens in PBS.During the stage of cyclic tensile unloading,the compression stress caused by the closure of the crack surfaces can be released by the secondary cracks near the crack path and restrain the occurrence of the de-twinning process.The increase in twinning driving force and the suppression to de-twinning make the number of twins within the 20 μm area of the crack edge increase obviously for the N-T specimen in PBS shown in Fig.12(d).
The crack growth rate of specimens in PBS is greatly higher than that in air,which can be attributed to the following two aspects.Firstly,during the process of FCG in PBS,the crack tip is in the cycle of matrix dissolution,film formation,and rupture.The dissolution of the fresh matrix at the crack tip will accelerate the growth of the crack [22].Secondly,the matrix embrittlement caused by the interaction between hydrogen atoms and cyclic stress can also significantly deteriorate the FCG resistance of the materials.In addition,for the high strength Mg alloys,the crack growth rateof corrosion fatigue can be obtained by the following formula [23]:
5.Conclusion
According to the results of corrosion and FCG experiments of different specimen orientations for rolled ZK60 Mg alloys,the following conclusions can be drawn:
(1) The specimen orientations have a significant influence on the stable corrosion rate (corrosion rate of RS is about half of that of TS),but the truth is the opposite for the initial corrosion rate,which can be attributed to the participation of filiform corrosion in the initial stage of immersion.Compared with RS,TS displays more serious pitting corrosion pits on its surface.
(2) For the same specimen orientation,the FCG paths and fracture surfaces in air are smoother than those in PBS.For the same testing environment,the FCG paths and fracture surfaces of R-T specimens are greatly smoother than that of N-T specimens.Transgranular cracking is the primary cracking mode for different specimen orientations and testing environments.However,the introduction of a corrosion environment increases the intergranular cracking trend.
(3) The specimen orientations have a significant influence on the plastic deformation mechanisms near the crack tip in air.For R-T specimens,the pyramidal
(4) In PBS,the main plastic deformation mechanisms of the two specimen orientations haven’t significantly changed.However,the increase in the stress concentration at the crack tip defect position makes the matrix display an obvious embrittlement tendency.For N-T specimens,the obvious increase in residual twins at the crack edge can be attributed to the comprehensive effects of the enhanced twinning driving force and the suppressed detwinning behaviors.
(5) Owing to the combined effect of hydrogen-induced cracking and anodic dissolution,the FCG rate of specimens in PBS is greatly higher than that in air.Since the crack tips are always in the early corrosion stage under the influence of cyclic loading.The similar corrosion rates in this stage lead to similar stress corrosion cracking performance of two oriented specimens,which dominates the total corrosion FCG rate.Therefore,specimens with different orientations display close FCG rates in PBS.
Declaration of competing interest
The authors declare that they have no known competing financial interests or personal relationships that could have appeared to influence the work reported in this paper.
Acknowledgments
This study was sponsored by the National Natural Science Foundation of China (Nos.52175143 and 51571150)
杂志排行
Journal of Magnesium and Alloys的其它文章
- A comprehensive review on the processing-property relationships of laser strengthened magnesium
- Recent advances in electrochemical performance of Mg-based electrochemical energy storage materials in supercapacitors: Enhancement and mechanism
- Peri-implant gas accumulation in response to magnesium-based musculoskeletal biomaterials: Reframing current evidence for preclinical research and clinical evaluation
- Influence of laser parameters on the microstructures and surface properties in laser surface modification of biomedical magnesium alloys
- Experimental and simulation research on hollow AZ31 magnesium alloy three-channel joint by hot extrusion forming with sand mandrel
- Mg/MgO interfaces as efficient hydrogen evolution cathodes causing accelerated corrosion of additive manufactured Mg alloys: A DFT analysis
