Correlation of work function and stacking fault energy through Kelvin probe force microscopy and nanohardness in dilute α-magnesium
2024-04-18YiitAliArslanKayasyinAyinJiangPngSrvtTuran
Yiğit Tür ,Ali Arslan Kaya ,Hüsyin Ayin ,Jiang Png ,Srvt Turan
a Eskisehir Technical University, Porsuk Vocational School, Electronics and Automation Department, Program of Mechatronics, Eskisehir, Turkey
b Mugla Sitki Kocman University, Engineering Faculty, Metallurgy and Materials Engineering Department, Mugla, Turkey
c Hüseying Aydın, TUBITAK MRC, Turkey
d Jiang Peng, Chongqing University, China
e Eskisehir Technical University, Engineering Faculty, Materials Science and Engineering Department, Eskisehir, Turkey
Abstract Electronic interactions of the Group 2A elements with magnesium have been studied through the dilute solid solutions in binary Mg-Ca,Mg-Sr and Mg-Ba systems.This investigation incorporated the difference in the ‘Work Function’ (ΔWF) measured via Kelvin Probe Force Microscopy (KPFM),as a property directly affected by interatomic bond types,i.e.the electronic structure,nanoindentation measurements,and Stacking Fault Energy values reported in the literature.It was shown that the nano-hardness of the solid-solution α-Mg phase changed in the order of Mg-Ca>Mg-Sr>Mg-Ba.Thus,it was shown,by also considering the nano-hardness levels,that SFE of a solid-solution is closely correlated with its ‘Work Function’ level.Nano-hardness measurements on the eutectics and ΔWF difference between eutectic phases enabled an assessment of the relative bond strength and the pertinent electronic structures of the eutectics in the three alloys.Correlation with ΔWF and at least qualitative verification of those computed SFE values with some experimental measurement techniques were considered important as those computational methods are based on zero Kelvin degree,relatively simple atomic models and a number of assumptions.As asserted by this investigation,if the results of measurement techniques can be qualitatively correlated with those of the computational methods,it can be possible to evaluate the electronic structures in alloys,starting from binary systems,going to ternary and then multi-elemental systems.Our investigation has shown that such a qualitative correlation is possible.After all,the SFE values are not treated as absolute values but rather become essential in comparative investigations when assessing the influences of alloying elements at a fundamental level,that is,free electron density distributions.Our study indicated that the principles of ‘electronic metallurgy’ in developing multi-elemental alloy systems can be followed via practical experimental methods,i.e. ΔWF measurements using KPFM and nanoindentation.
Keywords: Mg alloys;Dilute alloys;Work function;Stacking fault energy;Kelvin probe force microscopy;Short range order;Miedema;Nanoindentation;Eutectics.
1.Introduction
The changes introduced by a solute element need be understood by considering the correct atomic model,i.e.electron cloud (soft ball concept) model and Wigner-Seitz atomic unit shapes [1–3],and as an extension of this,the fact that stacking faults energy (SFE) levels are different for different crystal planes and directions as presented by theab initiotechniques [4–6].The influence of a solute atom need not be uniform on all crystal planes and directions of the host.Therefore,owing to the already different intrinsic SFE levels in pure Mg,different alloying elements in solid solution,as presented in the literature,can change the SFE levels differently for the critical basal,prismatic,pyramidal and twin planes of Mg,leading to interesting results.However,the difficulties involved in measuring SFEs so specifically are obvious.Therefore,until the last two decades or so,conventional approaches prevailed in designing alloy compositions.However,thanks to theab initiocalculations,metallurgical and materials community is now facing a new concept that has been aptly termed as ‘electronic metallurgy’ [7].
This new approach is fundamental and is based on the atomic-level free electron density distribution of metallic materials.For many alloy systems,SFE values have been obtained for simple atomic models of solid solutions,using sophisticated computer calculations,involving many assumptions and approximations based on quantum physics theories[8–15].Therefore,in order to understand whether the obtained SFEs,which are indicator values on material properties at a fundamental level,really work in more realistic conditions,it is important to confirm with other method(s) that are more practical and can be performed on real materials.The dilute solid solutions thus become an interesting target.
It should also be particularly emphasized that dilute alloy systems have an insufficiently explored potential in offering very interesting engineering properties as can be understood from the apparent proliferation of published work on dilute Mg alloys [16–21].Since HCP crystal system of Mg hosts slip and twinning systems that are activated by a relatively large span of critical resolved shear stress (CRSS) levels as well as temperatures,the potential via affecting the SFE levels of specific crystal planes through alloying elements seems obvious [22–25].Needless to say,that such an exploration requires an understanding of the SFE changes that occur in binary as well as multi-element solid solution alloys of Mg.When it comes to the binary systems theab initiocalculations have already provided invaluable knowledge in term of SFE changes on specific planes due to a particular solute element[26–29].On the other hand,our attempts to correlate WF measurements to the changes in SFE levels,can offer a practical experimental methodology in building an understanding on the influence of multiple element additions in particularly the dilute solid solution systems of Mg as well as for alloys of other metals.
Group 2A elements offer an interesting opportunity to observe the effects of alloying on Mg in that both differences in atomic size and,although little,electronegativity with Mg increases in the order of Ca,Sr,Ba.Furthermore,all three of Mg-Ca,Mg-Sr and Mg-Ba systems also present extremely low solubility levels in Mg,and thus creating an additional opportunity to study very dilute solid solutions of Mg.Among these three binary systems,Mg-Ba system constitutes,if any solubility at all,arguably the most diluteα-Mg at room temperature according to the available binary Mg-Ba phase diagrams in literature.
According to the Miedema’s approach,the terminal solid solutions (partial solubility regions),when present together with intermetallic phases in binary equilibrium diagrams,should be interpreted from a different perspective.Such terminal solubility regions strongly indicate the tendency to form‘short range order’ (SRO),where B-B bonds of the solute becomes unfavorable in an A-B binary system,especially if it is a dilute solid solution [30,31].According to Miedema’s scheme,all three alloying elements studied here,namely Ca,Sr and Ba,are located in the lower quarter in theΦ∗versusΔnWSdiagram (see [32]).This region in the Miedema’s plot corresponds to electron hybridization between the host Mg and the subject alloying element[33].In the original Miedema plot,Ba and arguably Sr lie on the line that indicates,if not 100%,very high solubility levels.However,it is now known via calculated equilibrium diagrams that the Mg-(Ba,Sr) systems are intermetallic forming systems.Since some allowance can be made to slight changes in the then known values forΦ∗and nwsat the time of 1973 papers by Miedema,we may safely conclude now that both Ba and Sr falls to the lower quarter of theΦ∗-nwsplot in the Miedema’s scheme.In fact,in a more recent paper by Abaspour and Cáceres [32],Ba and Sr were indeed positioned somewhat below the 100%solubility line.Such a shift in their relative position would categorize these elements among those that form hybridized bonds with Mg,which in turn leads to formation of SRO at least in their dilute solid solutions with Mg [33],meaning that strong Mg-X bonds are favored rather than X-X type neighborhood (X: Ca,Sr or Ba).
Zhang et.al [34]reported two plots,one SFE versus 1st ionization energy and another SFE versus atomic radii,for Mg-X binary systems based on first principles calculations.The elements of concern,i.e.Ca,Sr and Ba,fall into the lower left (lower SFE and lower 1st ionization energy quarter),and lower right (lower SFE and higher atomic radii quarter) corners in the two graphs by Zhang et.al.,respectively.Those two plots,as in Miedema’s scheme,provide a tool for evaluating the effects of alloying elements geometrically by providing four regions in each graph.If the relationship was to be explored between the schemes of Miedema and Zhang,it was noticeable that the elements in the lower left corner of the SFE-1st Ionization Energy plot fall into the upper and lower (north and south) sectors of the Miedema plot,together which represent covalency in bonding between Mg and the alloying element concerned.On the other hand,the elements in the lower left quarter in the SFE versus Atomic radii plot by Zhang et.al.fall into the upper sector of the Miedema’s plot,while the elements in the lower right corner are located in the lower sector in the Miedema’s graph.The upper sector in Miedema’s scheme corresponds to the case where atomic size change is dominant and no hybridization between the electron orbitals is noticed,while the lower sector indicates hybridization [33].Admittedly there are a few elements,namely Ti,Hf and Zr that does not fit into this comparison but the trend is overwhelming,and the reasons for these misfiting elements is beyond the purpose of our study.
WF indicates how strongly electrons are bound in the crystal lattice,and thus,not independent of the general distribution of free electrons in the system.Since added elements would either act as electron donors or electron receivers the electronic polarities in the solid solution necessarily changes,which in turn would be reflected by the changes in WF.On the other hand,SFE is fundamentally related to the free electron density distribution locally.When the crystal system alters from the original,i.e.from HCP to FCC,or vice versa,due to the presence of a stacking fault,the faulted region locally attains a different level of free energy,that is SFE,which is higher than that of a perfect crystal but lower than that of a full dislocation instead of partials replacing it.Although SFE is local,it is not independent of the overall free electron density distribution in the system.Therefore,it is reasonable to conclude that SFE become correlated with WF.Creation of a stacking fault has to be achieved against the bond energy locally which can be interpreted as an indication of WF.A corollary of this view is that,if WF is higher a stacking fault created would also go in parallel and increase the free energy of the crystal locally,generally in parallel to WF.
This study,has been undertaken in an attempt to observe whether or not a correlative examination of the results of two measurement techniques,i.e.work function (WF) measurements via KPFM (Kelvin Probe Force Microscopy),which is strictly related to SFE,and nanoindentation measurements,can be made and interpreted by also considering the existing relevant SFE data in the literature.
Having this point of view in this study,the relative WF values,which should change in parallel with SFE values in Mg-(Ca,Sr,Ba) binary alloy systems,were determined at room temperature via KPFM method.The WF data and nanoindentation measurements on the selected binary alloys were evaluated together with the calculated SFE data gathered from the literature,and the qualitative relationships among them have been revealed.
2.Materials and method
In this study,binary alloys of Mg with three other Group 2A elements,namely Ca,Sr and Ba were studied.The cast binary alloys had the nominal compositions of Mg-15 wt.%Ca(20.66 at.%),Mg-25 wt.%Sr(6.53 at.%)and Mg-10 wt.%Ba (1.85 at.%) were studied in as-cast condition.
The chemical compositions were determined via XRF (Xray Fluorescence spectrometry-Shimadzu,XRF1800) and ICP-OES (Inductively Coupled Plasma Optical Emission Spectrometer-PerkinElmer Optima 8000) methods.Since both methods gave consistent results,only the XRF results have been given in Table 1.

Table 1 XRF test results of the three alloys studied.All figures are in wt.%.
The samples were metallographically prepared using the conventional methods and etched using an etchant of picric acid-ethanol solution for light microscopy.SEM-EDX examinations of these samples (Supra 50VP-Oxford Instruments,INCA Energy) were performed.The surface preparations were done in an ion milling device (GATAN) prior to the KPFM analysis.The surface quality achieved by this ion milling is evident in the AFM image given in Fig.1.As can be seen,the surface terraces and protrusions were removed successfully for reliable measurements via AFM in KPFM mode.KPFM (NanoMagnetic-hpAFM) measurements were made with a PtIr5coated PointProbe®cantilever and the AC Amplitude (Vpp) parameter was set as -0.3 mV.In order to evaluate the correlation between the SFE and WF values determined via KPFM the reported SFE values in the literature based onab initiocalculations were employed.Nanoindentation tests were conducted by employing a Berkovich pryramidal diamond indenter on a Bruker-Hysitron TI 950 Triboindenter equipment.

Fig.1.Effect of ion milling on sample surface (a) before,(b) after.
3.Results and discussion
The solubilities of Ca,Sr and Ba in Mg can be assessed by examining the calculated phase diagrams reported in the literature[35–37].The reader is referred to the relevant binary phase diagrams available in the literature which have not been given here in order to save space.According to the reported equilibrium diagrams Ca has the highest yet rather low solubility (about 1.3 wt.%) at the eutectic temperature,while Sr has an even lower solubility(about 0.11 wt.%),and Ba apparently zero solubility at their respective eutectic temperatures.It should also be born in mind,as an important parameter in our discussion,that the electronegativity differences for each of the subject alloying elements with Mg is in the order of Ba>Sr>Ca.Although the electronegativity differences with Mg are not very high for any of these three elements,the equilibrium diagrams indicate that sufficient electronegativity differences exist in all three systems to the extent that they all involve intermetallic compound formations rather than significant solubility levels.
The images obtained via light microscopy study on the Mg -(Sr,Ba,Ca) alloys have been given in Fig 2.The microstructure of the Mg-Sr alloy given in Fig.2(a) differs from the other two alloys (Fig.2(b-c)).Mg-Sr alloy consists of coarse-grained intermetallics (Mg17Sr2) and eutectic regions between them.α-Mg,a component of the eutectic structure,is likely to be an extremely dilute solid solution due to the extremely limited solubility at high temperatures according to the equilibrium diagram.The small dendritic formations amidst the eutectic structures are conspicuous only in the microstructures of Mg-Ba and Mg-Ca alloys.

Fig.2.Light microscope images of the alloys: (a) Mg-Ca,(b) Mg-Sr and (c) Mg-Ba.
We can conclude that these dendrites are theα-Mg phase by referring to the respective equilibrium diagrams.Due to the lack of solubility of Ba in Mg according to the calculated Mg-Ba equilibrium diagram,the dendritic islets seen in this alloy have to be considered as pureα-Mg.When considering the Mg-Ca system,where a limited solubility exists,the dendritic islets seen in this alloy were characterized as diluteα-Mg phase containing some Ca.Thus,theα-Mg constituent of the eutectic morphology should also be a dilute solid solution due to the limited solubility.The rest of the microstructure consists of intermetallic compounds,Mg17Ba2in Mg-Ba,and Mg2Ca in Mg-Ca alloys and eutectic structures formed by these intermetallics andα-Mg.
SEM research on the alloys was carried out using BSE and EDS detectors.SEM composition images and chemical analysis results are given in Figs.3–5.Since the alloying elements are below the detection limit of EDS system,α-Mg regions appears to be purely magnesium in these SEM-EDS figures.As expected,the general compositions obtained by selecting relatively large areas for analysis do not necessarily match the general alloy compositions generally.However,they have been given as indicative values.

Fig.3.SEM-BSE images of the Mg-Ca alloy and EDS analysis from the indicated regions.

Fig.4.SEM-BSE images of the Mg-Sr alloy and EDS analysis from the indicated regions.

Fig.5.SEM-BSE images of the Mg-Ba alloy and EDS analysis from the indicated regions.
3.1. KPFM measurements
WF measurements on the eutectic regions of Mg-Ca,Mg-Sr and Mg-Ba alloys were determined via KPFM study.It should be noted that WF measurements via KPFM give the relative difficulty in extracting electrons between neighboring regions,rather than absolute WF values.Therefore,the WF measurements must be regarded asΔWF where the difference is due to the phases involved in the KPFM scan area.TheΔWF values can be taken to indicate the relative bonds with which electrons are tied to the respective phases.
The WF maps covering both the intermetallic andα-Mg phase constituents within the eutectics of each alloy system,and the WF differences across three lines in each as indicated in those maps,which transverse several lamella of the eutectics,have been given in Figs.6–8.In addition,a comparative analysis results have been given in Table 2 in terms of maximumΔWF together with their averages.When a KPFM WF map is examined,the presence of light and dark areas can be seen.It should be noted that the brighter the area,the higher the work function value is.In other words,brightness increases as the energy needed to remove an electron from the surface increases.For the alloys studied,it was seen that the order of the difference in theΔWF values of the eutectic structures of the studied alloys were in the following order,representing the relative bond strength within the intermetallics of the systems: Mg-Ba>Mg-Sr>Mg-Ca.
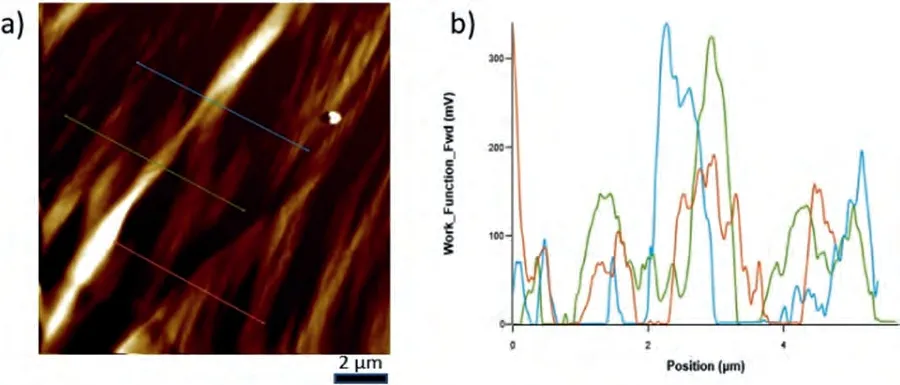
Fig.6.a) ΔWF map on the eutectic of Mg-Ca alloy and b) ΔWF change over the lines shown in the scanned area have also been given as ΔWF-Position plot.Note that the maxima correspond to the intermetallic component of the eutectic and the minima to the α-Mg lamella.
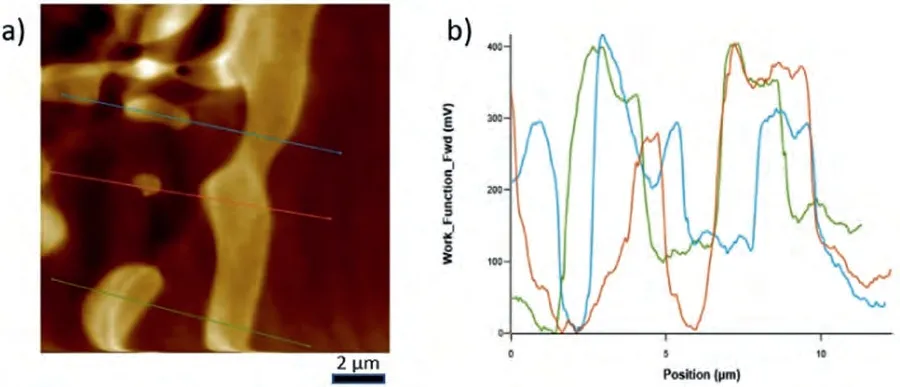
Fig.7.a) ΔWF map on the eutectic of Mg-Sr alloy and b) ΔWF change over the lines shown in the scanned area have also been given as ΔWF-Position plot.Note that the maxima correspond to the intermetallic component of the eutectic and the minima to the α-Mg lamella.
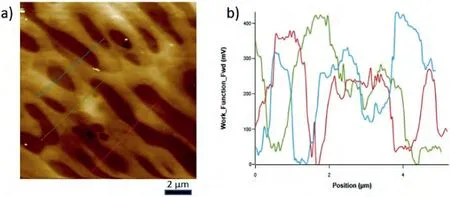
Fig.8.a) ΔWF maps on the eutectic of Mg-Ba alloy and b) ΔWF change over the lines shown in the scanned area have also been given as ΔWF-Position plot.Note that the maxima correspond to the intermetallic component of the eutectic and the minima to the α-Mg lamella.

Table 2 Maximum ΔWF (mV) values and their averages obtained from the eutectic regions.
Although the samples were protected against oxidation in a vacuum chamber after ion milling prior to the measurements,they were exposed to ambient air during transfers and KPFM examinations.The oxides or pollution hills created during this time were visible as bright,tiny specs on the sample surfaces in some cases.Since each sample was exposed to identical conditions,the thickness of the surface oxides and their possible effects were also assumed to be the same.Therefore,it was thought that this effect could be ignored in the comments.Of course,there may be more factors that influence the outcomes.For example,very important concepts such as the crystallographic direction of the grain from which WFs were measured can cause differences in results.However,the aim was to use the data obtained on alloys within the scope of this study as a qualitative comparison tool rather than as absolute values.Therefore,such possible side effects,although thought to exist,were considered identical in each case,and hence ignored.
As discussed earlier,the most basic concept that determines the deformation behavior of metallic materials is the SFE level [27,38,39].The value of SFE can be determined by laborious techniques such as transmission electron microscopy(TEM)or quantum-basedab initiocalculations[40,41].In the study conducted by Zhang et al.,the SFE values calculated for many binary systems viaab initiomethods,in relation to many elements,also including Ca,Sr and Ba.The calculated values from that work have been given for comparison in terms of their efficacy in Table 3 [34],and the effect of each element on the SFE value of the alloy also expressed as a percentage in Table 4 and presented graphically in Fig.9 together with their effects onΔWF of our study.

Fig.9.A comparison of maximum ΔWF measurements from our study with the calculated SFE changes gathered from Ref: [34]for Ba,Ca and Sr elements.(11 at.%: 41 wt.% Ba,17 wt.% Ca and 31 wt.% Sr;and 25 at.%:65 wt.% Ba,35 wt.% Ca and 55 wt.% Sr).

Table 3 SFE values calculated via ab initio method for Mg,Mg-Ba,Mg-Ca and Mg-Sr alloys (data form Ref: [34]).(Monolayer at.% in the model employed in Ref: [34]were 11 and 25 at.%.If converted into weight percentages,these would translate into the following figures: 11at.%: 41 wt.% Ba,17 wt.% Ca and 31 wt.% Sr;and 25 at.%: 65 wt.% Ba,35 wt.% Ca and 55 wt.% Sr).

Table 4 Percent changes in the SFE as compared to that of pure Mg (data from Ref:[34]) (11 at.%: 41 wt.% Ba,17 wt.% Ca and 31 wt.% Sr;and 25 at.%: 65 wt.% Ba,35 wt.% Ca and 55 wt.% Sr).
It should be noted that according to the calculated Mg-Ba equilibrium diagrams,Ba has no solubility in theα-Mg phase.If this is taken as a premise,i.e.α-Mg of the Mg-Ba eutectic was truly pure Mg,then the highestΔWF between the eutectic constituents would naturally be observed in Mg-Ba system as compared to those in Mg-Ca and Mg-Sr eutectics.
Interpretation of the differences in theΔWF levels observed between the eutectic components in the Mg-Ca and Mg-Sr systems,being greater in the case of Mg-Sr,need be more elaborate since we can now be sure of the presence of the alloying element,i.e.Ca or Sr,inα-Mg.
In addition to their effect on SFE,all three alloying elements,judging from their position in the Miedema’s plot,should form short range order (SRO) inα-Mg.This is effectively to say that stronger bonds,as compared to Mg-Mg bonds,are to be formed between Mg and X,and that X-X bonds are not preferred.In this case,theΔWF value betweenα-Mg and the neighboring intermetallic,i.e.the KPFM reading,would decrease (see Fig.9) since the electrons in theα-Mg can be assumed to be more tightly bound when forming stronger Mg-X bonds.
Trace amounts of Sr can be assumed to have remained inα-Mg (it is certain that this value is much lower than that for Ca in Mg,due to the relative solubility levels) will form stronger SRO due to somewhat greater electronegativity difference with Mg as compared to that inα-Mg of Mg-Ca system.However,due to an expectedly higher solute concentration in the case ofα-Mg of Mg-Ca system,the total SRO effect is also stronger.Thus,much lowerΔWF in its eutectic(see Fig.6) as compared to that of Mg-Sr can be reasonably explained.
3.2. Nanoindentation measurements
Fig.10 shows the nanoindentation region,whereα-Mg dendrite islets appear with light contrast,and the darker eutectic region composed ofα-Mg and Mg2Ca intermetallic.The load-depth graphs and the results of two measurements obtained on the marked region have been given in Fig.11 and Table 5.The eutectic region where nanoindentation measurements were made has been shown in Fig.12.The loaddepth profiles have been given in Fig.13.The readings from the eutectic region (Grid 0–5) were given in Table 6,which also includes extra readings (Grid A–E) from another eutectic area.These extra readings,although the region from where they were obtained have not been presented for saving space,were undertaken to increase the accuracy when taking an average from the two-phase mixture,i.e.the eutectic.Whether an individual indentation covers more of theα-Mg or the intermetallic constituent of the eutectic can again be understood due to a great difference in their respective hardness levels.

Fig.10.(a) Light microscope image;and (b) AFM image of a region having α-Mg dendritic islets on which nanoindentation measurements were made in Mg-Ca alloy.A magnified image of one of the nano-indents has been shown as an insert in the upper right corner to ensure confidence on their existence.
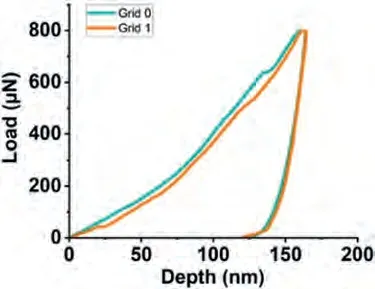
Fig.11.The load-depth graph obtained during the nanoindentation measurements on the α-Mg dendritic islet in the Mg-Ca alloy.
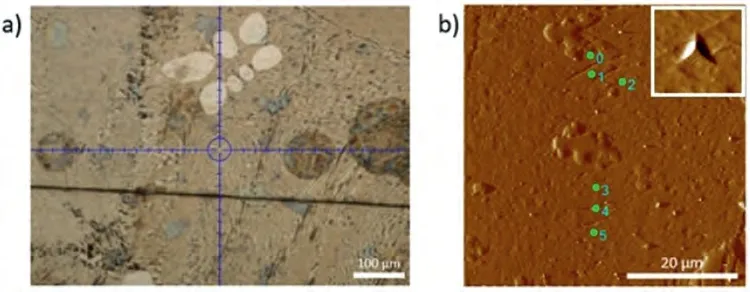
Fig.12.(a) Light microscope image;and (b) AFM image of the eutectic region where the nanoindentation measurements were made on the Mg-Ca alloy.A magnified image of one of the nano-indents has been shown as an insert in the upper right corner to ensure confidence on their existence.
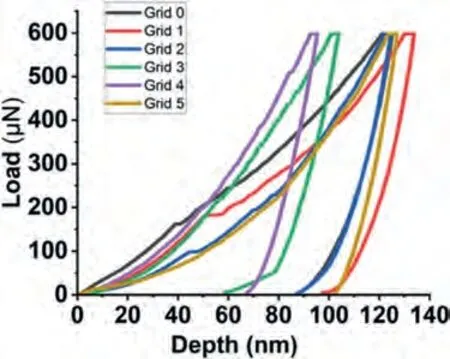
Fig.13.The load-depth graphs obtained during the nanoindentation measurements on the eutectic region of the Mg-Ca alloy.
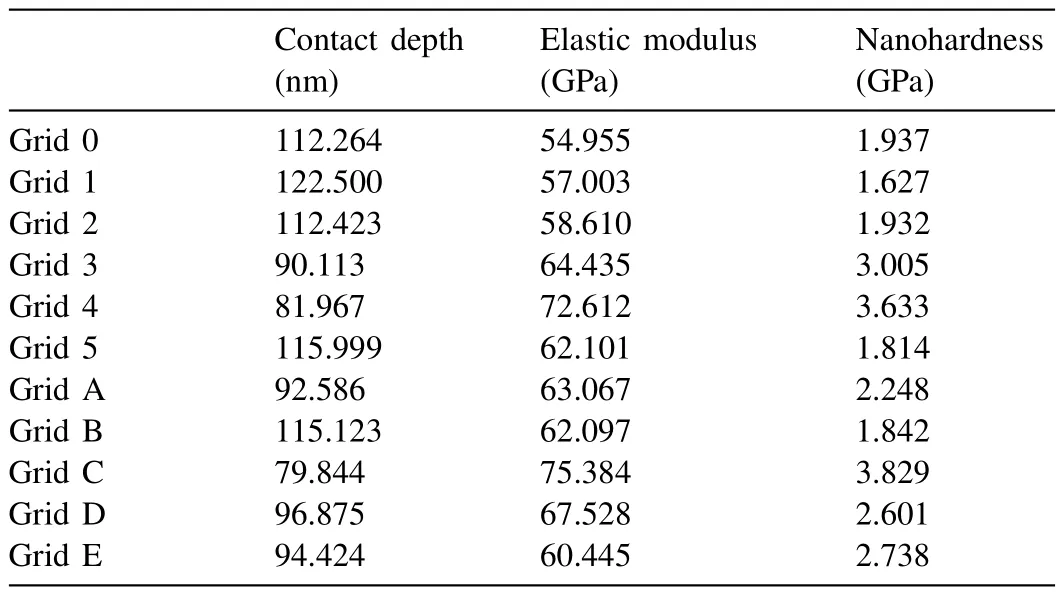
Table 6 Nanoindentation results from the eutectic region in the Mg-Ca alloy (Grid 0,1,2 5: α-Mg,Grid 3,4: intermetallic and Grids A-E: measurements taken from different eutectic regions of the same sample).
Fig.14 shows the nanoindentation region,which is composed ofα-Mg and Mg17Sr2intermetallic with light contrast.The load-depth graphs and the results of seven measurements have been given in Fig.15 and Table 7.Based on the low hardness values,the readings 3 and 4 may be attributed toα-Mg,and the rest to the intermetallic phase Mg17Sr2.
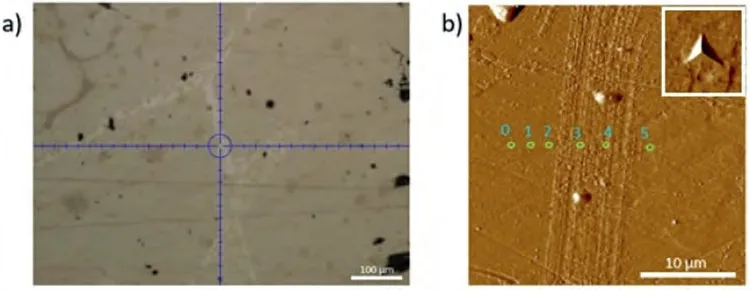
Fig.14.(a) Light microscope image;and (b) AFM image of the eutectic region where the nanoindentation measurements were made on the Mg-Sr alloy.A magnified image of one of the nano-indents has been shown as an insert in the upper right corner to ensure confidence on their existence.
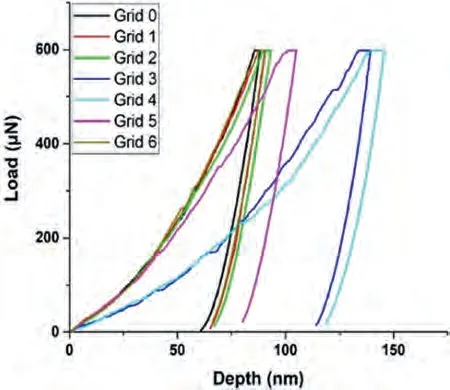
Fig.15.The load-depth graph obtained during the nanoindentation measurements on the eutectic of the Mg-Sr alloy.
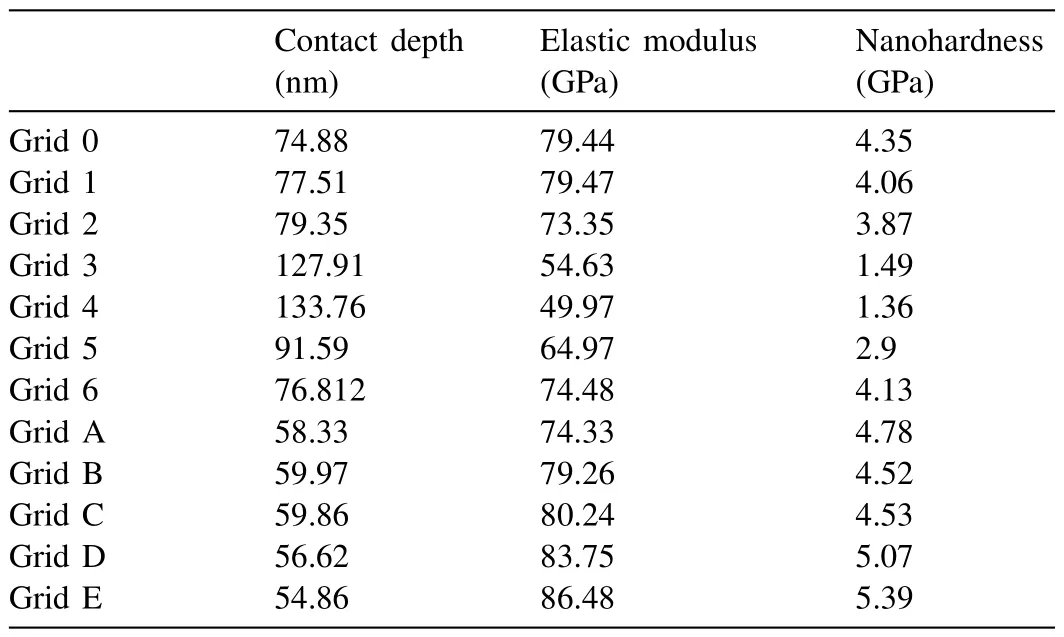
Table 7 Nanoindentation results on Mg-Sr alloy (Grid 3,4: α-Mg,Grid 0,1,2,5,6:intermetallic,Grid A-E: from different region of same sample and coarse intermetallic based measurements).
Fig.16 shows the nanoindentation region whereα-Mg dendritic islets with lighter contrast are present in Mg-Ba alloy.Fig.17 and Table 8 show load-depth graphs and the readings taken fromα-Mg dendritic islets,respectively.Fig.18 shows the nanoindentation region where eutectic structure exists.The readings from the eutectic region (Grid 0–5) shown in Fig.18 are given in Table 9,which also includes extra readings (Grid A-D) from another eutectic area.These extra readings were again undertaken for the purpose of increasing the accuracy of when taking an average value for the eutectic region.The load-depth plots belonging to the measurement area on the eutectic of Mg-Ba have been given in Fig.19.
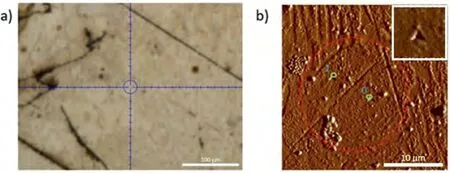
Fig.16.(a) Light microscope image;and (b) AFM image of a region having α-Mg dendritic islets on which nanoindentation measurements were made in Mg-Ba alloy.A magnified image of one of the nano-indents has been shown as an insert in the upper right corner to ensure confidence on their existence.

Fig.17.The load-depth graph obtained during the nanoindentation measurements on the α-Mg dendritic islet in the Mg-Ba alloy.
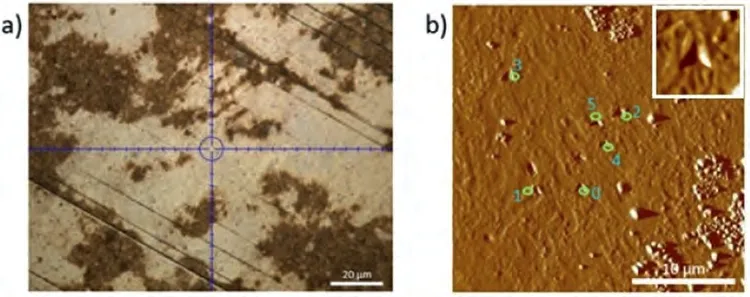
Fig.18.(a) Light microscope image;and (b) AFM image of the eutectic region where the nanoindentation measurements were made on the Mg-Ba alloy.A magnified image of one of the nano-indents has been shown as an insert in the upper right corner to ensure confidence on their existence.
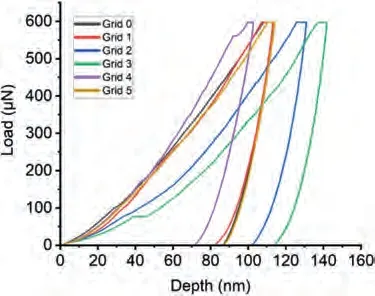
Fig.19.The load-depth graphs obtained during the nanoindentation measurement on the eutectic of Mg-Ba alloy.

Table 8 Nanoindentation test results from the α-Mg dendritic islet in Mg-Ba alloy.
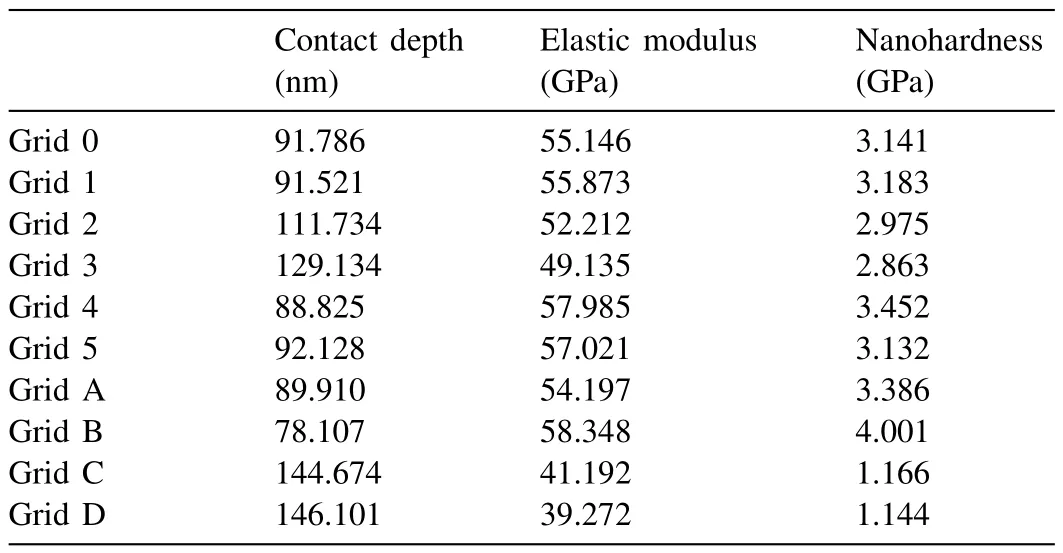
Table 9 Nanoindentation results from the eutectic region in the Mg-Ba alloy(Grids AD: measurements taken from different eutectic regions of the same sample).
The average nanoindentation readings for each region of concern,and the elasticity modulus values for each of the alloys obtained from the same test have been given in Table 10.Calculation of elastic modulus values through nanoindentation measurements are based on the‘Oliver Pharr’approach [42],in which,first the reduced modulus of elasticity is determined.This scheme employs the Poisson’s ratio of pure Mg in calculations.Since the true Poisson’s ratios for these alloys were unknown,it is certain that some error of unknown limit exists in the elastic modulus values expressed in Table 10.Therefore,we refrained from using the elastic modulus values in our interpretations,and instead only employed the nano-hardness results.

Table 10 Average nanohardness values and elastic modulus of eutectic regions and α-Mg phase in each alloy.(Note that values of α-Mg are from the dendritic islets in the case of Mg-Ca and Mg-Ba,and from the α-Mg constituent of the eutectic in Mg-Sr).
The nano-hardness levels ofα-Mg dendritic islets in Mg-Ca and Mg-Ba were 1.39 GPa and 1.16 GPa,respectively.The reported nano-hardness levels for pureα-Mg,depending on the crystallographic orientation,ranges between 0.9–1.2 GPa in the literature [43].Therefore,the nano-hardness level of theα-Mg dendritic islets in Mg-Ba is in agreement with the reported values.
The nano-hardness value of theα-Mg constituent of the eutectic in Mg-Sr alloy was measured to be 1.44 GPa.Since this was higher than that of the pureα-Mg reported in the literature,it may be taken to validate the presence of some Sr in solid-solution.
The 1.39 GPa nano-hardness value ofα-Mg was measured on the dendritic islets in Mg-Ca alloy,which was somewhat lower than that in Mg-Sr alloy.
A comparative assessment of these nano-hardness values ofα-Mg in different systems can be based on the SRO concept.In this perspective,Mg-Ba system presented the lower nanohardness as no solubility of Ba in Mg could be assumed.Whereas,due to slightly larger atomic size and electronegativity differencesα-Mg of Mg-Sr system showed stronger SRO than that in Mg-Ca despite the considerable difference in the solute contents in the two systems [33].As such,this comparison indicates the greater relative importance of atomic size and electronegativity differences collectively against the alloying element concentration.
A critical scrutiny further allows a relative assessment of the strength levels of the eutectic structures in the three alloy systems based on the nano-hardness measurements.Assuming that hardness changes in parallel to the strength,and that melting temperatures are indicative of the relative strength levels for the intermetallic constituent of the eutectics of different systems studied here,the following evaluation may be put forward considering theΔWF and hardness levels ofα-Mg:
If a conventional comparison of the strength levels of the eutectics of the binary Mg-X systems studied can be made based on the respective eutectic temperatures (TMof eutectics are 521 °C in Mg-Ca,585 °C in Mg-Sr,and 634 °C in Mg-Ba) [35–37]and the melting temperatures of their intermetallics.Based on a comparison of melting temperatures of the eutectic structures the relative strength of the mixtures can be referred to in the following order: Mg-Ba>Mg-Sr>Mg-Ca.On the other hand,the melting temperatures of the intermetallics of Mg-Ca,Mg-Sr and Mg-Ba are 711 °C,605 °C and 707 °C,respectively.A conventional comparison of relative strength levels of the intermetallics in the three alloys,thus follows the order Mg-Ca>Mg-Ba>Mg-Sr,the differences among them possibly being small based on their respective melting temperatures.The thicknesses of eutectic lamella appear to be the same.Accordingly,the strength levels of the eutectic structures in each alloy system,can thus be approximated through the ‘rule-of-mixtures’,by also incorporating the strength level of theα-Mg,i.e.the second constituent of the eutectics.α-Mg is a dilute solid solution in the case of Mg-Ca and Mg-Sr,and expected to be pure in the case of Mg-Ba system.In a final assessment,assuming that the phase ratios are equal as the apparent lamella thicknesses are identical,and the relative strengths of the intermetallic components are in the order indicated by their melting temperatures,the only unknown remaining towards comparison of the strength levels of the eutectic portions in these binary systems would be the strength of theα-Mg components.Therefore,if we measure the hardness levels of the eutectic regions in each system we can infer the relative strength levels of theα-Mg components and even relate it to the atomistic nature of this phase.This point of view leads to the following discussions:
The average of nanoindentation measurements taken from the eutectic regions showed that Mg-Ba system with 3.27 GPa possesses the highest value followed by Mg-Sr with 2.96 GPa,and Mg-Ca with 2.47 GPa.If we consider the relatively large difference in Tm of the intermetallics in Mg-Sr and Mg-Ba the higher nanoindentation reading obtained from the eutectic of Mg-Ba is understandable.However,the relatively small difference in nanoindentation readings may deserve some scrutiny due to the relatively large difference between the melting points of the eutectics as well as the intermetallics of these two systems.A reasonable explanation for this observation possibly lies in the fact that theα-Mg component in the eutectic of Mg-Ba system is pure,lacking any strengthening contribution from the alloying element.Whereas,theα-Mg of the eutectic in Mg-Sr has that contribution,and moreover,possesses a SRO based on a theoretical evaluation [16,32,33,44].Therefore,an otherwise would-be a larger difference diminishes,leading to a smaller difference in the nanoindentation readings on the two eutectics.
A counterintuitive and striking difference is observed when the eutectic of Mg-Ca system is compared to the other two in Mg-Sr and Mg-Ba systems.One of the eutectic constituents,Mg2Ca has the highest melting temperature,and the other,α-Mg has the highest amount of solute content to provide strengthening as compared to the eutectics of the other two.Yet,the nanoindentation readings yielded by far the lowest among all three systems.Our interpretation on this point also involves a would-be strong influence in determining the strength level of a eutectic as a two phase mixture,that is the bond strength of the interface betweenα-Mg and Mg2Ca.An evaluation of all aspects of the system points out the possibility of a very low interface strength in the eutectic of Mg-Ca system.This point of view also implicitly asserts that the charge polarity need be low between the intermetallic and solid-solution constituents in the eutectic of Mg-Ca alloy.A further analysis on this explanation finds a strong reasoning in the following evaluation:
Mg2Ca intermetallic phase has the highest melting temperature.This may be taken to indicate that more of the bond-forming electrons have been used in Mg2Ca as compared to the intermetallics of the other two systems,leaving a lower level electronic charge to form bonds with a neighboring phase.Likewise,within theα-Mg the solute element Ca,according to Miedema’s scheme,should be forming SRO rather than a truly random solid-solution.Thus,once again more of the bond forming electrons have been used inα-Mg due to SRO.The net outcome of this electronic state in the two constituents of the eutectic is that a lower eutectic temperature and a lower nanoindentation reading,i.e.a lower strength.
When the average KPFM-WF readings obtained in a perpendicular direction to the lamella of the eutectics in all three alloy systems were compared KPFM (see Fig.20),the above given account of the electronic states can be further supported.The order of Mg-Ba>Mg-Sr>Mg-Ca still preserved in WF differences as in the nano-hardness levels of the eutectic regions.
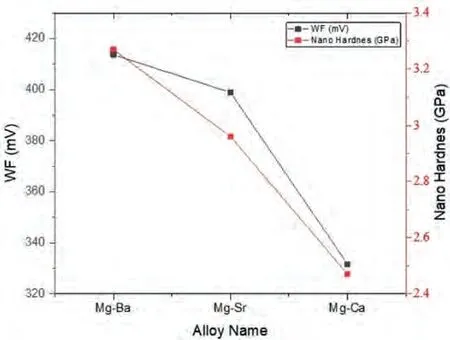
Fig.20.The average ΔWF levels and nano-hardness readings obtained from the eutectic regions of all 3 alloys.
4.Conclusion
KPFM measurements on the solid solution regions and intermetallics showed how alloying elements changed the relative WF levels.The results are in accordance with the reported SFE changes in the alloy systems studied.Therefore,it seems reasonable to suggest that KPFM measurements can also pave the way to interpret the SFE changes in systems that involve more number of elements for which ab initio calculations are difficult or not possible.
It has been revealed that the alloying element which reduces the SFE ofα-Mg the most,creates the greatest relative WF difference with intermetallics in the same structure.As such,the level of this difference can be taken to indicate the bond strength present in the solid-solution phase between Mg and the alloying element atoms.As this strength increases between the host and the alloying element due to the involvement of more electrons from both elements in bond forming,the more difficult it becomes to extract electrons from the solid solution,hence decreasing the difference in WF between this solid-solution phase and the intermetallic of the same structure.
This study showed that KPFM measurements gave reliable results for correlating SFE and WF levels,and that the results can be interpreted in accordance with nanoindentation measurements.
Declaration of competing interest
None.
CRediT authorship contribution statement
Yiğit Türe:Writing– review &editing,Writing– original draft,Visualization,Validation,Methodology,Investigation,Conceptualization.Ali Arslan Kaya:Writing– review &editing,Supervision,Resources,Project administration,Methodology,Funding acquisition,Conceptualization.Hüseyin Aydin:Resources,Investigation,Data curation.Servet Turan:Writing–review&editing,Resources,Project administration,Methodology,Funding acquisition.
Acknowledgements
The authors gratefully acknowledge the financial support for this work provided by Eski¸sehir Technical University Scientific Research Projects Unit with Grant Number 20DRP059.
We also acknowledge the support provided by the Turkish Ministry of Science,Industry and Technology under the SANTEZ Project 0286.STZ.2013–2.
We would like to thank Nanomagnetics Co.for providing the opportunity to conduct KPFM-AFM measurements in their laboratories.
杂志排行
Journal of Magnesium and Alloys的其它文章
- A comprehensive review on the processing-property relationships of laser strengthened magnesium
- Recent advances in electrochemical performance of Mg-based electrochemical energy storage materials in supercapacitors: Enhancement and mechanism
- Peri-implant gas accumulation in response to magnesium-based musculoskeletal biomaterials: Reframing current evidence for preclinical research and clinical evaluation
- Influence of laser parameters on the microstructures and surface properties in laser surface modification of biomedical magnesium alloys
- Experimental and simulation research on hollow AZ31 magnesium alloy three-channel joint by hot extrusion forming with sand mandrel
- Mg/MgO interfaces as efficient hydrogen evolution cathodes causing accelerated corrosion of additive manufactured Mg alloys: A DFT analysis
