Compressive property and energy absorption characteristic of interconnected porous Mg-Zn-Y alloys with adjusting Y addition
2024-04-18LiuLiuWngSunLiuHn
J.A.Liu ,S.J.Liu ,B.Wng ,W.B.Sun ,X.J.Liu ,Z.W.Hn
aCollege of Materials Science and Engineering, Key Laboratory of Automobile Materials (Ministry of Education), Jilin University, Changchun 130022, PR China
b Key Laboratory of Bionic Engineering (Ministry of Education), College of Biological and Agricultural Engineering, Jilin University, Changchun, 130022,PR China
cWeihai Institute for Bionics-Jilin University, Weihai 264205, PR China
Abstract In this study,interconnected porous Mg-2Zn-xY alloys with different phase compositions were prepared by various Y additions (x=0.4,3,and 6 wt.%) to adjust the compressive properties and energy absorption characteristics.Several characterization methods were then applied to identify the microstructure of the porous Mg-Zn-Y and describe the details of the second phase.Compressive tests were performed at room temperature (RT),200°C,and 300°C to study the impact of the Y addition and testing temperature on the compressive properties of the porous Mg-Zn-Y.The experimental results showed that a high Y content promotes a microstructure refinement and increases the volume fraction of the second phase.When the Y content increases,different Mg-Zn-Y ternary phases appear: I-phase (Mg3Zn6Y),W-phase(Mg3Zn3Y2),and LPSO phase (Mg12ZnY).When the Y content ranges between 0.4% and 6%,the compressive strength increases from 6.30 MPa to 9.23 MPa,and the energy absorption capacity increases from 7.33 MJ/m3 to 10.97 MJ/m3 at RT,which is mainly attributed to the phase composition and volume fraction of the second phase.However,the average energy absorption efficiency is independent of the Y content.In addition,the compressive deformation behaviors of the porous Mg-Zn-Y are altered by the testing temperature.The compressive strength and energy absorption capacity of the porous Mg-Zn-Y decrease due to the softening effect of the high temperature on the struts.The deformation behaviors at different temperatures are finally observed to reflect the failure mechanisms of the struts.
Keywords: Porous magnesium;Rare earth elements;Microstructure;Compressive behavior;Energy absorption characteristic.
1.Introduction
As a special type of metal material,the interconnected porous magnesium alloys,also known as open-cell Mg foams,combine several structural and functional performances,including super-lightweight,high strength-to-weight ratio,good damping,high energy absorption,suitable biocompatibility,and high acoustic absorption [1–3].Therefore,they are applied in the biomedical,building,and transportation industries[4–8].When applied in these fields,the Mg foam should have high mechanical properties under the premise of low density.The compressive property is crucial for the evaluation of the application because porous metals could absorb a large amount of deformation energy under almost constant stress levels in a wide range of strains (approximately 0.5) [5,6,8].However,the porous magnesium has relatively low mechanical properties due to the low strength of the magnesium matrix,which limits its application.To solve this problem,many studies developed high-performance porous magnesium.
Previous studies demonstrated that the compressive properties of the porous Mg can be improved by altering its structural parameters,such as the porosity,pore size,and pore shape [2,4,9].Wang et al.[10]revealed that the high compressive properties can be achieved by refining the grain size of the ɑ-Mg.Yang et al.[11]fabricated Mg-Al alloy foams with varied Al additions.They demonstrated that an enough Al addition is necessary for successful foaming.The Al addition has a clear effect on the strength of the Mg-Al alloy foams [11].These studies showed that the optimization of the microstructure of the Mg matrix (e.g.,composition and constituent phase) is also an effective method for improving the compressive properties of the porous Mg.
Among different methods for optimizing the microstructure,adding rare earth (RE) elements can improve the mechanical properties of the as-cast Mg foams.Li et al.[12]found that the WE43 (Mg-4%Y-3.3%RE) Mg foams have unique biodegradation behavior and limited cytotoxicity,which reveals that the RE elements can provide them appropriate mechanical strength,corrosion resistance,and biocompatibility [12].In our previous study [13],the Gd and Zn elements were used to prepare the porous Mg alloy.The compressive properties of the porous Mg alloy were adjusted by the Gd content due to the presence of the specific second phase.In these porous Mg alloys,the RE elements enhance the mechanical properties by multiple strengthening effects,including grain refinement,precipitation,and solution strengthening.These strengthening effects are similar to that in the bulk Mg alloys.This indicates that the strengthening and toughening methods of porous Mg-RE alloys can be inspired by the high-performance methods of bulk Mg-RE alloys.
The Mg-Zn-Y alloy is a typical high-performance series,which have attracted extensive attention due to their very good mechanical properties at RT and high temperatures [14–18].In the Mg-Zn-Y alloys,a variety of second phases can be formed,including the Mg-Zn binary phase,Iphase (Mg3Zn6Y),W-phase (Mg3Zn3Y2),and LPSO phase(Mg12ZnY),which depends on the Zn/Y atomic ratio and solidification condition[18].These second phases have different strengthening effects on the Mg alloy [19–23].It is reported that the fine LPSO phase effectively enhances the mechanical properties of the Mg alloy due to its high hardness,thermal stability,and coherence withα-Mg [20,21].The strength of the Mg-3.16Y-1.87Zn(wt%)alloy can be clearly improved by nanoscale lamellar structures [20].The quasicrystal I-phase is formed in Mg-xY-6xZn alloys.When the contents of the Iphase increase,the tensile strength of the alloy increases,the elongation first increases and then decreases [22].The lamellar fine W phase effectively hinders the dislocation movement,and provides the as-cast Mg-Y-Zn alloys a high strength [23].
It can be deduced from these study mentioned above that the high-performance porous Mg-Y-Zn could be tailored by specific phase composition through the adjustment of the Zn/Y atomic ratio.However,the related studies are few,and therefore a detailed study is required.In this paper,interconnected porous Mg-Zn-Y (i.e.,open-cell Mg-Zn-Y foam) with different phase compositions were designed and prepared by changing the Y element content.The microstructure evolution of the porous Mg-Zn-Y with Y addition was systematically studied by a series of characterization methods.The morphology and fine structure of the I-phase,W-phase,and LPSO phase were studied in detail.The relationship between the microstructure,phase morphology,and compressive properties was discussed.In addition,the impact of the testing temperature on the compressive deformation behavior and energy absorption characteristics of the interconnected porous Mg-Zn-Y was investigated.This study expands an available path for the development of Mg-Y-Zn foams with very high performance.
2.Materials and methods
2.1. Specimen preparation
In this study,the interconnected porous Mg-Zn-Y was prepared by the pressure infiltration process,which can adjust the pore structure of the Mg-Zn-Y foams [4,9].The pressure infiltration process of the porous Mg-Zn-Y is shown in Fig.1.It mainly includes the following steps: (1) The granular calcium chloride particles,having a size in the range of 2-3 mm,were made into a porous CaCl2preform.(2) Pure Mg ingots,having a purity of 99.5%,were melted in a crucible,and Mg-30Y master alloy and Zn particles,having a purity of 99.5%,were added into molten magnesium under the protection of argon gas.The chemical component design of Mg-Zn-Y foams is presented in Table 1.(3)Magnesium alloy melt was infiltrated into the porous CaCl2preform under constant pressure,and the Mg/CaCl2composites were obtained after solidification.(4) The CaCl2particles were removed from the water solution to leave the open-cell Mg-Zn-Y foams with different Y additions.The mean porosities of the porous Mg-Zn-Y alloys used in this study are 67.51±0.02%.

Fig.1.Schematic diagram of pressure infiltration process.

Table 1 Chemical component design of porous Mg-Zn-Y alloy.
2.2. Characterization
The pore size of porous Mg-Zn-Y was calculated by the Nano Measure digital photography and image analysis software.The microstructures of the porous Mg-Zn-Y were observed using an optical microscope (OM,MDJ-DM320).The second dendrite arm spacing (SDAS) and the volume fraction of the second phase were counted by the OM image software(Nano Measure and Image J).
The phase compositions of the porous Mg-Zn-Y were detected with X-ray diffraction (XRD,Cu-Kα,D/MAX-2500).The microstructure and phase morphology of the porous Mg-Zn-Y were observed by a scanning electron microscope(SEM,ZEISS EVO-18,TESCAN VEGA3) equipped with an X-ray energy-dispersive spectrum analyzer (EDS,OXFORD Model Link-Isis).The SEM samples were selected from foam struts.These foam struts were ground using many abrasive papers.Afterwards,they were mechanically polished and then etched in a mixed acid solution for approximately 12 s.
The details of the microstructure and phase structure were further observed by a transmission electron microscope(TEM,JEOL JEM-2100F).The TEM sample was selected from the foam struts.The foam struts were grinded to make thin foils.These foils were pretreated using the argon ion thinning technique for further TEM observation.
2.3. Compressive test
The porous Mg-Zn-Y alloys were machined into rectangular specimens having a size of almost 2.2×1.5×1.5 cm for compressive tests.According to the ISO-13314 standard[24],quasi-static compressive tests were performed to study the compressive properties of the Mg-Zn-Y foams using an INSTRON-5869 material testing machine equipped with an elevated temperature chamber with a strain rate of 10-3s-1.Compressive tests were conducted at room temperature (RT),200°C,and 300°C.To maintain the reproducibility and reliability of the results,more than three samples were tested at each temperature.In addition,the statistical results are provided to evaluate the compressive properties of the porous Mg.
In order to observe the deformation behavior of the porous Mg-Zn-Y,a digital camera was used to capture the images of the compressive process.These images are provided in the supporting information(cf.Figs.S1,S2,and S3).The fracture morphologies of the foam struts were studied by SEM to explore the failure mechanism of the foam strut.
The compressive properties of the foams were estimated using three parameters: compressive strength (σ∗),energy absorption capacity (W),and average energy absorption efficiency ().The compressive strength is determined as the first peak stress when a stress yield occurs beyond the linearelastic region.Wandare computed as [2,4,5,24]:
whereεis the compressive strain,σmaxis the maximum stress appeared before this strain,andε1is an initial strain on the plateau region of the stress-strain curve.
3.Results and discussions
3.1. Macro morphology
Fig.2 shows the macro morphologies of the porous Mg-Zn-Y alloys.It can be seen that the Mg-Zn-Y foams with different Y contents have the open-cell structure,and adjacent pores are connected by “opening window”.The average pore size of the porous Mg-Zn-Y is 2.81±0.06 mm.
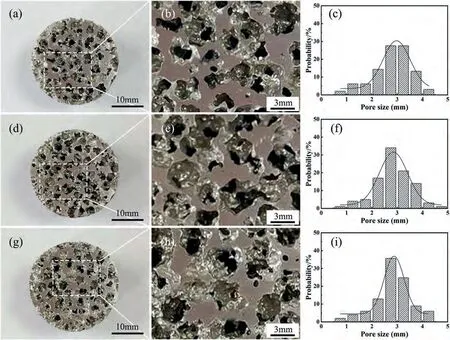
Fig.2.Macro images and pore size distribution of porous Mg-Zn-Y alloys: (a-c) Mg-2Zn-0.4Y;(d-f) Mg-2Zn-3Y;(g-i) Mg-2Zn-6Y.
3.2. Microstructure
Fig.3 shows OM images of the foam struts and the statistical results of the secondary dendrite arm spacing (SDAS).It can be observed from Figs.3(a),(d),and (g) that the microstructures of the porous Mg-Zn-Y alloys are typically dendrite structures.The microstructure of the Mg-2Zn-0.4Y foams mainly containsα-Mg and particle-shape second phase.The microstructure of the Mg-2Zn-3Y foams consists ofα-Mg and a continuous network phase at the grain boundary.As the Y content is 6 wt.%,the lamellar phases are formed at theα-Mg grain boundaries.
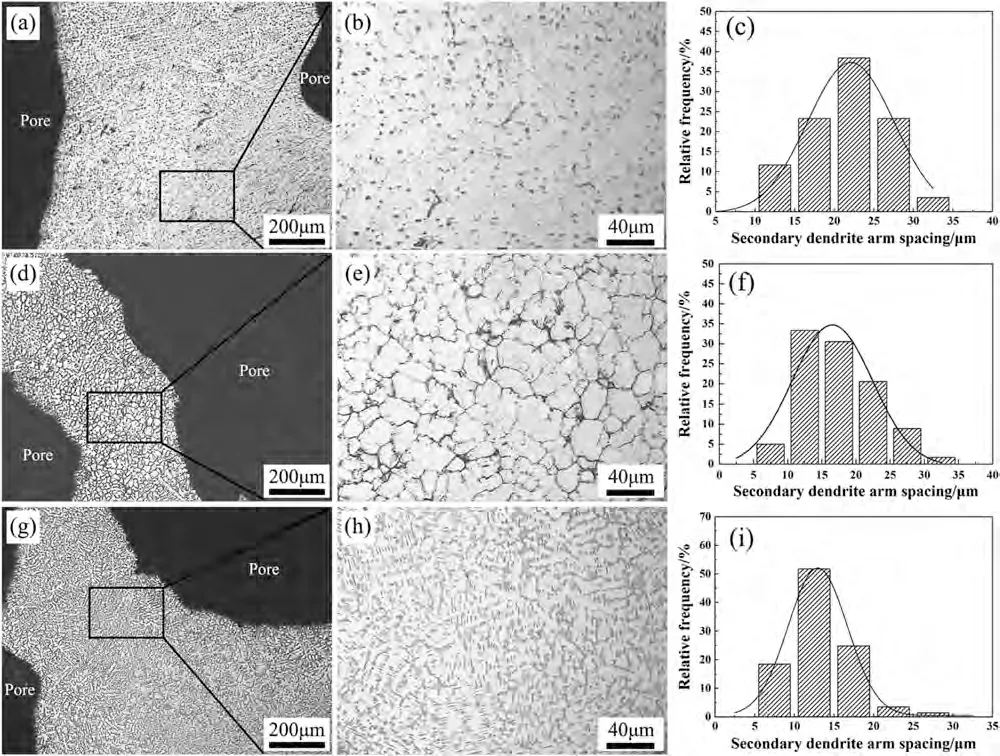
Fig.3.OM images and SDAS of porous Mg-Zn-Y alloys: (a-c) Mg-2Zn-0.4Y;(d-f) Mg-2Zn-3Y;(g-i) Mg-2Zn-6Y.
In addition,it can be seen from Figs.3(c),(f),and (i)that the average SDASs of the Mg-2Zn-0.4Y,Mg-2Zn-3Y,and Mg-2Zn-6Y foams are 21.51±0.13 μm,17.63±0.11 μm,and 13.22±0.07 μm,respectively.This demonstrates that the addition of Y element refines the microstructure of the Mg-Zn-Y foams.It was demonstrated [25]that during the solidification process,Y atoms accumulate at the front of the solid-liquid interface,which results in continuous undercooling.The formation of tiny particles containing Y elements at the front of the solid-liquid interface will hinder the growth of grains.The Y element has a significant refining effect on the microstructure of the magnesium alloy [26].Moreover,the statistical results show that the volume fractions of the second phase in the Mg-2Zn-0.4Y,Mg-2Zn-3Y,and Mg-2Zn-6Y foams are approximately 3.8%,9.4%,and 21.2%,respectively.This indicates that the addition of Y element promotes the formation of the second phase in the Mg-Zn-Y foams.
Fig.4 shows the XRD patterns of porous Mg-Zn-Y alloys with different Y contents.The Mg-2Zn-0.4Y foams are composed ofα-Mg,MgZn2phase,and little I-phase (Mg3Zn6Y).The formation of the I-phase is due to the Y segregation in grain boundary under the condition of non-equilibrium solidification [27].The Mg-2Zn-3Y foams mainly consist ofα-Mg and W-phases.In addition,the Mg-2Zn-6Y foams are mainly composed ofα-Mg and LPSO phases.This indicates that different phase compositions of the foams are presented when different Y contents are added in the foam struts.Previous studies [28,29]reported that when the weight ratio of Zn/Y was reduced from 0.72 to 0.36,the main phase compositions were transformed from the W-phase to the LPSO phase on the Mg-Zn-Y alloy [28,29].This study indicates that the precipitation of each constituent phase in the foams is similar to that in the alloys during solidification.

Fig.4.XRD patterns of porous Mg-Zn-Y alloys.
Figs.5 and 6 show the SEM and TEM images of porous Mg-2Zn-0.4Y alloys,respectively.It can be seen from Figs.5(a-c) that there are plenty of particle-shaped phases having a size of 3-5 μm in the foams.The EDS-A result in Fig.5(d) shows the existence of Y and Zn elements in the particle phase.The TEM images in Figs.6(a) and (b) show that the particle phase is MgZn2(a=0.522 nm and c=0.857 nm) with a hexagonal structure [30].It can be observed from Fig.6(c) that a small number of eutectic phases and the corresponding selected area electron diffraction (SAED) pattern shown in Fig.6(d) are consistent with the multiple fold symmetry characteristics,which clearly illustrates the icosahedral quasicrystalline structure [22,31].

Fig.5.Porous Mg-2Zn-0.4Y alloy: SEM images (a-c);(d) EDS analysis result on point A.

Fig.6.TEM images of second phases in porous Mg-2Zn-0.4Y alloy: (a) MgZn2 phase;(b) SAED pattern of MgZn2 phase;(c) I-phase;(d) SAED pattern of I-phase.
Fig.7 shows the SEM images of porous Mg-2Zn-3Y alloys.The high-magnification SEM images presented in Figs.7(b) and (c) show the continuous network phase at the grain boundaries.The EDS-B analysis demonstrates that the Zn/Y atomic ratio of the continuous network phase is 1.6,which is close to the theoretical ratio of the W-phase (1.5).Figs.8(a) and (b) show the TEM images of the W-phase and its corresponding SAED pattern.These results confirm that the W-phase has an fcc structure with lattice constant(a) of 0.6848 nm [32].The W-phase is in the form of long needle and skeletal shape.The orientation between the Wphase and theα-Mg can be expressed as [001]W//[010]α,(110)W//(0001)α,which is consistent with the result of the study presented in [33].

Fig.7.Porous Mg-2Zn-3Y alloy: (a-c) SEM images;(d) EDS analysis result on point B.
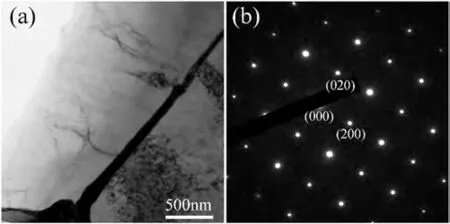
Fig.8.TEM images of second phases in porous Mg-2Zn-3Y alloy: (a) Wphase;(b) SAED pattern of W-phase.
Fig.9 shows the SEM images of porous Mg-2Zn-6Y alloys.The gray lamellar phases having a size in the range of 10-20 μm are formed at grain boundaries,as shown in Figs.9(b) and (c).The EDS-C analysis on the gray lamellar phase indicates that the Zn/Y atomic ratio is 0.86,which is close to the theoretical ratio of the LPSO phase (Zn/Y atomic ratio is 1.0).
Fig.10 shows the TEM image of the lamellar LPSO phase in porous Mg-2Zn-6Y alloy.The corresponding SAED pattern for the zone axis [110]indicates the existence of the LPSO phase.Fig.10(c) shows that the distance between two adjacent weaker spots of the LPSO phase is 1/18 of the distance between the (0000) and (0002) spots of theα-Mg matrix.This denotes the 18R-type LPSO phase.Fig.10(d) shows a high-resolution TEM image of the 18R-LPSO phase along the [110]LPSOdirection.It can be seen that the LPSO structure consists of 18 stacking sequences of ABABABCACACABCBCBC.The lattice constants are estimated as a=0.320 nm and c=4.68 nm for the hexagonal structure [17,34].The LPSO phase is fully coherent with the 2H-typeα-Mg matrix along with the [0001]direction.It has a crystallographic relationship of [110]LPSO//[110]α-Mg,(0001)LPSO//(0001)α-Mgwith theα-Mg matrix.

Fig.10.TEM images of second phases in porous Mg-2Zn-6Y alloy: (a)LPSO phase;(b)SAED pattern of LPSO phase;(c)enlargement of the framed area in (b);(d) high-resolution image of LPSO phase.
3.3. Compressive curves
Fig.11 shows the compressive stress-strain curves of the porous Mg-Zn-Y alloys at different temperatures.All the stress-strain curves have three distinct regions,as mentioned in the studies presented in [3,35]: an initial linear elastic stage,then a wide plateau stage,and a densification stage.The amplitude of the stress fluctuation clearly decreases as the temperature increases from RT to 300°C.It is reported that the stress fluctuation in the plateau stage is caused by the sudden brittle fracture of the foam struts [36,37].Figs.S1,S2,and S3 in the Supporting documents show the different macroscopic deformation behaviors of the porous Mg at different temperatures.It can be observed that the main failure modes are changing from sudden brittle fracture at RT to bending/buckling at high temperature.These results explain the phenomenon of stress fluctuations decrease with the temperature increase.

Fig.11.Stress-strain curves of porous Mg-Zn-Y alloys at different temperatures: (a) at RT;(b) at 200°C;(c) at 300°C.
The compressive strengths of porous Mg-Zn-Y alloys are summarized in Table 2.It can be seen that,when the Y content increases from 0.4 wt.% to 6 wt.% at RT,the compressive strength of the Mg-Zn-Y foams increases from 6.30 MPa to 9.23 MPa.Some studies on the mechanical properties of open-cell Mg foam with porosity ranging from 63% to 68%exist.The compressive strength of the pure Mg foam with 67% porosity is 2.5 MPa [38].The WE43 foams with 64%porosity have a compressive strength of 27.5 MPa[12].When the porosity is 65%,the strength of the AZ31 foam is about 6.25 MPa [4].The Ni/Mg foams with 65% porosity have a compressive strength of 5.01 MPa [39].

Table 2 Compressive strengths at different temperatures.
It can also be deduced from Table 2 that the compressive strength increases with the increase of the Y content at each testing temperature.This is mainly attributed to three aspects: the volume fraction of the second phase (the MgZn2phase,I-phase,W-phase,and LPSO phase),the thermal stability of the second phase,and the morphology of the second phase.The increasing volume fraction of the second phase (Fig.3) is a main factor.More precisely,at room temperature,dislocation slip is the main deformation mechanism,and these second phases considered as strengthening phases can hinder the dislocation slip.During the solidification process,the increasing precipitated phases can hinder the growth of theα-Mg grains,playing a crucial role in grain refinement strengthening.The grain boundary slip(GBS) is a type of plastic deformation of the magnesium alloys [40].At high-temperature (e.g.,300°C),the occurrence of GBS often significantly reduces the magnesium strength.The LPSO phase,W-phase,and I-phase are high-temperature stable phases [18]distributed at grain boundaries (Figs.5,7,and 9).They can stabilize the grain boundaries and hinder their slip,which inhibits the magnesium softening.In addition,the thermal stability of the second phase is a subordinate factor.The melting points of the LPSO phase,Wphase,I-phase,and MgZn2phase in the Mg-Zn-Y alloy are approximately 561,540,419,and 381°C,respectively [18].The thermal stability of those phases follows the following order: LPSO phase>W-phase>I-phase>MgZn2phase.The different phases have different hindering effects on the dislocation slip or/and GBS.When the Y content increases,the volume fraction of the thermally stable phases increases,which enhances the hindrance effect on the GBS.Moreover,the morphology of the second phase is an underlying factor.According to the previous study presented in [22],the lamellar structure of the W phase with small diameter effectively hinders the dislocation movement,which provides a better strengthening effect compared with the block LPSO phase with large diameter.This indicates that the strengthening effect of the second phases is also affected by their morphologies,such as the average diameter and aspect ratio in the Mg-Zn-Y alloy.In this study,there are different morphologies of the precipitated phases with different components.Figs.5 and 6 show that the MgZn2phase is a small particle shape with a hexagonal structure,and the I-phase is along theα-Mg matrix with lamellar eutectic structure.Figs.7 and 8 show that the W-phase is a long needle and skeletal shape with an fcc structure.Figs.9 and 10 show that the LPSO phase is a fine lamellar shape with hexagonal structure.In terms of the morphology of the second phase,the granular shape of the second phase has a better strengthening effect compared with the other shape of the second phase.However,in this study,the strengthening effect is weakened by the low volume fraction.
It can also be seen from Table 2 that the compressive strength decreases with the increase of the testing temperature when the Y element is uniform content.This is mainly due to different deformation mechanisms at different temperatures.When the temperature increases from RT to higher values,the dominant deformation mechanism gradually shifts from dislocation slip to dislocation climb,and then to GBS[41].The gradual enhancement of these softening mechanisms leads to the decrease of the strength and the increase of the plasticity of the foam strut when the temperature increases.As a result,the critical shear stress decreases at high temperatures,which softens the magnesium matrix,leading to the decrease of the strength but the increase of the plasticity.
3.4. Failure characteristic
The macro deformation behavior of the porous Mg alloy at a temperature ranging between RT and 300°C includes the formation of the local deformation band and the expansion of the deformation band,while each contains several pores and foam struts,as shown in Figs.S1,S2,and S3.This local deformation band during compressive deformation was also reported in the study presented in [42].
Fig.12 shows the fracture morphologies of foam struts at RT with a strain of 30%.There are different fracture characteristics in the Mg-Zn-Y foams with different Y contents.Fig.12(c) shows that the fracture surface of Mg-2Zn-0.4Y foams is composed of small dimples,tearing edges,and cleavage steps,which indicates the mixed fracture characteristics.Fig.12(f) shows many cleavage facets,cleavage steps,and a small amount of tearing edges in the fracture surface of the Mg-2Zn-3Y foams,which also indicates the mixed fracture characteristics.Fig.12(i) shows most of the cleavage facets in the fracture surface of the Mg-2Zn-6Y foams,which indicates cleavage fracture characteristics.There are complex factors responsible for the brittleness of the foam strut,including the SDAS,morphology of the second phase,volume fraction of the second phase,and the interface coherent.The large SDAS and coarse second phase first weaken the plasticity of the foam struts.The coarse second phase with a high volume fraction at the grain boundary then aggravates the brittleness of the foam struts.Finally,the interface coherence varies with the phase compositions.The coherent interface between the LPSO phase and theα-Mg matrix is in favor of the coordination ability [19,20].The previous study presented in [43]demonstrated that the semi-coherent interface between the I phase and theα-Mg matrix brings a high interface bonding [43].The semi/in-coherent interface between the W-phase andα-Mg matrix leads to a low bonding strength [44].
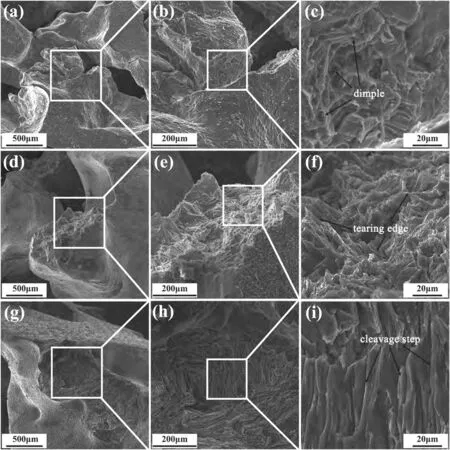
Fig.12.Fracture morphologies of foam struts at RT: (a-c) Mg-2Zn-0.4Y foams;(d-f) Mg-2Zn-3Y foams;(g-i) Mg-2Zn-6Y foams.
Fig.13 shows the fracture morphologies of the foam struts at 200°C.It can be seen from Figs.13(b),(e),and (h) that the fracture characteristics of the three foams are similar.It can be observed from Figs.13(c),(f),and(i)that dimples and tearing edges exist in the fracture surfaces of the three foams,which indicates the mixed fracture characteristics at 200°C.This is due to the fact that when the temperature increases to 200°C,the critical shear stress of the slip system decreases but the number of slip systems increases,which increases the plasticity of the foam struts.

Fig.13.Fracture morphologies of foam struts at 200°C: (a-c) Mg-2Zn-0.4Y foams;(d-f) Mg-2Zn-3Y foams;(g-i) Mg-2Zn-6Y foams.
Fig.14 shows the fracture morphologies of the foam struts at 300°C.It can be observed from Figs.14(a),(d),and (g)that cracks or tears occur at a large deformation strain.However,the complete fracture of the foam struts is less,which results in their higher plasticity at 300°C compared with that at RT.It can be seen from Figs.14(b),(e),and (h) that the fracture characteristics of the three foams are very similar.Dimples and loose oxides are clear in the fracture surface of the three foams,as shown in Figs.14(c),(f),and (i).The results show that the plasticity of the foam strut increases with the increase of the testing temperature,which is consistent with the mechanical response in the stress-strain curve at 300°C.
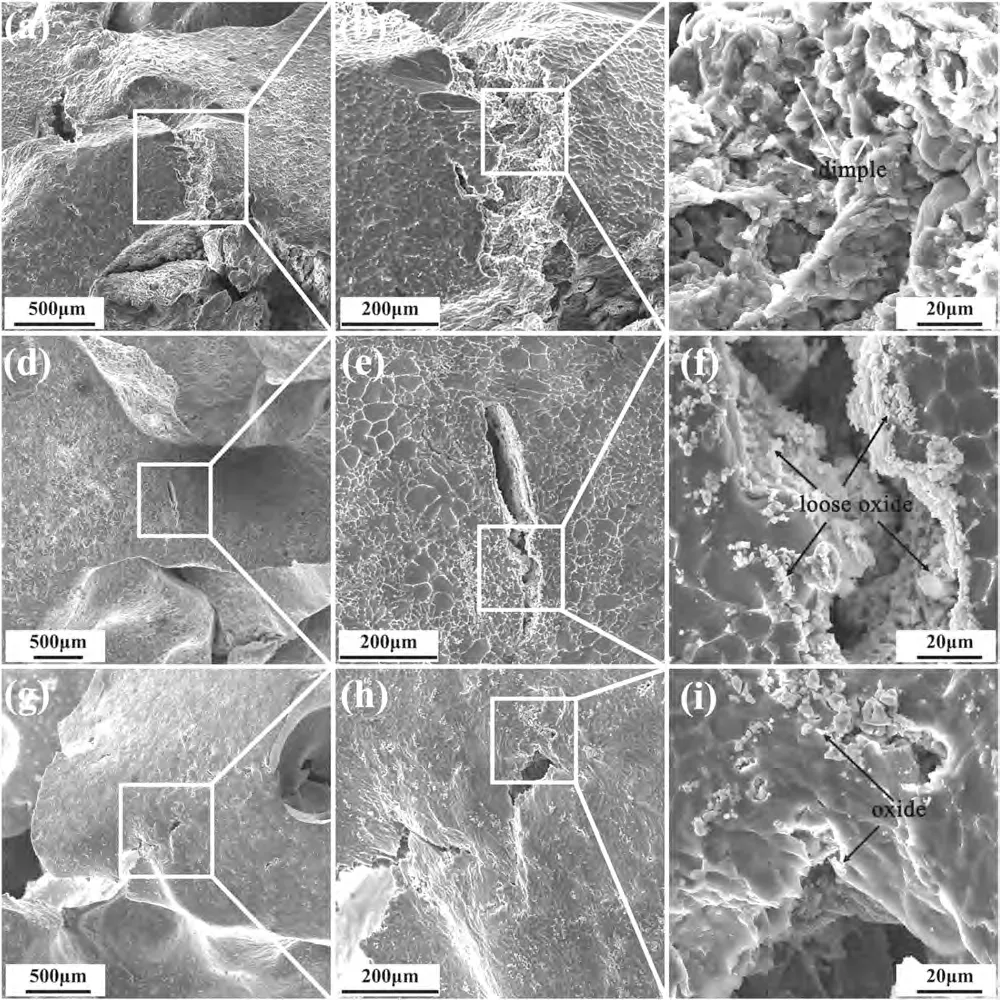
Fig.14.Fracture morphologies of foam struts at 300°C: (a-c) Mg-2Zn-0.4Y foams;(d-f) Mg-2Zn-3Y foams;(g-i) Mg-2Zn-6Y foams.

Fig.15.Energy absorption curves and energy absorption efficiency curves of porous Mg-Zn-Y alloys at different temperatures: (a-b) at RT;(c-d) at 200°C;(e-f) at 300°C.
These results demonstrate that when the temperature increases,different softening mechanisms lead to the increase of the plasticity of the foam strut.This can explain the decrease of the stress fluctuations with the increase of the temperature in the compressive curves.
3.5. Energy absorption characteristics
It can be deduced from the deformation behavior and fracture morphologies of the foam struts that the Mg-Zn-Y foam can dissipate deformation energy by the bending/buckling of the foam strut,the fracture of the foam strut,and the friction between the struts during the compressive deformation.Table 3 presents the energy absorption values of porous Mg-Zn-Y alloys with different Y contents at RT,200°C,and 300°C.Figs.15(a),(c),and (e) show the energy absorption curves of the foams.It can be concluded that the energy absorption capacity decreases with the temperature increase.In addition,at the same testing temperature,the energy absorption capacity increases with the increase of the Y content.Figs.15(b),(d),and (f) show the energy absorption efficiency curves of the foams with different Y contents at RT,200°C,and 300°C.All the curves of the foams have the same trend.The average energy absorption efficiency of the Mg-Zn-Y foam is independent of the Y content.A previous study [45]demonstrated that the energy absorption efficiency of metallic foams does not rely on the relative density,but it is mainly affected by the pore structure.This indicates that the energy absorption capacities of the foams at different temperatures can be improved by the Y content without sacrificing the average energy absorption efficiency.

Table 3 Energy absorption capacities and efficiencies at different temperatures.
4.Conclusion
In this paper,the microstructure evolution,compressive properties,and energy absorption characteristics of porous Mg-Zn-Y alloys with different phase compositions were studied.The following conclusions can be drawn:
1.When the Y content increases,the SDAS of the porous Mg-Zn-Y alloy decreases,but the volume fraction of the second phase increases.The second phases of the Mg-2Zn-0.4Y foams are mainly the MgZn2phase and a small amount of I-phase.The Mg-2Zn-3Y foams are mainly composed ofα-Mg and W-phase.The Mg-2Zn-6Y mainly consists of theα-Mg and the 18R-LPSO phase at grain boundaries.
2.The compressive strength and energy absorption capacity of the porous Mg-Zn-Y alloy depend on the Y content and testing temperature.The Mg-2Zn-6Y foams obtain the highest compressive strength and energy absorption capacity among the experimental foams at all the temperatures due to the high volume fraction of the second phase.However,the average energy absorption efficiency does not depend on the Y content.
3.The foam struts are mainly brittle and fractured at RT.When the temperature increases,the brittleness of the foam struts decreases,causing more bending/buckling and less fracture.As a result,the amplitude of the stress fluctuation in the compressive stress-strain curve clearly decreases with the temperature increase from RT to 300°C.
These results confirm that the Y elements can effectively improve the microstructures and compressive properties of the porous Mg-Zn-Y alloys at different temperatures.In addition,the energy absorption capacities of the foams can be enhanced without sacrificing the average energy absorption efficiency.
Data availability
The raw/processed data required to reproduce these findings cannot be shared at this time due to time limitations.
Declaration of Competing Interest
The authors declare that they have no known competing financial interests or personal relationships that could have appeared to influence the work reported in this paper.
CRediT authorship contribution statement
J.A.Liu:Conceptualization,Writing– original draft.S.J.Liu:Writing– review &editing,Data curation.B.Wang:Conceptualization,Methodology.W.B.Sun:Conceptualization,Methodology.X.J.Liu:Validation,Writing– review &editing.Z.W.Han:Supervision,Resources.
Acknowledgments
This work was supported by “The National Key Research and Development Program of China (No.2018YFA0703300)”,“Science and Technology Project of Education Department of Jilin Province (No.JJKH20231086KJ)”,Development Project of Jilin Province(No.2021C038-4).
Supplementary materials
Supplementary material associated with this article can be found,in the online version,at doi:10.1016/j.jma.2023.06.014.
杂志排行
Journal of Magnesium and Alloys的其它文章
- A comprehensive review on the processing-property relationships of laser strengthened magnesium
- Recent advances in electrochemical performance of Mg-based electrochemical energy storage materials in supercapacitors: Enhancement and mechanism
- Peri-implant gas accumulation in response to magnesium-based musculoskeletal biomaterials: Reframing current evidence for preclinical research and clinical evaluation
- Influence of laser parameters on the microstructures and surface properties in laser surface modification of biomedical magnesium alloys
- Experimental and simulation research on hollow AZ31 magnesium alloy three-channel joint by hot extrusion forming with sand mandrel
- Mg/MgO interfaces as efficient hydrogen evolution cathodes causing accelerated corrosion of additive manufactured Mg alloys: A DFT analysis
