不同波长脉冲LED光源的频率和占空比对植物光合速率和光碳能力的影响
2024-04-13魏伟仝宇欣卢大军林金填陈磊房倩吴优匡宇涵孙铭浩李倩宋金德董贞芬邹军
魏伟 仝宇欣 卢大军 林金填 陈磊 房倩 吴优 匡宇涵 孙铭浩 李倩 宋金德 董贞芬 邹军

收稿日期:2023-08-11;修回日期:2023-09-26。
基金项目:2021年江苏省双创博士项目(JSSCBS20211145);国家重点研发计划项目(2021YFB3501700);内蒙古自治区重点研发计划项目(2022YFDZ0086);上海市“科技创新行动计划”农业科技领域项目(23N21900100);上海市“科技创新行动计划”农业科技领域项目(22N21900400,23N21900100);宿遷市科技项目 (K202234);盐城市重点研发计划项目(YCBE202332)。
* 通信作者:魏伟, 讲师,主要从事植物照明方面的研究。E-mail: weiweipaper@126.com。
Received date: 2023-08-11; Revised date: 2023-09-26.
Foundation items: 2021 Jiangsu Shuangchuang Doctor Project (JSSCBS20211145); National Key Research and Development Plan (2021YFB3501700); Inner Mongolia Autonomous Region Key Research and Development Plan Project (2022YFDZ0086); Shanghai “Science and Technology Innovation Action Plan” Agricultural Science and Technology Field Project (23N21900100); Shanghai “Science and Technology Innovation Action Plan” Agricultural Science and Technology Field Project (22N21900400, 23N21900100); Suqian Science and Technology Project (K202234); Key R&D Plan in Yancheng City (YCBE202332).
* Communication author: WEI Wei, lecturer, mainly engaged in plant lighting research. E-mail: weiweipaper@126.com.
Effects of the Frequency and Duty Cycle of Pulse LED Light Sources with Different Wavelengths on Plant Photosynthetic Rate and Photocarbon Capacity
WEI Wei1*, TONG Yuxin2, LU Dajun3, LIN Jintian5, CHEN Lei5, FANG Qian1, WU You1, KUANG Yuhan1, SUN Minghao1, LI Qian1, SONG Jinde6, DONG Zhenfen7, ZOU Jun4
(1. Yancheng Teachers University, Yancheng 224007, China; 2. Institute of Agricultural Environment and Sustainable Development, Chinese Academy of Agricultural Sciences, Beijing 100081, China; 3. Sinoinnovo Technology Guangdong Company, Dongguan 523000, China; 4. Shanghai Institute of Technology, Shanghai 201418, China; 5. Xuyu Optoelectronics Co., Ltd, Shenzhen 518101, China; 6. Jiangsu Xingjie Technology Co., Ltd, Yancheng 224000, China; 7. Suqian University, Suqian 223600, China)
Abstract: This article analyzes the research progress of pulsed light emitting diode (LED) light sources and aims to produce different wavelength pulse LED light source light panels, and to measure the variation of photosynthetic photon flux density (PPFD) at 25 cm below the lamp panel with the change of wavelength, frequency, and duty cycle of the light source. Under the condition of fixed light source duty cycle, the variation of photosynthetic rate with frequency was studied, and it was found that under different wavelengths, the plant photosynthetic rate had its respective optimized frequency; under the condition of fixed light source frequency, the variation of photosynthetic rate with duty cycle was studied, and it was found that under different duty cycles, the plant photosynthetic rate had its respective optimized duty cycle. Because its PPFD cannot be kept constant with the change of duty cycle and frequency under the condition of fixed frequency or duty cycle, the concept of photocarbon capability is proposed with photocarbon capability=photosynthetic rate?PPFD-1=Pn?PPFD-1, its biological significance is how many carbon dioxide molecules can be stimulated by a photon energy to photosynthesis. Under the condition of fixed light source duty cycle, the variation of photocarbon capacity with frequency change was studied. Each type of light source has a corresponding optimized frequency, corresponding to the maximum photosynthetic rate under this type of light source; each type of light source has a corresponding optimized frequency, corresponding to obtaining the maximum PPFD under this type of light source; each type of light source has a corresponding optimized frequency, which corresponds to the maximum photocarbon capacity under this type of light source. This article proposes a method to measure the corresponding relationship between plant lighting parameters and carbon reduction by proposing light carbon capacity. It is hoped that in the future, optical design can achieve the most economical carbon reduction by optimizing this parameter to obtain the optimal lighting conditions.
Key words: full spectrum; photocarbon capacity; photosynthetic rate; PPFD; pulse light
CLC number: Q945.11 Document code: ADOI:10.3969/j.issn.1007-7146.2024.01.006
摘 要:本文分析了脈冲发光二极管(LED)光源的研究进展,制作了不同波长的脉冲LED光源面板;测量了灯面板下方25 cm处光合光子通量密度(PPFD)随光源波长、频率和占空比的变化;在固定光源工作周期条件下,研究了光合速率随频率的变化,发现在不同波长下,植物光合速率具有最佳频率;在固定光源频率条件下,研究了光合速率随占空比的变化,发现在不同的占空比下,植物的光合速率有其最佳的占空周期;由于在固定频率或固定占空比条件下,其PPFD不能随着占空比和频率的变化而保持恒定,因此提出了光碳能力的概念(光碳能力=光合速率 ? PPFD-1=Pn?PPFD-1,其中Pn为光合速率,其生物学意义是一个光子能量转换多少二氧化碳分子进行光合作用);在固定光源占空比条件下,研究了光碳能力随频率的变化。每种光源,均有对应优化的频率,对应得到此种光源下最大的光合速率;每种光源,均有对应优化的频率,对应得到此种光源下最大的PPFD;每种光源,均有对应优化的频率,对应得到此种光源下最大的光碳能力。本文通过提出光碳能力来衡量植物光照参数与碳减排量之间的对应的关系,希望以后光学设计可以通过优化此参数获得最优化的光照条件来获得最经济的碳减排量。
关键词:全光谱;光碳能力;光合速率;PPFD;脉冲光
中图分类号:Q945.11 文献标志码:ADOI:10.3969/j.issn.1007-7146.2024.01.006
(Acta Laser Biology Sinica, 2024, 33(1): 048-056)
Cultivated land is decreasing annually owing to the increasing global population. To properly feed the global population, the planting area of agriculture facilities is also increasing annually. In 2020, the planting area of greenhouse facilities in China reached 3.7 million hectares, and the total area of facility-based cultivation exceeded 4 million hectares[1]. With the emergence of various technologies to improve LED efficiency [2-5], the electrical power required per unit area of plant lighting is decreasing annually.
Owing to Chinas commitment towards reaching a carbon peak and achieving carbon neutrality, further reducing the power consumption of plant lighting is necessary. Due to the current low efficiency of plants in utilizing sunlight during photosynthesis, the energy consumption of plant lighting fixtures is enormous. In order to better design plant lighting fixtures, it is necessary to establish units between the photosynthesis of plants and the plant lighting lamp, in order to guide the design of future plant lighting fixtures. Studying the relationship between lighting and plant biological parameters is thus essential. Currently, the photosynthetic photon flux density (PPFD) [6-14] is mainly used to measure plant lighting. This unit only measures one optical unit of plant lighting fixtures and cannot measure the relationship between plant lighting and plant biological parameters such as absorbed carbon quantity and other parameters. The only connection between lighting and plant biological parameters is that the unit of light participation in measuring the plant photosynthesis rate is more in accordance with photochemical reactions. Therefore, a new unit for light photocarbon capacity, to measure the number of carbon dioxide molecules transferred by photon energy into the organic mass of plants is proposed in this study. This approach can link the relationship between plant lighting and plant biological parameters.
Currently, plant lighting fixtures include incandescent lamps, fluorescent lamps, high-pressure sodium lamps, halogen lamps, and LED lamps [15-20], all of which use continuous lighting. Traditional light sources adopt continuous illumination because obtaining pulse light sources at a low cost is difficult. LED light sources use continuous illumination because the optimal parameters of LED pulse light sources are still being studied and have not been widely promoted [21-25]. Yu et al[24] showed that high-frequency pulsed LED can improve the photosynthetic rate of plants. Miliauskiene et al[22] shows that pulsed LED lighting significantly promotes lettuce growth in terms of leaf area and fresh and dry weight [22]. Shimada et al[25] determined that pulsed light can improve some bioindicators of plants by more than 30%. They also explored plant cultivation under red and blue light with a phase difference of 180°. However, most of their studies were conducted by measuring different frequencies, different duty cycles, and PPFD. They did not measure the relations between plant lamp parameters and plant organic parameters, and thus, could not measure the numeric value of photon energy converted into organic matter. All the above studies required maintenance of plants for long-term experiments, with a long research cycle, high research costs, and several potentially uncertain factors affecting the experiment. To address these issues, the current study proposes optimization of the optical parameters of pulsed light sources through rapid measurement using a photosynthetic instrument (LI-6400). Therefore, this study utilized pulsed LEDs of different wavelengths to illuminate plants, and evaluated pulse parameters, such as frequency, duty cycle, wavelength for plant photosynthetic rate, and photocarbon parameters (photocarbon capacity=Pn?PPFD-1=photosynthetic rate?PPFD-1, which is how many carbon dioxide molecules can be transferred to plants by a photon). The goal of this research is to obtain optimal lighting parameters for the less power of the plant lighting lamp and absorbing more carbon dioxide, and contribute to ensuring Chinas “carbon peak and carbon neutrality”.
1 Material and methods
This experiment was divided into two parts. The first was to fix the duty cycle and change the frequency, and the second part was to change the duty cycle at the optimal frequency from the previous and subsequent stages. Finally, the optimized light parameters were determined, including the PPFD, photosynthetic rate, and photocarbon capacity.
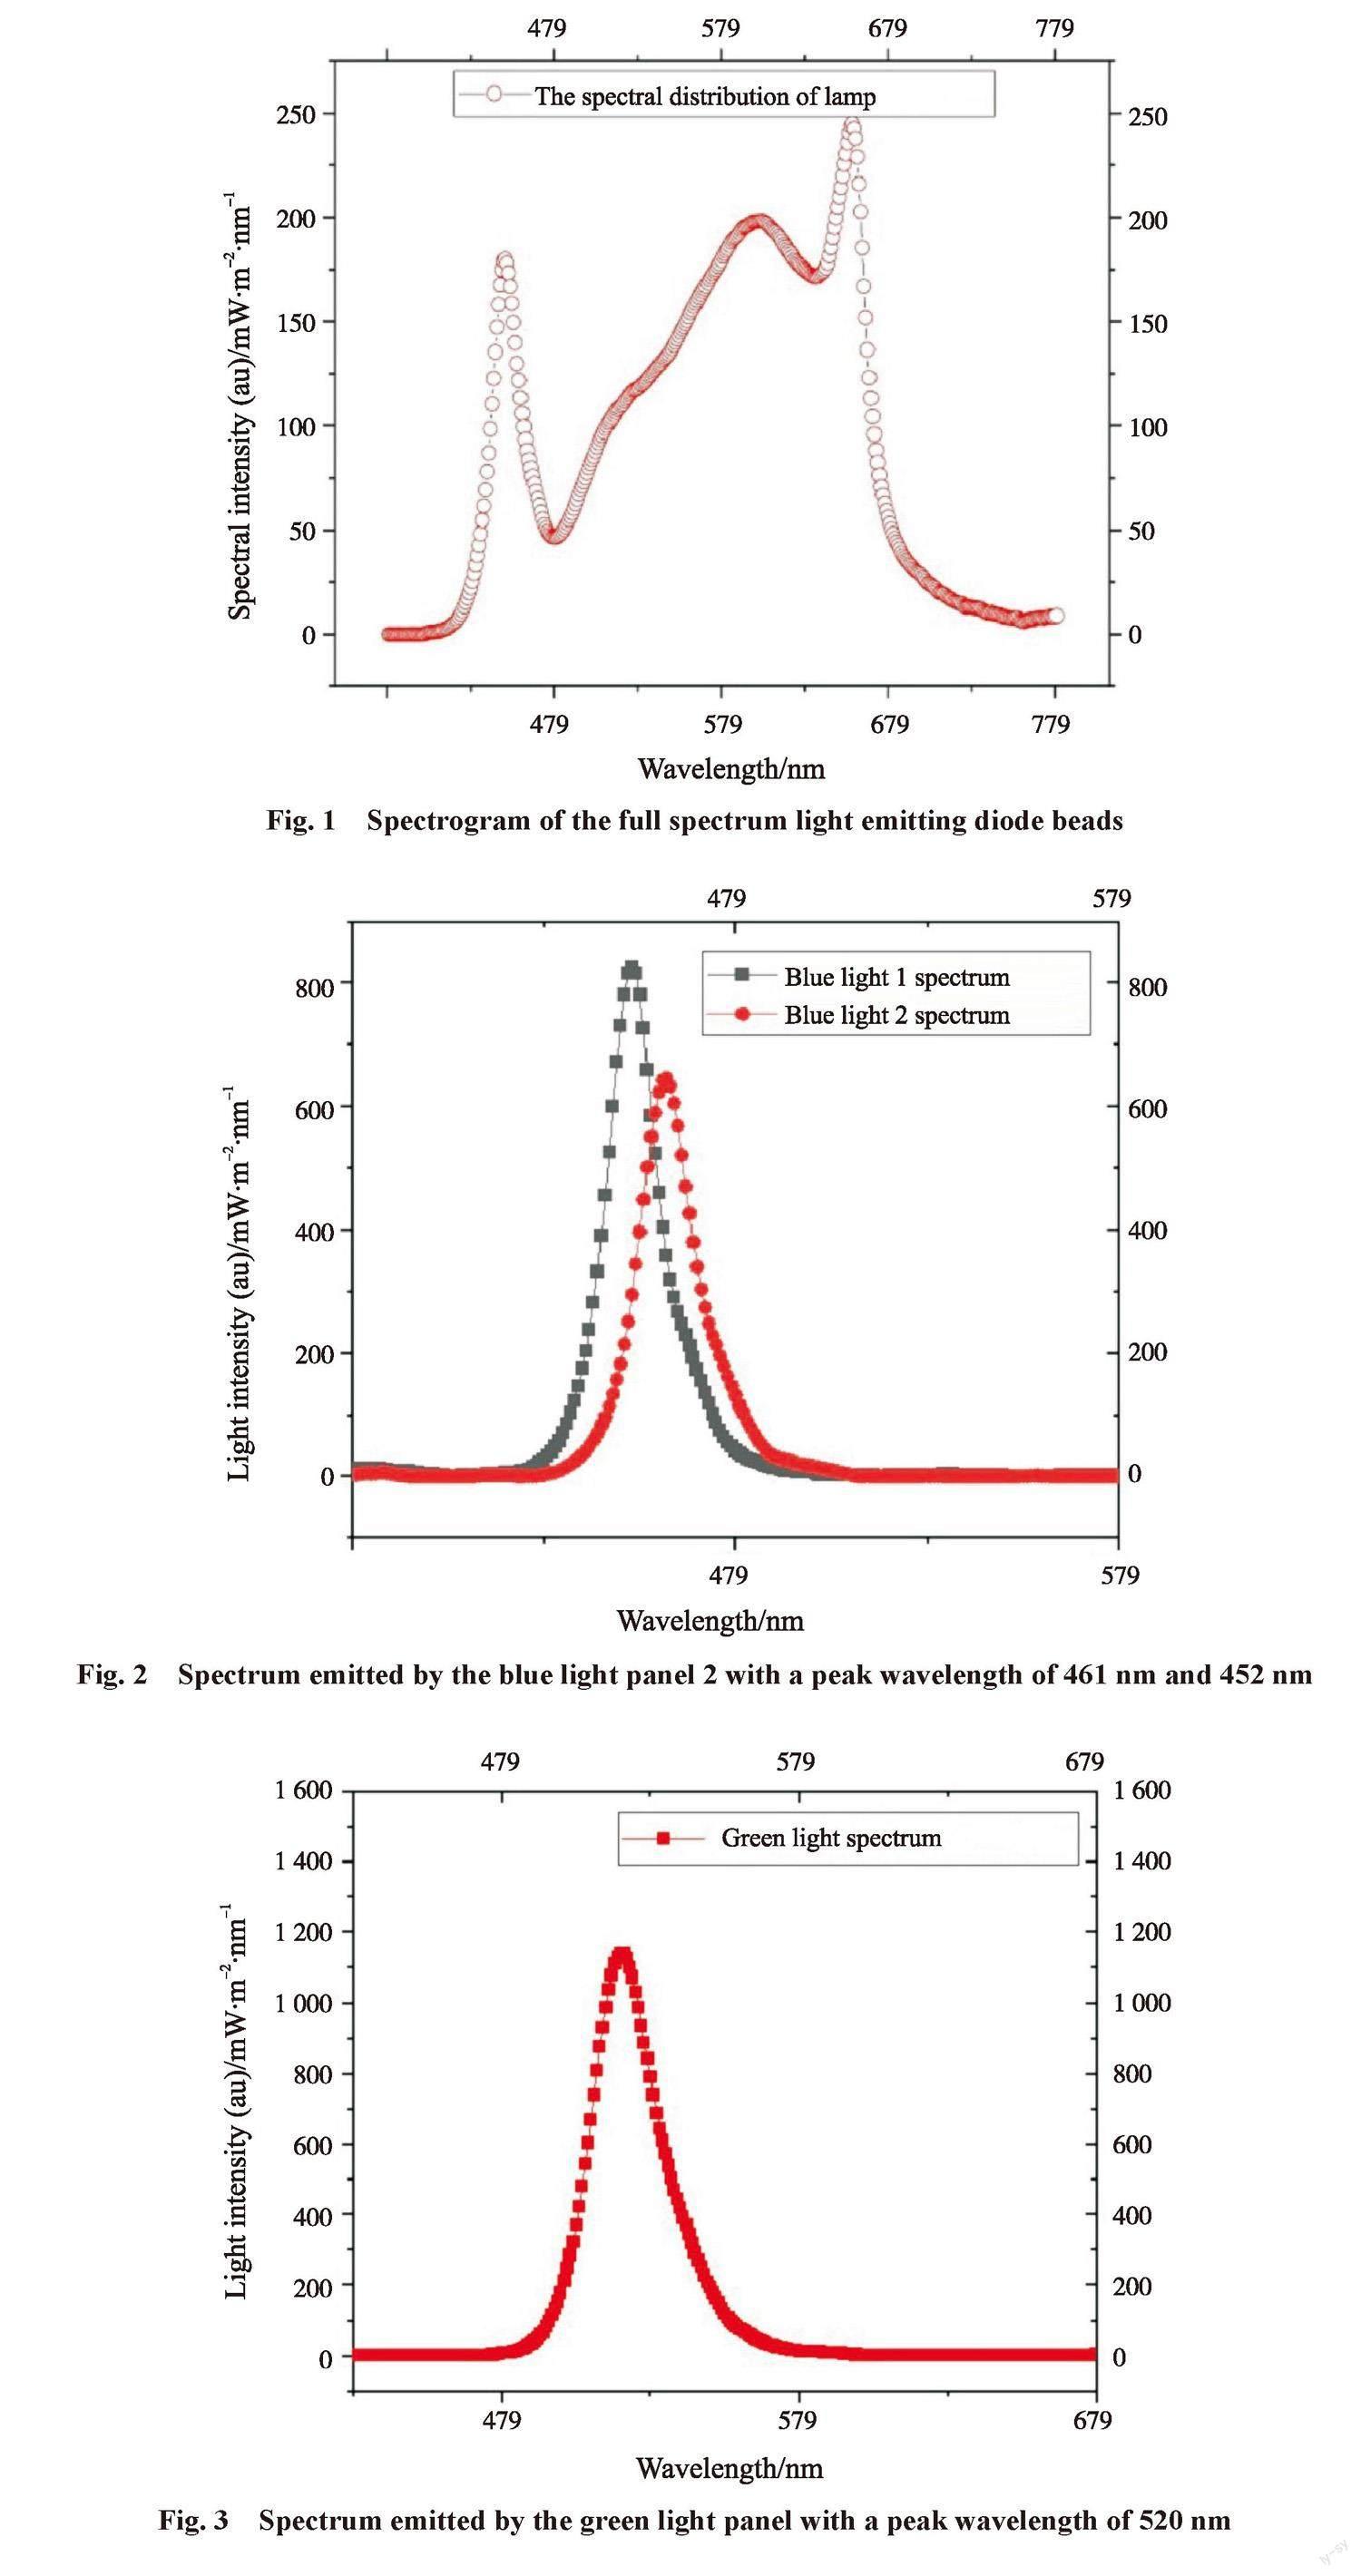
The experimental temperature was 23℃, the carbon dioxide concentration was 600 mg/m3, and the atmospheric pressure was one atm. The LED lamps used were light plates inclued four type source such as red light source, green light source, red light source and full spectrum. Each LED light source includes a light board, a power supply, a controller, and corresponding circuits. Each light panel contains light beads and heat sinks. The controller can control the duty cycle and frequency of the pulse light source. LI-6400 was used to measure the photosynthetic rate and PPFD of plants. The LED lamps used were light plates, with a peak wavelength of 629 nm on a red light plate (red light 1), a peak wavelength of 656 nm on a second red light plate (red light 2), a peak wavelength of 452 nm on a blue light plate (blue light 1), a peak wavelength of 461 nm on a second blue light plate (blue light 2), a peak wavelength of 520 nm on a green light plate, and a full spectrum light plate. Each type of light plate as well as the full spectrum lamp board contained 150 2835 type light beads (2835 is a type of LED); the power supply adopted an adjustable frequency and duty cycle power supply. The spectrum diagram of the mixed light lamp is shown in Fig. 1. The spectrum emitted by the blue light 1, blue light 2, green light, red light 1, and red light 2 panels is shown in Fig. 1~Fig. 6, respectively.
During the experiment, the appropriate frequency and duty cycle were adjusted, and the LED light was then switched on for half an hour to ensure stability in both the plant and lighting. The photosynthetic rate of the plant was then measured using the LI-6400.
From the above analysis of results, it can be concluded that the photosynthetic rate and photosynthetic capacity of plants vary at different frequencies, wavelengths, and duty cycles. Under fixed other conditions, changing one of the three conditions of frequency, wavelength, and duty cycle, the photosynthetic rate or photocarbon capacity has its own optimal values. From the above research, it can be concluded that in order to obtain the optimal value of a certain parameter, appropriate frequency, wavelength, and duty cycle can be adjusted.
2 Results and analysis
2.1 Under fixed duty cycle and variable frequency pulse light source mode
The frequency changed from 1 to 10, 100, 1 000, 10 000, and 100 000 Hz, with a duty cycle of 0.4. Because a PWM (Pulse-Width Modulation) pulse light was used, the photosynthetic photon illuminance of the pulsed light varied owing to the non-zero opening voltage. Fig. 7 shows the variation data of 25 cm PPFD under the lamp panel with frequency under a duty cycle of 0.4. The figure shows that from 0~10 000 Hz, the PPFD first increased and then decreased with increasing frequency. The PPFD measurement of the full spectrum lamp panel was the highest, and that of the blue light panel was the lowest. The maximum observed PPFD was at 1 000 Hz. The spectral data emitted by the full spectrum lamp panel was 364 ?mol (photon)?m-2?s-1, and the minimum PPFD of the lamp panel was less than 50 ?mol (photon)?m-2?s-1. The PPFD of different wavelengths is different, and the possible reason is that the photoelectric conversion efficiency of each type of LED is different, and the starting voltage of each type of LED is also different, resulting in different parameters of controlling the pulse light source through a unified current drive.
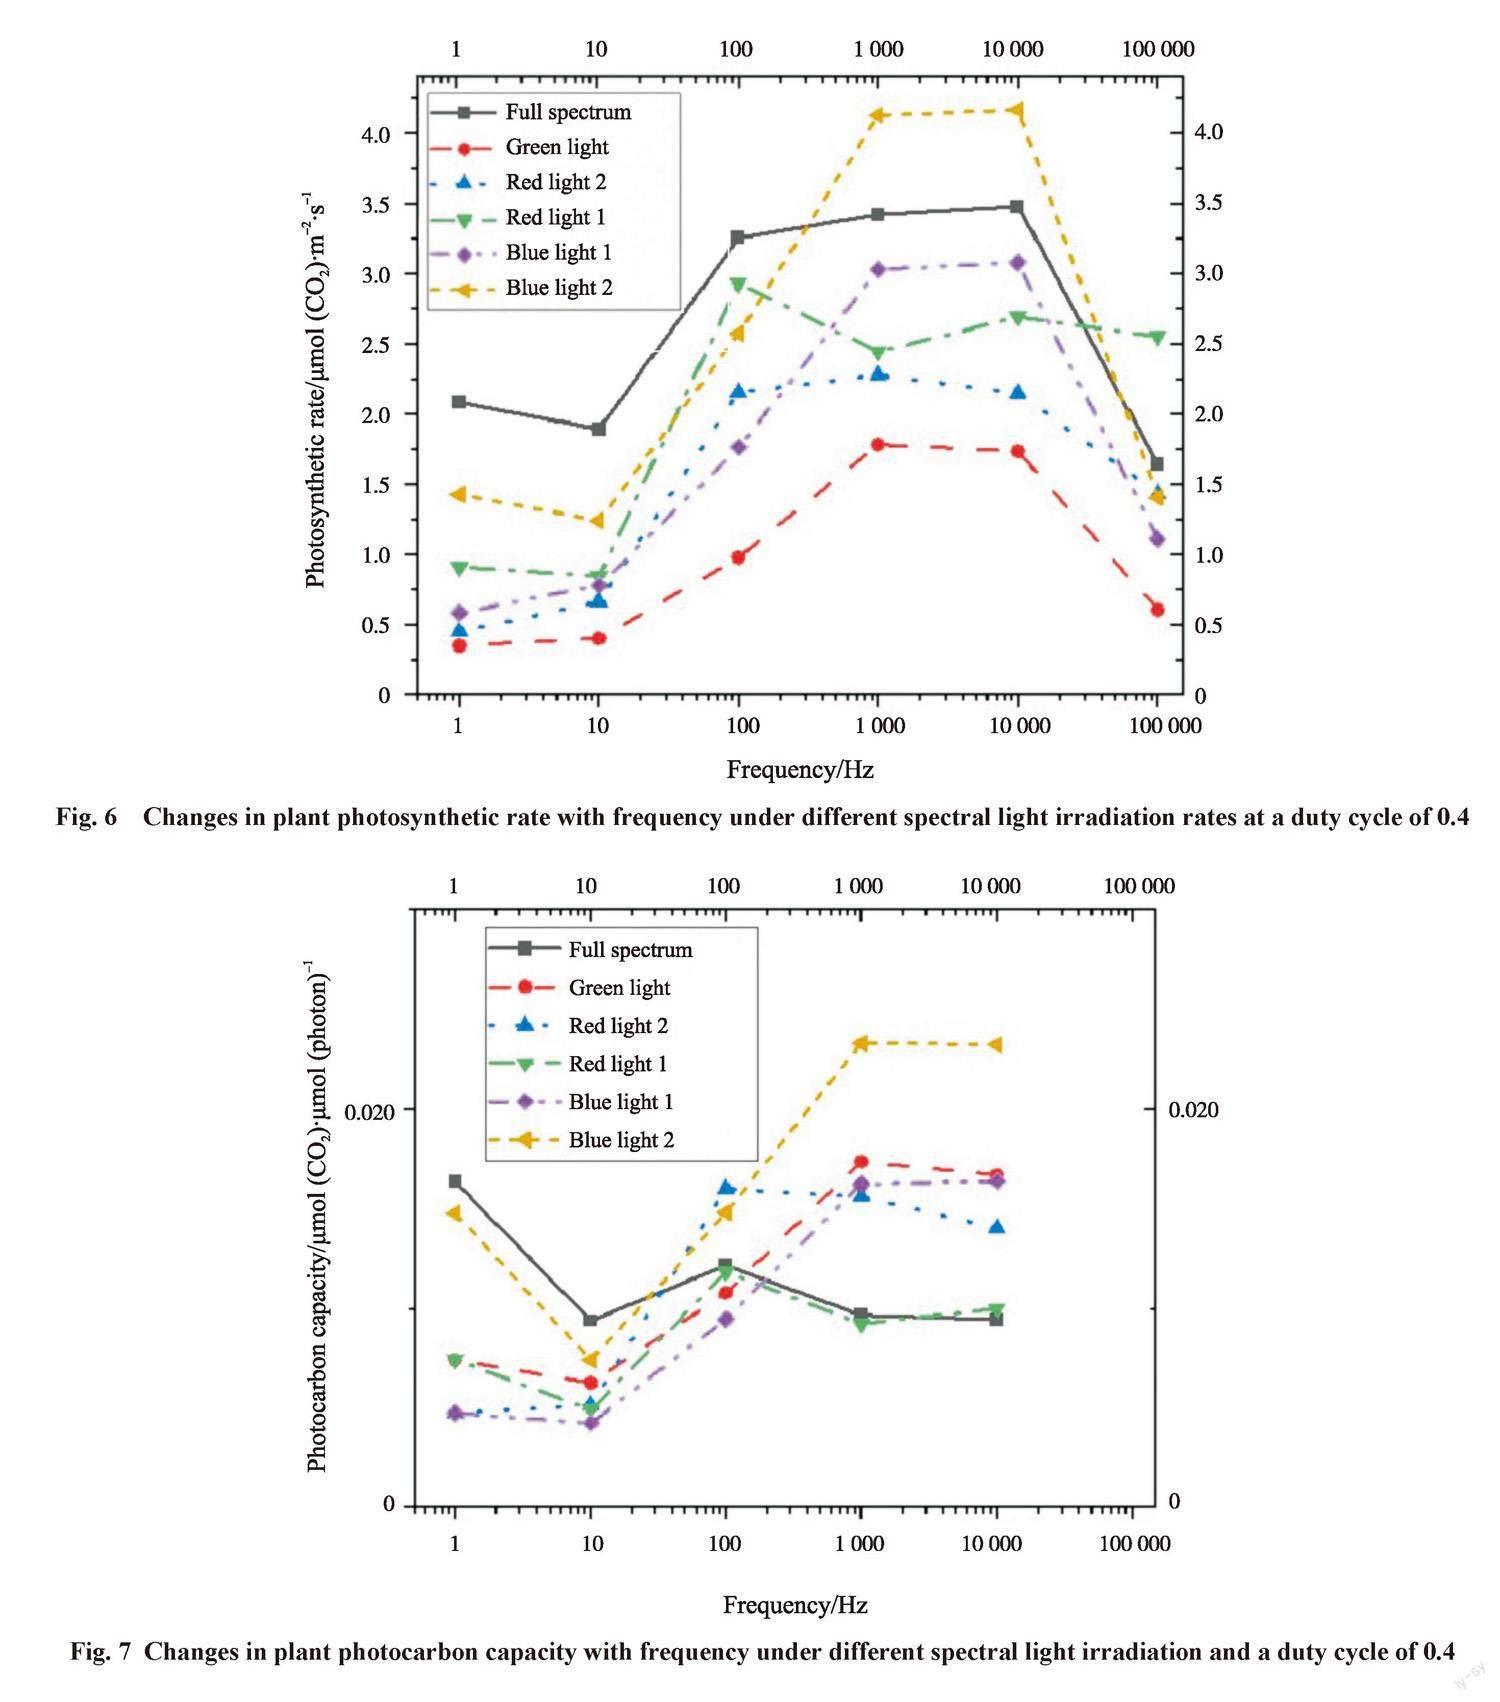
Fig. 6 shows that each type of light source has a corresponding optimized frequency, corresponding to obtaining the maximum PPFD under this type of light source.
Fig. 6 shows the variation of plant PPFD with frequency under pulsed light with a duty cycle of 0.4 and different spectral light irradiation rates. In the full spectrum, green light, red light 2, blue light 1, and blue light 2, the photosynthetic rate of plants first increased and then decreased with increasing frequency. For the red light 1 lamp board, as the frequency increased, the photosynthetic rate of the plants first increased, followed by a decrease, then increased again, followed by a final modest decrease. The maximum measurement for the photosynthetic rate was 4.2 ?mol (CO2)?m-2?s-1, corresponding to the blue light panel and 10 000 Hz; the minimum photosynthetic rate measurement was 0.3 ?mol (CO2)?m-2?s-1, corresponding to the green light panel and 1 Hz. Each type of light source has a corresponding optimized frequency, corresponding to the maximum photosynthetic rate under this type of light source.
Fig. 7 shows the variation in plant photocarbon capacity with frequency under pulsed light with a duty cycle of 0.4 and different spectral light irradiation rates. For the green light, blue light 1, and blue light 2, the photocarbon capacity first decreased and then increased with increasing frequency. For the full spectrum, red light 2, and red light 1 lamp panels, as the frequency increased, the photosynthetic capacity of the plants first decreased, then increased, and finally decreased. The maximum measurement for optical photocarbon capacity was 0.002 ?mol (CO2)??mol (photon)-1, corresponding to the second blue light panel illuminated at 1 000 Hz. The minimum measurement of the optical photocarbon capacity was 0.004 ?mol (CO2)??mol (photon)-1, corresponding to the first blue light panel illuminated at 10 Hz. Each type of light source has a corresponding optimized frequency, which corresponds to the maximum photocarbon capacity under this type of light source.
2.2 Under fixed duty cycle and variable frequency pulse light source mode
Fig. 8 shows the variation data of 25 cm PPFD by the duty cycle under the displayed lamp panel at the optimal frequency. Between 0~10 000 Hz, PPFD continued to increase with increasing frequency, with the highest PPFD measurement for the full spectrum lamp panel and the lowest for the green light panel. The spectral data emitted by the full spectrum lamp panel with a maximum PPFD of 1 000 Hz and a duty cycle of 1.0 was 368 ?mol (photon)?m-2?s-1. The minimum PPFD was 47 ?mol?m-2?s-1, corresponding to the green light panel.
Subsequently, the impact of pulsed light with different duty cycles on the plant photosynthetic rate at the optimal frequency of each spectrum was evaluated. Fig. 9 demonstrates that the full spectrum, green light, red light 1, and red light 2 panels showed a continuous increase in the photosynthetic rate of the plants with increasing frequency. For the blue light 2 lamp board, as the frequency increased, the photosynthetic rate of plants first increased and then decreased; for the blue light 1 lamp board, as the frequency increased, the photosynthetic rate of plants first increased, then decreased, and finally increased. The maximum optical photocarbon capacity measurement was 6.4 ?mol (CO2)?m-2?s-1, corresponding to the full spectrum lamp panel with a duty cycle of 0.6. The minimum optical photocarbon capacity measurement was 0.8 ?mol (CO2)?m-2?s-1, corresponding to the green light panel and a duty cycle of 0.6.
The influence of pulsed light with different duty cycles on the plant photosynthetic rate at the optimal frequency of each spectrum was evaluated next. Fig. 10 demonstrates that for the full spectrum, green light, and blue light 1 panels, the photosynthetic capacity of the plants first increases and then decreases as the frequency increases. For the red light 1 lamp panel, as the frequency increased, the photocarbon capacity of the plant first decreased and then increased; for the blue light 2 lamp panel, as the frequency increased, the photocarbon capacity of the plants decreased continuously. The maximum optical photocarbon capacity measurement was 0.028 ?mol (CO2)??mol (photon)-1, corresponding to the red light 2 lamp panel and a duty cycle of 0.6; the minimum optical photocarbon capacity was 0.016 ?mol (CO2)??mol (photon)-1, corresponding to the blue light 2 panel and a duty cycle of 0.6. The optimal optimization frequency and duty cycle for comparing photosynthetic rate and photocarbon capacity are different, possibly due to the different PPFD of the two and the fact that the light response curve is a single curve.
Fig. 10 Changes in plant photocarbon capacity with duty cycle under different spectral light irradiation rates at the optimal frequency of each spectrum
3 Discussions
In summary, after first fixing the duty cycle of pulsed light and changing its frequency, the photosynthetic rate was 4.2 ?mol (CO2)?m-2?s-1 when the blue light panel was illuminated at 10 000 Hz. Then, under the optimal frequency of each wavelength, the changing duty cycles were 0.2, 0.4, 0.6, and 0.8. The maximum data of photosynthetic rate was 6.4 ?mol (CO2)?m-2?s-1 when the duty cycle was 0.6 under the full spectrum lamp panel irradiation. The concept of photocarbon capability was proposed to more effectively measure the ability of photons to convert carbon dioxide. More specifically, under identical conditions, the pulse light frequency should be changed. When the blue light panel 2 was illuminated, with a frequency of 1 000 Hz, the maximum photosynthetic rate was 0.002 ?mol (CO2)??mol (photon)-1 . Then, when fixed at 100 Hz, the variable duty cycles were 0.2, 0.4, 0.6, and 0.8. The maximum optical photocarbon capacity was 0.028 ?mol (CO2)??mol (photon)-1 when the full spectrum lamp panel was illuminated and the duty cycle was 0.6. It is expected that high-power packaging through primary optical design can eliminate the lenses currently designed using secondary optical methods, based on the results of this article in the future. The omitted lens can reduce the cost, volume, and weight of lighting fixtures.
References:
[1] NAVAS E, FERN?NDEZ R, SEP?LVEDA D, et al. Soft grippers for automatic crop harvesting: a review[J]. Sensors, 2021, 21(8): 2689.
[2] MATIOLI E, WEISBUCH C. Impact of photonic crystals on LED light extraction efficiency: approaches and limits to vertical structure designs[J]. Journal of Physics D: Applied Physics, 2010, 43(35): 354005.
[3] KIM K K, LEE S, KIM H, et al. Enhanced light extraction efficiency of GaN-based light-emitting diodes with ZnO nanorod arrays grown using aqueous solution[J]. Applied Physics Letters, 2009, 94(7): 071118.
[4] SEO J, KIM S, KIM Y, et al. Effect of glass refractive index on light extraction efficiency of light‐emitting diodes[J]. Journal of the American Ceramic Society, 2014, 97(9): 2789-2793.
[5] HUANG C H, KANG C Y, CHANG S H, et al. Ultra-high light extraction efficiency and ultra-thin mini-LED solution by freeform surface chip scale package array[J]. Crystals, 2019, 9(4): 202.
[6] JIANG B H, LIN D W, SHIU M N, et al. Efficient, ambient‐ stable, all‐polymer organic photodetector for machine learning‐promoted intelligent monitoring of indoor plant growth[J]. Advanced Optical Materials, 2023: 2203129.
[7] BERKOVICH Y A, BURYAK A A, OCHKOV O A, et al. Minimization of the equivalent system mass of a vitamin greenhouse with LED lighting for various scenarios of space missions[J]. Acta Astronautica, 2022, 198: 403-409.
[8] ZAVAFER A, MANCILLA C, JOLLEY G, et al. On the concepts and correct use of radiometric quantities for assessing the light environment and their application to plant research[J]. Biophysical Reviews, 2023, 15: 385-400.
[9] KUDIRKA G, VIR?IL? A, LAU?IK? K, et al. Photosynthetic photon flux density effects on portulaca olearacea in controlled-environment agriculture[J]. Plants, 2023, 12(20): 3622.
[10] SAITO K, ISHIGAMI Y, GOTO E. Evaluation of the light environment of a plant factory with artificial light by using an optical simulation[J]. Agronomy, 2020, 10(11): 1663.
[11] CHEREMISIN A V, GUREEVA I M, BRIUSHININ A A, et al. Development of an ecological lighting device to reduce the growth time of agricultural plants in greenhouses[C]//Journal of Physics: Conference Series. IOP Publishing, 2021, 1942(1): 012094.
[12] ZAZUETA-TORRES N D, Y??EZ-JU?REZ M G, AYALA-TAFOYA F, et al. Quality of light from fluorescent lamps in cucumber growth and severity of Oidium sp[J]. Revista Mexicana de Ciencias Agrícolas, 2022, 13(6): 977-989.
[13] KE X, YOSHIDA H, HIKOSAKA S, et al. Photosynthetic photon flux density affects fruit biomass radiation-use efficiency of dwarf tomatoes under LED light at the reproductive growth stage[J]. Frontiers in Plant Science, 2023, 14: 1076423.
[14] SUNGWISET S, JANPRUNG T, PECHSIRI T, et al. Study of LED grow light driver circuit for indoor strawberry cultures: a class experiment[J]. ASEAN Journal of Science and Engineering Education, 2021, 1(1): 21-30.
[15] AFZALI S, MOSHARAFIAN S, VAN IERSEL M W, et al. Optimal lighting control in greenhouses equipped with high-intensity discharge lamps using reinforcement learning[C]//2021 American Control Conference (ACC). IEEE, 2021: 1414-1419.
[16] MA Y, XU A, CHENG Z M M. Effects of light emitting diode lights on plant growth, development and traits a meta-analysis[J]. Horticultural Plant Journal, 2021, 7(6): 552-564.
[17] MATSUDA R, SHIBA S, CHEN Y, et al. Growth of cucumber seedlings under emulated sunlight with artificially reproduced fluctuations in photosynthetic photon flux density[J]. Journal of Agricultural Meteorology, 2023, 79(4): 131-137.
[18] KUDIRKA G, VIR?IL? A, LAU?IK? K, et al. Photosynthetic photon flux density effects on portulaca olearacea in controlled-environment agriculture[J]. Plants, 2023, 12(20): 3622.
[19] HASHIM M, AHMAD B, DROUET S, et al. Comparative effects of different light sources on the production of key secondary metabolites in plants in vitro cultures[J]. Plants, 2021, 10(8): 1521.
[20] PALMITESSA O D, PRINZENBERG A E, KAISER E, et al. LED and HPS supplementary light differentially affect gas exchange in tomato leaves[J]. Plants, 2021, 10(4): 810.
[21] OLVERA-GONZALEZ E, ESCALANTE-GARCIA N, MYERS D, et al. Pulsed LED-lighting as an alternative energy savings technique for vertical farms and plant factories[J]. Energies, 2021, 14(6): 1603.
[22] MILIAUSKIEN? J, KARLICEK JR R F, KOLMOS E. Effect of multispectral pulsed light-emitting diodes on the growth, photosynthetic and antioxidant response of baby leaf lettuce (Lactuca sativa L.)[J]. Plants, 2021, 10(4): 762.
[23] CAROTTI L, POTENTE G, PENNISI G, et al. Pulsed LED light: exploring the balance between energy use and nutraceutical properties in indoor-grown lettuce[J]. Agronomy, 2021, 11(6): 1106.
[24] YU H B, XU X D, MA L Y, et al. The effect mechanism and model optimization of pulsed light dark duration on lettuce[J]. Research Square, 2021, 1: 1-30.
[25] SHIMADA A, TANIGUCHI Y. Red and blue pulse timing control for pulse width modulation light dimming of light emitting diodes for plant cultivation[J]. Journal of Photochemistry and Photobiology B: Biology, 2011, 104(3): 399-404.