Experimental study of core MHD behavior and a novel algorithm for rational surface detection based on profile reflectometry in EAST
2024-04-06KaixuanYE叶凯萱ZhenZHOU周振TaoZHANG张涛JiuyangMA马九阳YuminWANG王嵎民GongshunLI李恭顺KangningGENG耿康宁MingfuWU吴茗甫FeiWEN文斐JiaHUANG黄佳YangZHANG张洋LinmingSHAO邵林明ShuqiYANG杨书琪FubinZHONG钟富彬ShanluGAO高善露LinYU喻琳ZiqiangZHOU周子强Haoming
Kaixuan YE (叶凯萱) ,Zhen ZHOU (周振),2 ,Tao ZHANG (张涛),* ,Jiuyang MA (马九阳),2 ,Yumin WANG (王嵎民) ,Gongshun LI (李恭顺) ,Kangning GENG (耿康宁),Mingfu WU (吴茗甫),2,Fei WEN (文斐),Jia HUANG (黄佳),2,Yang ZHANG (张洋),Linming SHAO (邵林明),Shuqi YANG (杨书琪),2,Fubin ZHONG (钟富彬),Shanlu GAO (高善露),2,Lin YU (喻琳),2,Ziqiang ZHOU (周子强),2,Haoming XIANG (向皓明),Xiang HAN (韩翔),Shoubiao ZHANG (张寿彪),Guoqiang LI (李国强),Xiang GAO (高翔),* and the EAST Team
1 Institute of Plasma Physics,Hefei Institutes of Physical Science,Chinese Academy of Sciences,Hefei 230031,People’s Republic of China
2 University of Science and Technology of China,Hefei 230026,People’s Republic of China
3 Hebei Key Laboratory of Compact Fusion,Langfang 065001,Peoples Republic of China
4 ENN Science and Technology Development Co.,Ltd.,Langfang 065001,Peoples Republic of China
5 Advanced Energy Research Center,Shenzhen University,Shenzhen 518060,People’s Republic of China
Abstract Microwave reflectometry is a powerful diagnostic that can measure the density profile and localized turbulence with high spatial and temporal resolution and will be used in ITER,so understanding the influence of plasma perturbations on the reflect signal is important.The characteristics of the reflect signal from profile reflectometry,the time-of-flight (TOF) signal associated with the MHD instabilities,are investigated in EAST.Using a 1D full-wave simulation code by the Finite-DifferenceTime-Domain (FDTD) method,it is well validated that the local density flattening could induce the discontinuity of the simulated TOF signal and an obvious change of reflect amplitude.Experimental TOF signals under different types of MHD instabilities (sawtooth,sawtooth precursors and tearing mode) are studied in detail and show agreement with the simulation.Two new improved algorithms for detecting and localizing the radial positions of the low-order rational surface,the cross-correlation and gradient threshold(CGT) method and the 2D convolutional neural network approach (CNN) are presented for the first time.It is concluded that TOF signal analysis from profile reflectometry can provide a straightforward and localized measurement of the plasma perturbation from the edge to the core simultaneously and may be a complement or correction to the q-profile control,which will be beneficial for the advanced tokamak operation.
Keywords: MHD instabilities,profile reflectometry,rational surface detection,convolutional neural network (CNN),EAST tokamak
1.Introduction
Magnetohydrodynamic (MHD) instabilities are the most prevalent and important phenomena in tokamaks,which have been studied for decades and believed to affect the core confinement [1].As an example,the neoclassical tearing mode (NTM) significantly enhances radial transport across the island [2],flattens the pressure profile within the island[3] and limits achieving higher normalized pressure (βN) [4]:higherβNmeans higher fusion power.Anm/n=3/2 NTM mode can lead to about 20% reduction in plasma confinement,and a 2/1 mode can grow to large amplitudes and even cause major disruption in tokamak discharges,wherem/nis the poloidal/toroidal mode number [5]. The electron cyclotron current drive (ECCD) is an effective system for tearing mode stabilization when the power deposition can be precisely localized in the O-point of the magnetic island.Therefore,the measurement,localization and identification of MHD behavior with high spatial and temporal resolution are important for plasma control and the achievement of highβNdischarges.
Another important issue for the advanced tokamak operation is the internal transport barrier,which requires good measurement and control of the current density and the correspondingq-profile [6].Usually,the equilibrium is reconstructed by the Grad-Shafranov (G-S) equation solver with the measurements from the edge magnetic probes(MPs).In order to improve the reconstruction accuracy,additional information from the diagnostics such as the motional Stark effect (MSE) diagnostic or polarimetry is needed to further constrain the core solutions.However,there are significant technical challenges for the MSE and polarimetry in the current experiment,and it will be even more challenging in ITER due to the extreme environment of the first mirrors [7].Thus,if more additional information on the low-order rational surfaces in the core can be measured directly,it will be beneficial in reducing the technical requirements for the MSE and polarimetry and also in limiting the equilibrium reconstruction.
Microwave reflectometry has proven to be a powerful diagnostic for the measurement of density profiles,density fluctuations and plasma rotation velocity in many devices and will be used in ITER [8].Currently,the most widely used and efficient technique for profile reflectometry is frequency-modulated continuous-wave (FMCW) broadband reflectometry with ultrafast frequency sweep.In ASDEX Upgrade,profile reflectometry has reached a remarkable value of 1μs for each one frequency sweeping,which means it can simultaneously measure the density profile and the localized density fluctuation (up to 400 kHz) from the plasma edge to the plasma core [9].In Tore Supra,the experimental results showed clear perturbations of the time of flight (TOF) of the reflected signal due to the MHD activity and suggested the possibility of determining the rational surfaces from the profile reflectometry [10].In this work,a further investigation of the profile reflectometry measurement associated with MHD instability has been studied from both full-wave simulations and experimental analysis in EAST.A new algorithm,the cross-correlation and gradient threshold (CGT) method,and a further neural network approach (CNN) to rational surface localization from profile reflectometry measurements are presented for the first time.
The structure of the remaining paper is organized as follows.In section 2,a brief description of the 1D O-mode full-wave code and the corresponding numerical results are given.In section 3,the information on profile reflectometry in EAST is given and the experimental results of three different MHD instabilities (sawtooth,kink and tearing mode) from profile reflectometry are surveyed.The two new rational surface localization algorithms for profile reflectometry are described in section 4.A final summary is given in section 5.
2.Description of the 1D O-mode full-wave code and numerical results
In order to account for the full-wave effect in FMCW reflectometry,a 1D full-wave code has been developed to simulate the microwave propagation across the plasma.The wave propagation in magnetized plasma can be derived from the Maxwell’s equations as
In this work,the frequency sweep source is modeled to simulate the injected microwave by profile reflectometry as:
whereVsis the sweep rate from the initial frequencyf0to the end frequencyf1with the sweep period ofTsweep,i.e.Vs=(f1-f0)/Tsweep.For the O-mode polarization,the cut-off frequency of probing wave,fpe,only depends on the electron density,ne,asAs shown in figure 1(a1),an unperturbed and parabolic density profile whereneis 3.5×10¹⁹m-3atR=1.9 m andne=0 atR=2.22 m is assumed to be the input of the full-wave codes.The positions before and after the plasma are set to be vacuum and the absorbing boundary conditions are used.The outputs of the codes are the time-dependent reflected wave which contains the information about the time of flight,τF(f),and the reflected amplitude.The TOF of each frequency represents the duration of propagation between the cut-off location and back to the antenna for the probing frequency.The TOF signal can be obtained by taking the spectrogram of the reflected wave.Figure 1(a2) shows the corresponding spectrogram of the 1D full-wave simulation,which shows a monotonic increase of τFwith increasing probing frequency.It also indicates that the ridge from the spectrogram of the 1D full-wave code is perfectly matched with the Wentzel-Kramers-Brillouin(WKB) solution (i.e.the blacked dash line) in the case of the unperturbed profile.
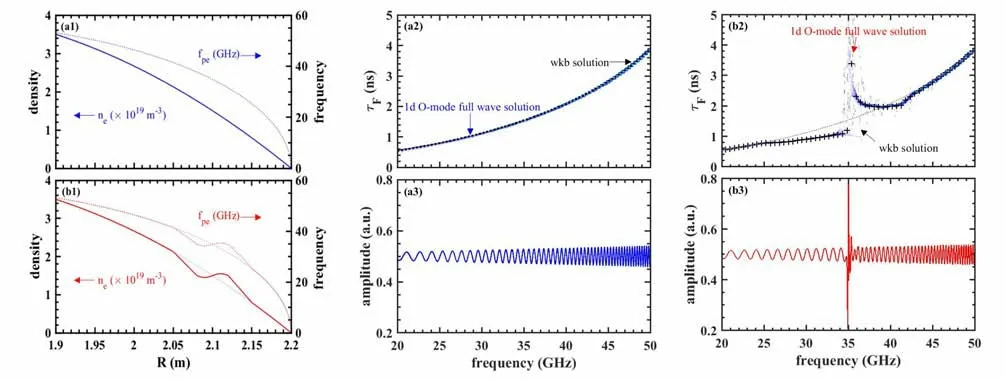
Figure 1.Simulation results of two cases: (a1)-(a3) an unperturbed density profile and (b1)-(b3) a perturbed density profile with local density flattening.
However,once the density is perturbed by some MHD mode,it will induce a local density perturbation.As shown in figure 1(b1),a sine wave of local density perturbation is added based on the case of the unperturbed profile.The perturbed density profile corresponds to the non-monotonic profile of the cut-off frequency;therefore,a local and obvious change of τFoccurs at the location where the density flattens.This could be observed in both the full-wave simulation and the WKB solution,as shown in figure 1(b2).Furthermore,the full-wave simulation could provide more information about the reflect amplitude that the WKB solution cannot provide.As figures 1(a3) and (b3) show,a sudden drop and then a significant increase in the amplitude signals caused by the perturbed density are observed.As mentioned in reference [12],the amplitude changes are due to electromagnetic flux conservation and the frequency mixing effect.
To summarize,the simulation results indicate that when local density flattening occurs,the time-of-flight signal(TOF or τF) from profile reflectometry exhibits a clear discontinuity,which is characterized as a TOF ‘jump’ [10,13,14].This is accompanied by a significant change in the reflect amplitude.
3.Experimental results of MHD behavior by profile reflectometry
3.1.Profile reflectometry on EAST
EAST is a fully superconducting tokamak with a major radius ofR=1.85 m and a minor radius ofa=0.45 m.The toroidal magnetic field can vary from 0 to 3 T,and the typical range of density is between 0 and 8×10¹⁹m-3.Since 2013,a multi-band of FMCW reflectometry for density profile measurements has been developed in EAST.The probing frequency covers from 33 to 110 GHz with X-mode polarization,and the antennas are installed at 3 cm above the midplane on the low-field side (LFS).An arbitrary waveform generator (AWG) and a voltage-controlled oscillator (VCO)based on the field-programmable gate array (FPGA) processor are used for the frequency sweep source [15].The details of profile reflectometry on EAST are summarized as follows:
(a) Three separate bands of frequency sweeping: Q-band(32-56 GHz) [16],V-band (48-72 GHz) [17] and W-band(72-110 GHz) [18].
(b) A quasi-optical (QO) combiner/de-combiner system is used for the combination and separation of these three bands [19].
(c) An in-phase and quadrature (I/Q) demodulator is used to separate the phase and amplitude of the reflected signal.The I/Q sampling frequency is 62.5 MHz.
(d) The period of the frequency sweep isTsweep=40μs with 10μs dead time,corresponding to a sweep rate ofVs~30 GHz/40μs for each band.
3.2.Sawtooth oscillation
Sawtooth oscillations (STs) are periodic relaxations of the density and temperature in the tokamak core plasma.When the ST crash occurs,hot electrons transport rapidly to a cooler region of plasma,such that the electron temperature and density profiles are flattened [20].Figure 2 shows an example of the TOF signal from the reflectometry measurement during ST cycles without a precursor (#112982).Compared to the density and temperature,the TOF signals show an opposite response to the STs (figures 2(a2) and(b2)).When the ST crashes,the TOF signals show a ‘negative’ sawtooth within the inversion radius and,in contrast,a‘positive’ sawtooth is observed outside the inversion radius.The negative and positive here mean the sudden increase and decrease in the Electron Cyclotron Emission (ECE) intensity (figure 2(a1)),respectively.
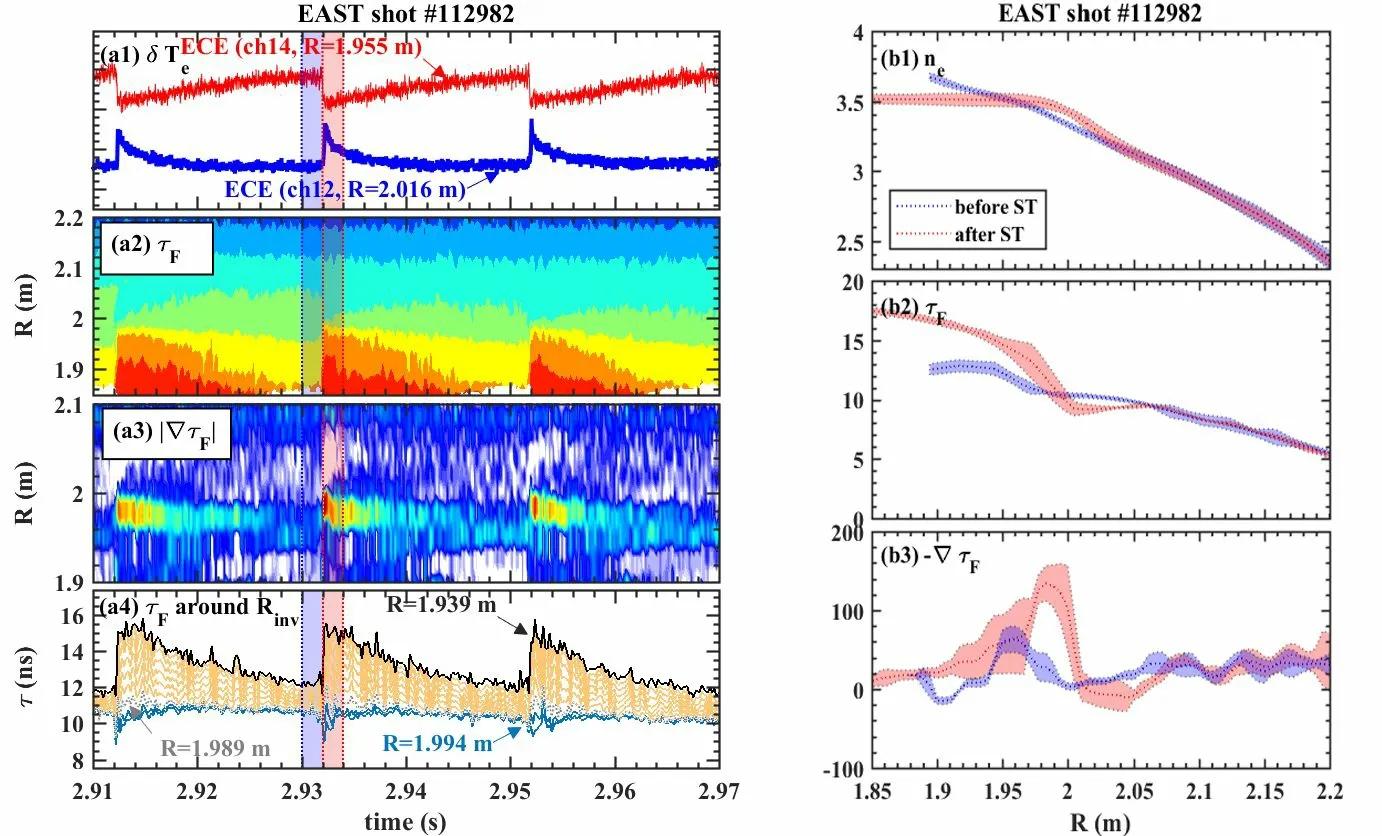
Figure 2.Time evolution of (a1) temperature perturbation (δTe) measured by ECE;(a2) time-of-flight signal (τF) and (a3) its radial gradient (dτF/dR) during the ST cycles without a precursor;(a4) τF signals around the inversion radius of the ST.Spatial profiles of (b1) electron density (ne),(b2) TOF signals (τF) and (b3) TOF gradient (dτF/dR) before and after the ST crash,which are indicated by the blue and red shaded areas in the left panel.The shaded areas in the right panel show the corresponding uncertainties.
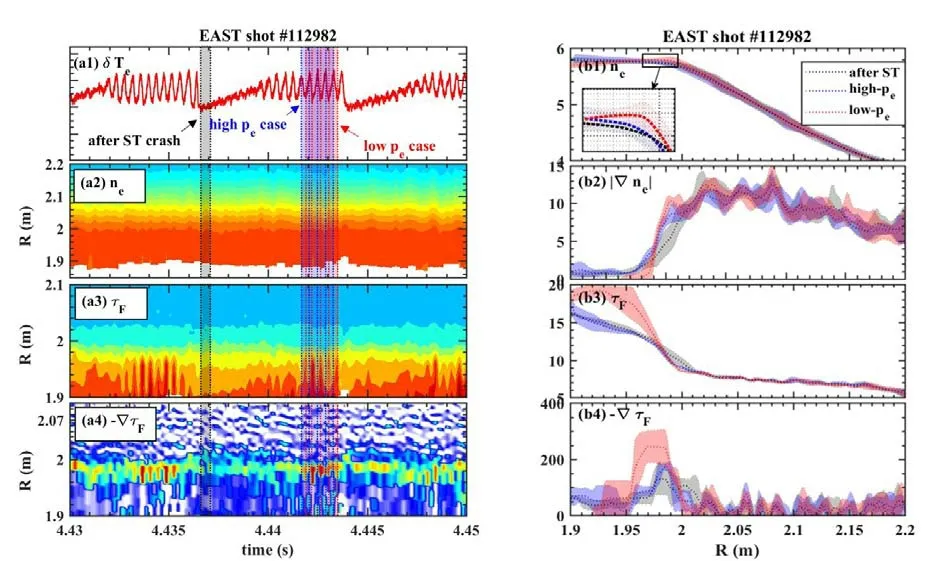
Figure 3.Time evolution of (a1) temperature perturbation (δTe) measured by ECE;(a2) density (ne) measured by profile reflectometry;(a3) time-of-flight signal (τF) and (a4) its radial gradient (dτF/dR) during the ST cycles with precursors.Spatial profiles of (b1) electron density (ne);(b2) density gradient (dne/dR);(b3) TOF signals (τF) and (b4) TOF gradient (dτF/dR) during three different cases: after ST crash (gray),‘high’ pe case (blue) and ‘low’ pe case (red).The shaded areas in the right panel show the corresponding uncertainties.
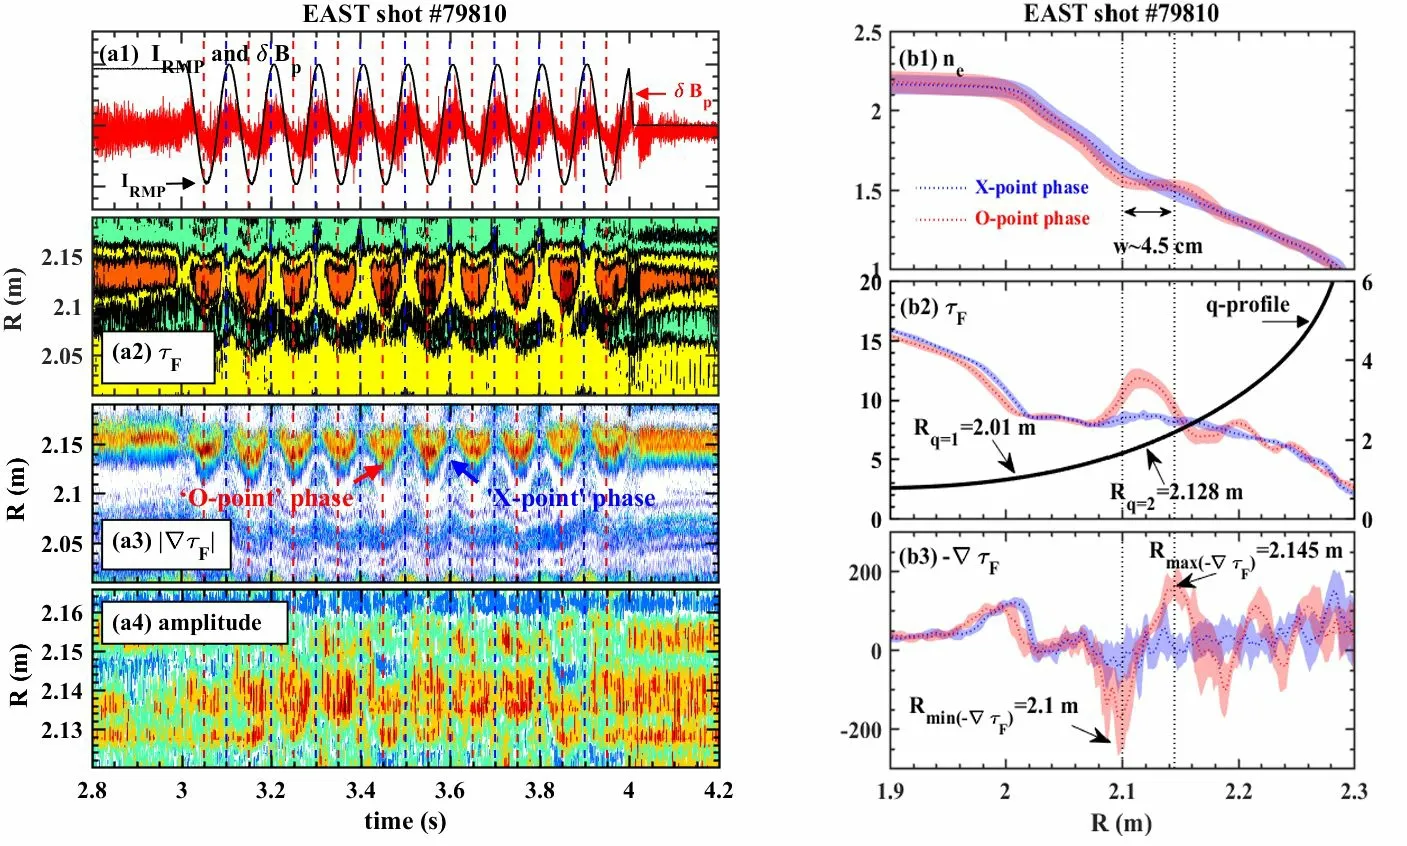
Figure 4.Time evolution of (a1) RMP coil current waveform (black) and magnetic perturbation (δB) from MPs (red);(a2) time-of-flight signal (τF) and (a3) its radial gradient (dτF/dR);(a4) reflected amplitude during the rotation of 2/1 tearing mode.Spatial profiles of (b1)electron density (ne);(b2) TOF signals (τF) and (b3) TOF gradient (dτF/dR) at the phase of the magnetic island’s X-point (blue) and Opoint (red) which are indicated by the blue and red lines in the left panel,respectively.The black line in (b2) shows the q profile in the Opoint phase,which is obtained from equilibrium reconstruction with EFIT code and polarimetry data.The shaded areas in the right panel show the corresponding uncertainties.The dash lines in the right panel show the positions of the maximum and minimum of the TOF gradient,respectively.
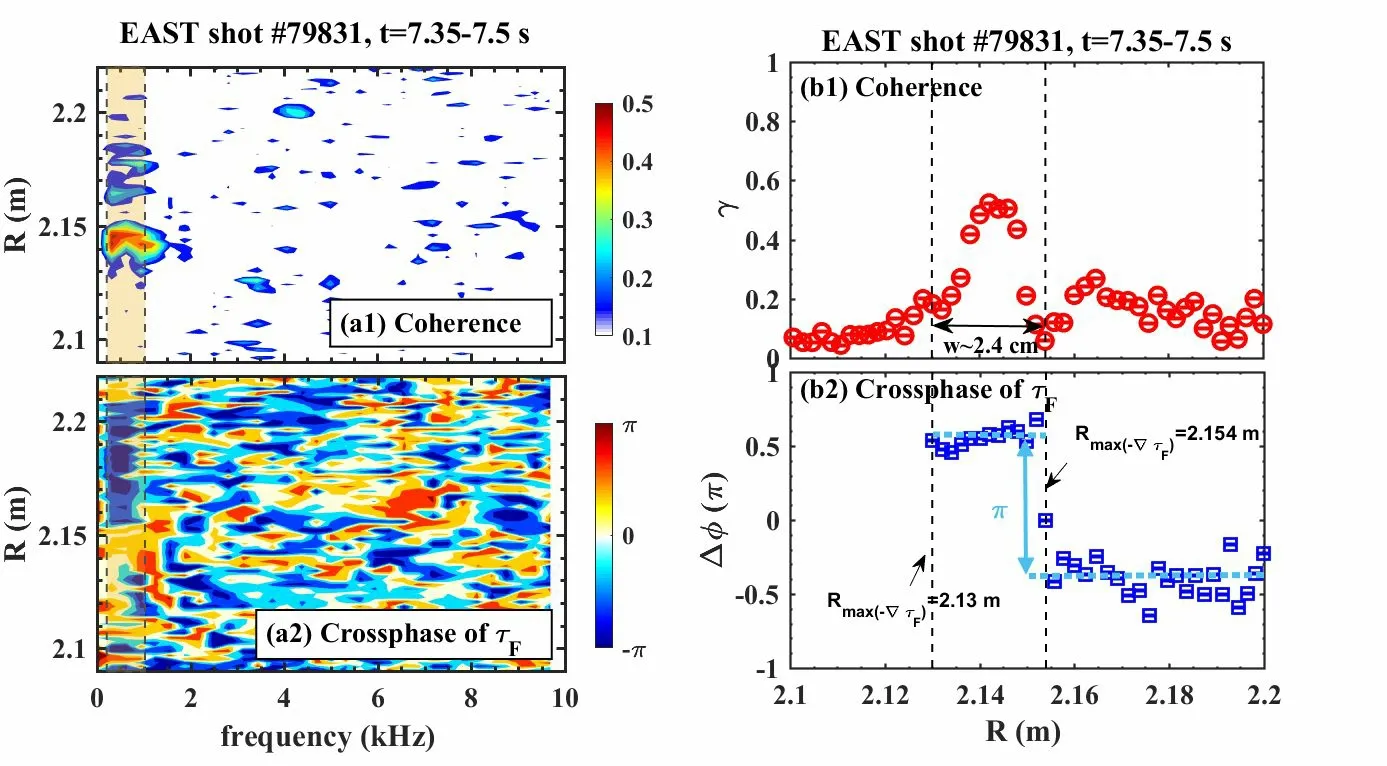
Figure 5.Cross-correlation analysis of the TOF signals with the reference of MPs signal during the 1/2 tearing mode.Radial structure of the TOF signals within the frequency of the tearing mode (fTM) from the cross-correlation analysis.(a1)-(b1) Coherence and (a2)-(b2)cross-phase of τF.The shaded areas in the left panel show the fTM,and the dashed lines in the right indicate the positions and width of the magnetic island from the TOF signals.
As shown in figure 2(a4),the sawtooth inversion radius can be deduced from the τFsignals asRinv=1.989 m at the low side.This result is in agreement with the results of the ECE measurement,which indicates thatRinvis in the range of 1.955-2.016 m.It should be noted that the ECE measurement is a fixed frequency system with a sampling rate of 2 MHz,whereas profile reflectometry works with a high frequency sweep rate ofVs~ 30 GHz/40μs in EAST.Therefore,compared to the ECE intensity,the TOF signals could give a relatively lower temporal resolution but a much higher radial resolution of the behavior of the ST and itsRinv.Moreover,as shown in figures 2(b2) and (b3),the density flattening caused by the ST crash could induce the TOF ‘jump’ and an apparent local maximum of the TOF gradient around theRinv,which is perfectly matched to the simulation results.The local maximum of the TOF gradient could be found in each of the ST cycles with good reproducibility,as shown in figure 2(a3).
3.3.Sawtooth precursors (1/1 kink mode)
Another kind of sawtooth cycle with a long-period 1/1 kink mode before the crash,i.e.a sawtooth precursor,is also usually observed in EAST,as shown in the ECE signals in figure 3(a1) .Compared to studying the MHD behavior through the reconstructed density profile,looking at the TOF signal seems to be more straightforward and accurate.As shown in figure 3(a2),it is quite difficult to observe the response of the reconstructed density to the kink mode.On the other hand,an obvious periodic change of the TOF signals inside theq=1 surface due to the kink oscillation can be easily found,as shown in figure 3(a3).More details can be obtained from the spatial profiles of the TOF signal and its gradient.During the rotation of the kink mode,there are two cases of TOF profiles,i.e.,‘high’pe(electron pressure) case and ‘low’pecase.The high and low here denote the peak and valley in the core ECE intensity (figure 3(a1)),respectively.It can be seen from figure 3(b3) that the TOF‘jump’ is much larger in the lowpecase (red lines) than in the highpecase (blue lines).Furthermore,a larger maximum of the TOF gradient around the inversion radius can be found in the ‘low’pecase than in the ‘high’pecase (figures 3(a4) and (b4)),while it is difficult to see the difference from the reconstructed density gradient between these two cases(figure 3(b2)).
As mentioned above,the ‘jump’ in the TOF signals indicates the appearance of local density flattening.Correspondingly,the density profile inside theq=1 surface appears to be more locally flattening in the lowpecases from the expansion in figure 3(b1).It should be noted that the difference between these two cases is quite obvious in the TOF signals,but tiny in the density profiles.There are several possible reasons for this observation: (a) the density oscillations induced by sawtooth precursors inside theq=1 surface are relatively small (δne/ne~ 0.8%-3%) [21-23];(b) the density profiles are successively inverted from the edge to the core and the integrated errors could further diminish the differences;(c) however,as the raw data of the profile reflectometry,the TOF signals are more localized and sensitive to the local density change.
This experimental result is in agreement with the 3D full MHD non-linear simulations by the XTOR-2F code in Tore Supra [24].It is found that if the kink mode persists after the ST crash a rapid flattening of the density profile can be driven due to a strong velocity shear zone inside theq=1 surface.This result is evidence that the density evolution is dominated by perpendicular flows,while the temperature is controlled by parallel diffusion.Since the parallel transport is much faster than the perpendicular one,this phenomenon can only be observed in the density profile and not in the temperature profile.
3.4.2/1 tearing mode
It is evident that a sufficient amplitude of Resonant Magnetic Perturbations (RMPs) can destabilize the tearing mode and induce a large magnetic island.The generated magnetic island is in phase with the RMP due to the applied electromagnetic torque and the width of the island is proportional to the RMP amplitude [25].An analysis of the TOF signals due to the mode dynamics can be studied accurately in more detail when the applied RMP and the island rotate slowly.For this purpose,an ohmic discharge (#79810) with a slow rotating frequency of the RMP (10 Hz) is studied first.As the black line shows in figure 4(a1),a static RMP is first applied and then followed by a rotatingn=1 RMP which rotates in the counter-Ipdirection.From the measurement of magnetic perturbation by MPs (red line in figure 4(a1)),it is easily found that the generated 2/1 tearing mode rotates in phase with the RMP.
Accordingly,the TOF signals (figure 4(a2)) and TOF gradient (figure 4(a3)) which are located around the 2/1 island also show a clear oscillation due to the rotation of the island.As shown in figure 4(b2),the TOF signals located around the 2/1 island have a different response to the tearing mode between the phase of the X-point (blue) and the Opoint (red).When the X-point is in front of the reflectometry antennas,the TOF signals increase monotonically inwards.Conversely,when the O-point is in front of the reflectometry antennas,the TOF signals increase significantly from=2.1 m to=2.145 m and de-crease slightly outside.Here,the positions ofandare close to the inner and outer sides of the separatrix,respectively,which is consistent with the ECE measurement presented in reference [26].
The black line in figure 4(b2) shows the correspondingqprofile at the O-point phase,obtained from EFIT (Equilibrium FITting) equilibrium reconstruction code and constrained by polarimetry measurement.It clearly shows that the mean value of(i.e.Rmean=2.123 m) could agree well with the radial position of the reconstructedq=2 surface (i.e.Rq=2=2.128 m);meanwhile,the second local maximum of the TOF gradient is also consistent with the radial position of the reconstructedq=1 surface (Rq=1=2.01 m).As shown in figures 4(b1) and (b3),the width of the magnetic island can be calculated from the positions of the maximum and minimum of the TOF gradient,asw~ 4.5 cm,which is consistent with the magnetic measurements (w~ 4.3 cm) [26].
Furthermore,it is found that not only the TOF signal is modulated by the rotating islands but also the amplitude of the reflect signal.As shown in figure 4(a4),the reflect amplitude signals located around the maximum ofshow the typical oscillations due to the 2/1 tearing mode(TM),and the enhancement of the amplitude in the O-point phase can be well reproduced in each TM period.This result is in agreement with the results of the 1D O-mode full-wave simulation mentioned above,which also shows an obvious increase in the reflect electric field (Ez) around the outer separatrix at the O-point phase.It should be noted that the modulation of the amplitude signal was also observed by profile reflectometry in the Tore Supra tokamak.However,an decrease of the reflect amplitude in the phase of the Opoint was found at the location ofand no obvious response at the location ofin Tore Supra [10].
As mentioned earlier,the sweep period of profile reflectometry in EAST is 50μs,which corresponds to a maximum of sampling frequency (20 kHz) for each point of the sweeping frequency.Therefore,the radial structure of MHD instabilities with a mode frequency below 10 kHz can be accurately captured by the cross-correlation analysis of the TOF signals.An example to illustrate the method is shown in figure 5 for another ohmic discharge (#79831) with 2/1 TM mode occurrence,whose mode frequency isfTM=0.3-1 kHz.Spectral coherence ofγbetween two time series signals (X(t) andY(t)) is given as
Here,Nis the number of ensembles,Xi(f) andYi(f) are the Fourier components ofXi(t) andYi(t),and the subscriptirepresents the index of the ensemble.As shown in figure 5(a1),the maximum of coherence for TOF signals is located inside the magnetic island with the frequency of the tearing mode,while other areas are basically at the noise level (~ 0.1).It can be seen from figure 5(a2) that the phase difference of the TOF signals between inside the island and outside the outer separatrix is about π,i.e.opposite phase.This result agrees well with the observations shown in figure 4.
In addition,the mean value of the coherence and crossphase within the tearing mode frequency is calculated for the determination of the island width.As shown in figure 5(b1),the outer separatrix is located at the point where the crossphase of the TOF signals is~ 0 and the corresponding coherence reaches a local minimal value between two local maximal points,i.e.,=2.154 m.Meanwhile,the inner separatrix is near the point where the cross-phase of the TOF signals is~π and the corresponding coherence decreases to the noise level,i.e.=2.13 m.Thus,the width of the magnetic island is calculated asw=i.e.w=2.4 cm,which is in agreement with the ECE measurements (w~ 2.3 cm).
4.Detection algorithms for the rational surface by profile reflectometry
4.1.Cross-correlation and gradient threshold (CGT) method
It is well known that most of the MHD instabilities grow dominantly close to the rational surface,especially at the surface ofq=m/n=1,1.5,2 and 3.As previously mentioned,the formation of the MHD instabilities could induce a local flattening in the density profile which can lead to a significant change in the gradient length of the refraction index;then the local flattening results in an obvious TOF ‘jump’ in the reflectometry.Therefore,the detection of the TOF ‘jump’ can identify one or several rational surfaces where MHD instabilities occur,whereas it cannot give any information about the rational surfaces if there are no MHDs.
In ASDEX,a first proof-of-principle demonstration of the use of the phase fluctuation of fixed-frequency reflectometry as the monitor of the low-order rational surfaces(q=1.5 and 2) was presented,finding a significant enhancement of the phase fluctuation due to the presence of the islands [27].However,it is not possible to obtain independent knowledge of the rational surface positions using fixedfrequency reflectometry alone.It also should be noted that not only are the rational surfaces with MHD instabilities identified,but also a clear peak by the MHD in theq=3/2 surface is found by reflectometry.In Tore Supra,it was further proven that FMCW reflectometry can provide a simultaneous measurement of the density profile,the magnetic island and the corresponding rational surface through the TOF signals.A detection algorithm,the gradient threshold (GT) method,was developed to detect the rational surface by setting an empirical threshold in the TOF gradient,i.e.When the absolute value of the TOF gradient exceeds this threshold,the MHD modes are assumed to appear and the corresponding radial positions of the rational surface are located at the positions where the maximums of the TOF gradient occur.It was found that theq=1 or 2 surfaces detected by the GT method showed a good agreement with theq-profile calculated by the CRONOS code [10].
However,the GT method also has the following disadvantages: (a) this method sometimes can lead to a large numerical error especially in the plasma edge as the turbulence level can generate random events [28];(b) this method cannot distinguish between the edge transport barrier (ETB)and the MHD behavior,as the pedestal structure can also induce a significant change in the density gradient [29];(c) this method cannot distinguish between the MHD behavior and the internal transport barrier (ITB),which can also show an obvious TOF ‘jump’ near the ITB foot [19].Considering that the most typical characterization of the MHD instability is its mode frequency in the laboratory frame (fm),a new improved algorithm,the cross-correlation and gradient threshold (CGT) method was then developed in this work for a more accurate localization of the rational surface.
The kernel of the CGT method is to combine the spatial characteristics (i.e.the TOF ‘jump’) and the temporal periodicity of the TOF signals statistically.This is done during a fixed time window by using cross-correlation analysis between the TOF signals at different positions and a reference signal (e.g.the TOF signal itself or the ECE or the MP signal).Similarly,a coherence threshold (γcoherence) is added in the CGT method.Only if the TOF gradient is greater thanand the coherence within the mode frequency range is greater than γcoherenceare the MHD modes and the corresponding rational surface positions considered located.Figure 6 shows an example of the comparison results between the GT and CGT methods for the detection ofq=1 surface when the 1/1 kink mode appears (#80733).As shown in figure 6(a2),the conventional GT method has a large number of misjudgment events at the plasma edge aroundR=2.15-2.3 m.Instead,the CGT method developed in this work can avoid these errors well (figure 6(b2)).Therefore,compared to the GT method,the CGT method has a better performance with a much lower misjudgment rate.
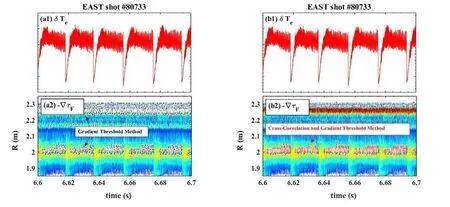
Figure 6.Comparison of the rational surface detection algorithms between the gradient threshold (GT) method (black points) and the crosscorrelation and gradient threshold (CGT) method (red points): time evolution of (a1)-(b1) temperature perturbation (δTe) from ECE measurement;(a2)-(b2) TOF gradient (dτF/dR) during the 1/1 kink modes.
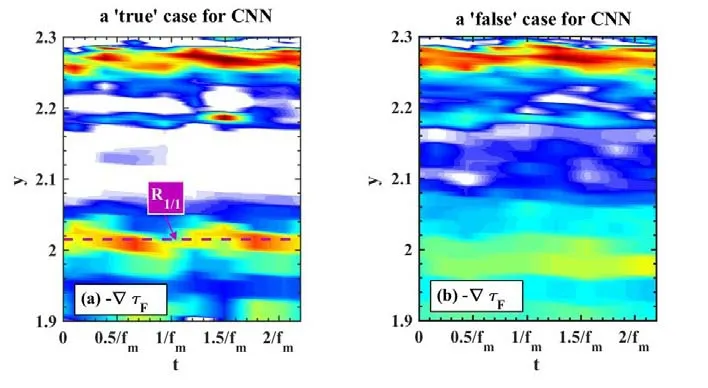
Figure 7.Examples of training samples for the 2D convolutional neural network (CNN): (a) the ‘true’ case;(b) the ‘false’ case.The training label in (a) is set to the positions of the rational surface given by the CGT method (the dashed line) and in (b) to 0.
4.2.2D convolutional neural network (CNN) model for adaptive localization
Furthermore,it should be noted that the performance of the GT and CGT methods strongly depends on the artificial value of the threshold (i.e.and γcoherence).Cross-correlation analysis in the CGT method will introduce more manually adjustable parameters,e.g.number of ensembles and Fourier points,MHD frequencies,filter function and sliding window length.Under different plasma parameters,the optimal thresholds and the adjustable parameters may,as expected,be very different and must be changed manually.Therefore,a new algorithm based on a 2D convolutional neural network (CNN) model is presented to achieve a more intelligent,adaptive rational surface detection with an improved accuracy compared to the CGT method.
The CNN model is trained in a supervised manner by using the 2D TOF gradient data as the data set and the localization results of the CGT method as the training label.The duration for each sample in the data set is~2/fm,wherefmis the mode frequency.There are two types of case in the data set,i.e.the ‘true’ case and the ‘false’ case.As figure 7(a)shows,in the ‘true’ case,two perturbations of the TOF gradient by the MHD modes can be clearly observed in the core.In the ‘false’ case,however,the periodic structures are not visible as the MHD mode is not present and the corresponding positions fail to be located (i.e.set to 0 in figure 7(b)).
In other words,the CNN model treats the image data(e.g.figures 7(a) and (b)) and mode frequency as inputs and a likelihood distribution of 50 radial locations as output.The original data set contains 3948 cases,of which~90% are training data and~10% are validation data.The location with the highest probability is predicted to be the rational surface,while an output of 0 indicates that MHD mode is not found.The structure of the CNN model is defined by the Python library Keras and the TensorFlow backend [30].To improve the generalization for the CNN model,the TOF perturbation pattern is randomly shifted from the core to the edge and a new case can be created with the shifted location of the rational surface.This allows the number of the extended data set to be increased from 3948 to 99162.
Figure 8 shows an example of the localization results by the CNN model,which is the same example as given in figure 6.As the green points show in figure 8,the localizations of theq=1 surface can be well reproduced by the CNN model due to the perturbation of the 1/1 kink mode for each ST cycle.It can be found that both the CGT method and the CNN model are able to track the location of the rational surface,ignoring the random event in the edge.However,the CNN model can have a much smaller error and an improved precision for the rational surface localization compared to the CGT method.Figure 8(c) shows the corresponding probability distributions of these methods for theq=1 localization,which shows that the error standard deviations are 0.114 m (GT method),0.019 m (CGT method) and 0.006 m (CNN model).
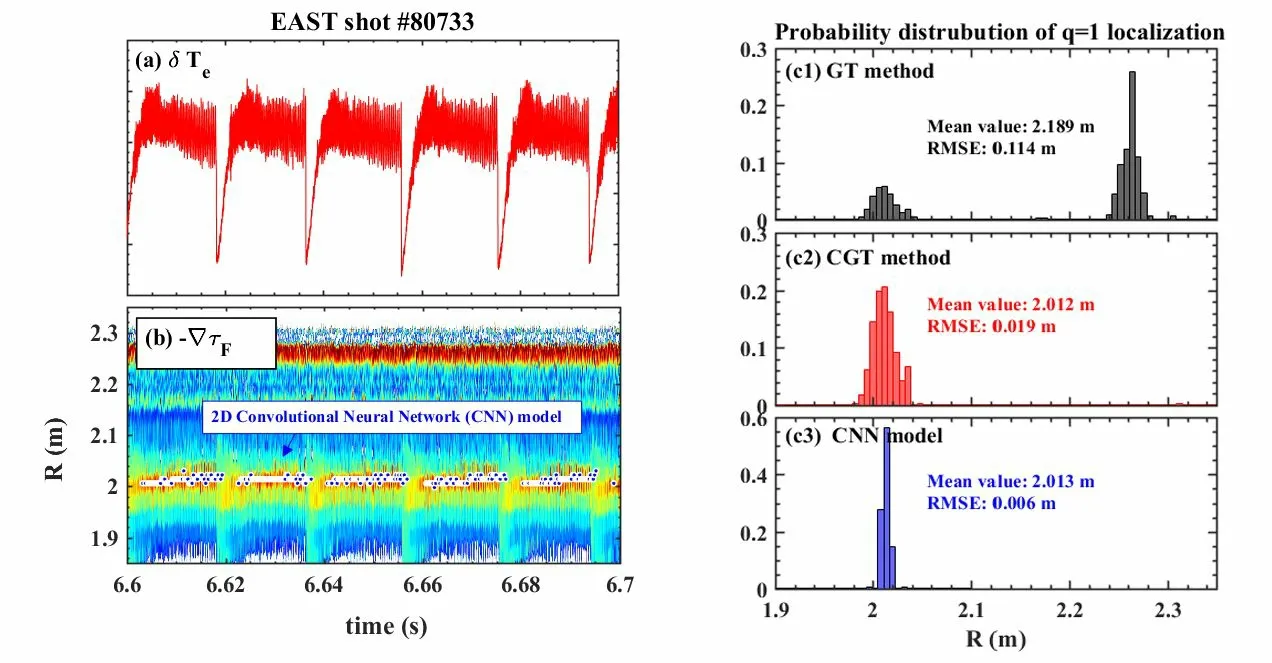
Figure 8.Time evolution of (a) temperature perturbation (δTe) from ECE measurement;(b) TOF gradient (dτF/dR) during the 1/1 kink modes.The blue points in (b) indicate the localization results of the rational surface (q=1) by the 2D convolutional neural network (CNN)model.(c1)-(c3) Probability distributions of q=1 localization by (c1) GT method,(c2) CGT method and (c3) CNN model,respectively.
It should be noted that the settings of the CGT method are based on artificial experience and the results are also highly dependent on the setting parameters.In contrast,the CNN model,which was well trained,only needs the MHD frequencies as the prior and it can be easily obtained from the TOF signal or the magnetic measurement.Therefore,the CNN model has better generalization ability,localization accuracy and robustness,which will be beneficial for future real-time detection and experimental device operation.
5.Summary
To summarize our work,the spatial and temporal characteristics of the TOF signal from profile reflectometry measurements associated with the MHD instabilities are investigated in both full-wave simulation and experiment on the EAST tokamak.A 1D O-mode full-wave code is developed to simulate the measurement principle of profile reflectometry,which indicates an obvious discontinuity of the TOF signal(i.e.the TOF ‘jump’) in the radial position accompanied by a significant change of the reflect amplitude due to the appearance of the local density flattening.
The temporal-spatial evolution of TOF signal for three different types of MHD instability (sawtooth,sawtooth precursors and tearing mode) is studied in detail and shows similarities and differences as follows:
(a) Sawtooth instability: the evolutions of the TOF signals show a ‘negative’ and a ‘positive’ sawtooth inside and outside the inversion radius during the ST crashes.
(b) Sawtooth precursors (1/1 kink mode): the perturbation of the TOF signals in the low ‘pe’ case is much larger than in the ‘high’pecase and the ST crashes.
(c) Tearing mode: the TOF ‘jump’ inside the islands reaches the maximum in the ‘O-point’ phase and an enhancement of the reflect amplitude at the outer separatrix is clearly observed,which agrees well with the 1D full-wave simulation.
In addition,the characteristics of a high-frequency MHD mode below the frequency of 1/(2Tsweep),such as mode amplitude and island width,can also be obtained from the cross-correlation analysis.The experimental results indicate that TOF signal analysis of the MHD behavior has the advantages of being simpler,more localized and more accurate than the reconstructed density profile.This provides an additional means of simultaneously measuring the plasma perturbation from the edge to the core for the fusion plasma.
Experimental analysis of the local maximum of the TOF gradient due to the MHD activity allows for a precise determination of the rational surfaces (q=1,2) and the width of the rotating magnetic island,which is in agreement with the ECE measurements.Two novel algorithms,the cross-correlation and gradient threshold (CGT) method and the 2D convolutional neural network approach (CNN) are proposed for the rational surface localization.Compared to the conventional gradient threshold (GT) method,the results show that both the CGT method and the CNN model show superiority in localization accuracy,and the result of the CNN model indicates that the neural network technique may provide a much more robust and precise localization without requiring manual intervention.A neural network for the island width estimation will be investigated in future work.These results suggest that fast-sweeping frequency reflectometry can provide direct information on the low-order rational surface with a high signal-to-noise ratio,which may shed light on MHD control andq-profile control in the advanced tokamak operation.
Acknowledgment
The authors would like to acknowledge the help of Yuqi CHU for theq-profile.The authors would like to thank Ang TI and Yan CHAO in EAST for the helpful discussions.This work has been supported by the Open Fund of Magnetic Confinement Laboratory of Anhui Province (No.2023 AMF03005),the China Postdoctoral Science Foundation(No.2021M703256),the Director Funding of Hefei Institutes of Physical Science,Chinese Academy of Sciences(No.YZJJ2022QN16),the National Key R&D Program of China (Nos.2022YFE03050003,2019YFE03080200,2019Y FE03040002,and 2022YFE03070004),National Natural Science Foundation of China (Nos.12075284,12175277,12275315 and 12275311),the National Magnetic Confinement Fusion Science Program of China (No.2022YFE03040001) and the Science Foundation of the Institute of Plasma Physics,Chinese Academy of Sciences (No.DSJJ-2021-08).
猜你喜欢
杂志排行

Plasma Science and Technology的其它文章
- Forward modelling of the Cotton-Mouton effect polarimetry on EAST tokamak
- First results of CO2 dispersion interferometer on EAST tokamak
- Reconstruction of poloidal magnetic field profiles in field-reversed configurations with machine learning in laser-driven ion-beam trace probe
- Electron density measurement by the three boundary channels of HCOOH laser interferometer on the HL-3 tokamak
- Development of a toroidal soft x-ray imaging system and application for investigating three-dimensional plasma on J-TEXT
- Inward particle transport driven by biased endplate in a cylindrical magnetized plasma