Forward modelling of the Cotton-Mouton effect polarimetry on EAST tokamak
2024-04-06MinyongSHEN沈敏勇JiboZHANG张际波YaoZHANG张耀YinxianJIE揭银先HaiqingLIU刘海庆JinlinXIE谢锦林andWeixingDING丁卫星
Minyong SHEN (沈敏勇) ,Jibo ZHANG (张际波) ,Yao ZHANG (张耀) ,Yinxian JIE (揭银先) ,Haiqing LIU (刘海庆) ,Jinlin XIE (谢锦林) and Weixing DING (丁卫星),*
1 School of Nuclear Science and Technology,University of Science and Technology of China,Hefei 230026,People’s Republic of China
2 Institute of Plasma Physics,Chinese Academy of Sciences,Hefei 230031,People’s Republic of China
Abstract Measurement of plasma electron density by far-infrared laser polarimetry has become a routine and indispensable tool in magnetic confinement fusion research.This article presents the design of a Cotton-Mouton polarimeter interferometer,which provides a reliable density measurement without fringe jumps.Cotton-Mouton effect on Experimental Advanced Superconducting Tokamak (EAST) is studied by Stokes equation with three parameters (s1,s2,s3).It demonstrates that under the condition of a small Cotton-Mouton effect,parameter s2contains information about Cotton-Mouton effect which is proportional to the line-integrated density.For a typical EAST plasma,the magnitude of Cotton-Mouton effects is less than 2 π for laser wavelength of 432 µm.Refractive effect due to density gradient is calculated to be negligible.Time modulation of Stokes parameters (s2,s3) provides heterodyne measurement.Due to the instabilities arising from laser oscillation and beam refraction in plasmas,it is necessary for the system to be insensitive to variations in the amplitude of the detection signal.Furthermore,it is shown that non-equal amplitude of X-mode and O-mode within a certain range only affects the DC offset of Stokes parameters (s2,s3) but does not greatly influence the phase measurements of Cotton-Mouton effects.
Keywords: EAST,Cotton-Mouton effect,polarimeter interferometer,electron density measurement,Stokes vector
1.Introduction
The purpose of this paper is to propose a method for continuous and reliable high-precision measurements of plasma electron density [1] using a polarimeter interferometer [2]based on the Cotton-Mouton effect (hereafter abbreviated as CM) on EAST tokamak or on future fusion devices.This measurement can provide key information for density control of magnetic fusion reactors [1].Unlike conventional interferometers that require time accumulation for phase wrap-up,the CM effect induces a phase shift of approximately 15 degrees on the central chord of EAST when a wavelength of 432 µm is chosen,effectively compensating for the disadvantage of fringe jumps when the phase difference exceeds 2 π after the interruption and reconnection of the interferometer signal [3].To guarantee the density accurate measurement,CM effect-based polarimetry can be operated simultaneously with an interferometer that employs the same probing beam [4].Furthermore,due to the instabilities arising from laser oscillation and beam refraction in plasmas,the system is designed to be insensitive to variations in the amplitude of the detection signal [5].
There are two types of polarimeters: those based on the Faraday rotation (hereafter referred to as FR) effect and those based on the CM effect [6].These magneto-optical effects depend on the magnetic field aligned parallel or perpendicular to the propagation direction of electromagnetic waves in the plasma [4],respectively.Therefore,the choice of one of these effects depends on the optical beam path.For density measurement,the Faraday rotation effect is not suitable due to variation of magnetic field parallel to the beam path in poloidal section.Hence,the CM polarimeter becomes a good option for high density measurement without fringe jump [7].This paper limits the configuration to within a poloidal section.
In the context of superimposed elliptical modulation,achieving exacting power equality between two orthogonal laser beams can be nearly impossible [8].This study aims to demonstrate that,even under this condition,accurate measurements of the relatively small CM effects can still be obtained through a phase comparator,while remaining insensitive to changes in the detection signal amplitude.Furthermore,we elucidate the rationale behind selecting radiation with wavelengths falling within the far-infrared(FIR) range.Although a Cotton-Mouton polarimeter has recently been developed on the Compact Helical System(CHS) [4] and is proposed for the International Thermonuclear Experiment Reactor (ITER) [9],its applications are fewer than those of Faraday polarimeters.We will develop a CM effect polarimeter system that utilizes a 432.6 µm formic acid laser on EAST tokamak.In section 2 we introduce typical parameters of EAST plasma and present some optical quantities related to polarimetry.In section 3,we utilize Stokes equation and Mueller matrix to investigate evolution of polarization of lasers in EAST plasma.By using time modulation of Stokes parameters,one can determine elements of Mueller matrix which relates to plasma parameters.In section 4,we study the coupling between FR effect and CM effect.An explicit nonlinear relationship is proposed between CM phase shift and χ for phase difference not much less than one.Section 5 provides a brief summary.
2.The propagation of electromagnetic waves on EAST tokamak
2.1.EAST plasma
EAST is a magnetic confinement tokamak fusion device,with a plasma major radius of approximately 1.9 m,an average minor radius of approximately 0.45 m,and a magnetic field strength of about 2.4 T along the magnetic axis.Currently,there are five vertical ports in EAST device,evenly spaced at intervals of 90 mm in theR-direction,located atR=1640 mm,1730 mm,1820 mm,1910 mm,and 2000 mm,respectively.The vertical port atR=1910 mm approximately passes through the magnetic axis.The laser beam is injected from the upper port and detects the lineaveraged electron density at the lower window of the device.
The magnetic configuration of EAST shot #98958 at 21 s is shown in figure 1,where the red dashed line represents the last closed magnetic surface.A right-handed orthogonal coordinate system is established,with the vertical direction defined as theZ-axis,the direction from the high-field side to the low-field side in the major radial direction as theXaxis,and the toroidal direction as theY-axis.In the simulations performed in this study,the incident position is set within the range ofR0∈(1640 mm,2000 mm).
x0is defined as
The vertical channel passing through the magnetic axis is defined asx0=0,which corresponds to the range ofx0∈(-270 mm,90 mm)in the minor radial direction.Electron density (ne) and toroidal magnetic field distribution(Bt) for EAST shots # 71320 at 3.3 s and #98958 at 21 s are shown in figures 2 and 3,respectively.
2.2.Elliptical polarization of laser beam [8]
In order to study the evolution of the polarization state of electromagnetic waves in magnetized plasmas,the following conventional quantities are introduced to describe the elliptical polarization state of a laser beam.
A top view of elliptical polarization of laser beam is shown in figure 4,where beam propagates along the negative direction of theZ-axis defined in figure 1.
In the electric field coordinate systemX-Y,α is the arctangent of the ratio of electric field amplitude in theYdirection to that in theXdirection.
Generally,along the propagation direction,the projection trajectory of the polarization electric field vector’s endpoint onto theX-Yplane is an ellipse.Polarized ellipse in the elliptical coordinate systemX′-Y′,χ is the ellipticity,referred to as the arctangent of the ratio of the short axis of the ellipse to the long axis
ψis the azimuthal angle of the polarization plane,referred to as the angle between the long axis of the ellipseX′and theX-axis in the electric field coordinate system.ψFRis the change in the angle of the polarization plane due to Faraday effect
Plasma can be viewed as an anisotropic birefringent medium.The mode of the electromagnetic wave in which the electric field is parallel to the magnetic field direction is the O-mode,while the X-mode is perpendicular to the magnetic field.The passage of linearly polarized light through birefringent medium results in ellipsoidalization,known as the Cotton-Mouton effect.
Upon entering a plasma,incident polarization states will all split into fast and slow modes,each with distinct optical path lengths upon exiting.The term “fast” indicates a smaller optical path length.The slow state is delayed relative to the fast state,and this delay is due to the difference in optical path lengths,which describes the relative phase change between the two states [10].
As shown in figure 5,a retarder splits light into two linearly orthogonal polarized components.Half-wave linear retarder delays one of the linearly polarized components by half a wavelength and is useful for changing the direction of linearly polarized light.With a vertical fast axis (lower refractive index),the component perpendicular to the magnetic field direction is referred to as the ‘X-mode’.The X-mode enters the half-wave plate along the fast axis and undergoes 2 and 1/4 cycles.The O-mode,on the other hand,traverses 2 and 3/4 cycles along the slow axis,resulting in a phase delay of π.Their combined light transforms from rightcircularly polarized light to left-circularly polarized light.
As shown in figure 4,an inscribed circle can be constructed using the length of the minor axis of the ellipse as its diameter.Constructing a line parallel to lineX′and passing through point A,let AC be parallel toX′.Similarly,constructing another line parallel to lineX′and passing through point B,let BD be parallel toX′.These lines intersect the inner circle at points C and D,respectively.The angle ∠COD is geometrically referred to as the eccentric anomaly and is denoted as δ.It is also known as the orthogonal electric vector phase. δCMis the change in the orthogonal electric vector phase angle due to the CM effect [11].
where the constantCCMB⊥is perpendicular to the direction of light propagation of the magnetic field.WhenB⊥,ne,λ andlare expressed in SI,CCMhas a numerical value of 2.4568×10⁻¹¹,the unit of δCMis rad.
Figure 6 illustrates the phase shift of the CM effect in theX-direction for each chord.The maximum phase shift of the CM effect does not exceed 20°,thus avoiding the occurrence of fringe jumps that would result from exceeding 2 π.
To achieve a phase shift magnitude of approximately 20°the wavelength of the far-infrared laser was chosen as 432.6 µm.According to equation (5),figure 7 illustrates that the phase shift is proportional to the cube of the wavelength.Due to the refractive effect,the plasma region traversed by the same chord slightly varies at different wavelengths,so the curve in this figure is not strictly a cubic function.
Plasma can exhibit refractive effects due to density gradients.The propagation of light,as described by Born in[12],is governed by Snell’s Law,which relates the incident angle (θ1) and the refracted angle (θ2) to the absolute refractive indices of the two media,denoted asn1andn2:
This law describes the relationship between the angles of incidence and refraction when light passes from one medium to another.By calculating the refractive index vector at each spatial step and determining the displacement after passing through the plasma,the quasi-optical deviation caused by the presence of plasma is inferred.This displacement must be kept as small as possible so that probing beam can exit from vacuum windows for signal detection.
119 µm represents the CH3OH laser,195 µm represents the DCN laser,337 µm represents the HCN laser,432.6µm represents the CH3COOH laser,and 462 µm represents the solid source.figures 8 and 9 use data from shot #71320,which can be observed that the wavelength does not change the trend of lateral offset and phase shift.However,due to the proportional relationship between phase shift and λ3,the wavelength significantly affects the magnitude of the measured values.When the wavelength is smaller than the chosen wavelength of the formic acid laser in this paper,the peak phase shift is less than 10°,which will affect the resolution of the polarimeter interferometer [13].
Figure 9 illustrates the variation in the magnitude of transverse displacement caused by the refractive effects in each channel along theX-direction,which is on the order of millimeters.After consulting the engineering drawings,it was determined that the diagnostic window has a diameter of 70 mm.During the discharge,the laser generates a refraction of approximately 2 mm,and the far-infrared laser spot diameter is around 30 mm.As long as the optical alignment is accurate on the tabletop during experiments,it can be observed that the currently selected wavelength meets the requirements of the diagnostic window size in EAST,enabling the reception of laser signals emitted in the opposite direction.
When the probe beam is incident vertically,B⊥is equivalent toBt,which is approximately constant along the∫ light path,as shown in figure 3.The density chord integraldlis measured using the interferometer at EAST.The CM effect along this chord is calculated by transforming it through equation (5),as δCM=so the measurement of electron density along the central chord of the poloidal section in the plasma is most appropriately performed using a vertical port CM effect polarimeter interferometer.It can be seen that the phase shift of the CM effect is expected to be around 15° throughout the EAST discharge,a vertical-view Cotton-Mouton polarimeter interferometer is capable of providing reliable density measurement.In figure 10,there is a sharp and brief density jump att=73 s,which is caused by the interferometer’s fringe jump,and the CM effect polarimeter interferometer will effectively circumvent this anomaly.
The CM effect acts directly on the phase shift change dδCM,which leads to the ellipticity χ change through equation (7)[8].
Figure 11 illustrates the noticeable variations in ellipticity along the central chord,demonstrating the theoretical feasibility of measuring the CM effect through the ellipticity information carried by the polarized ellipse.
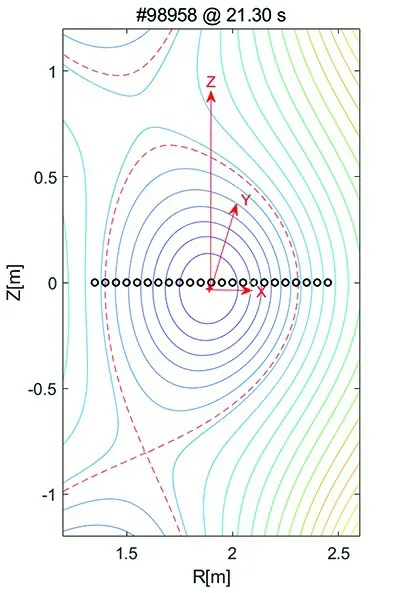
Figure 1.Diagram of the definition of the coordinate system.Blue line represents the flux surface.Red dashed line represents the last closed magnetic surface.
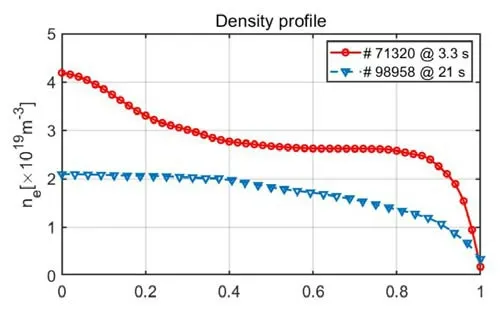
Figure 2.The typical distribution of ne in the poloidal section for EAST shots #71320 and #98958,where ρ represents the normalized magnetic flux.
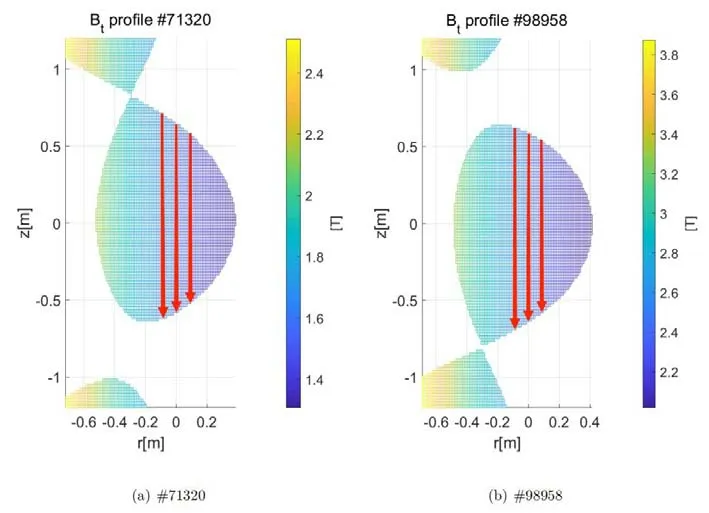
Figure 3.The typical distribution of Bt in the poloidal section for EAST shots (a) # 71320 and (b) #98958.Display only the portion of normalized magnetic flux that is less than or equal to 1.The red arrow indicates the approximate location of viewing chords.

Figure 4.Schematic representation of α,δ,χ and ψ in the polarization ellipse.
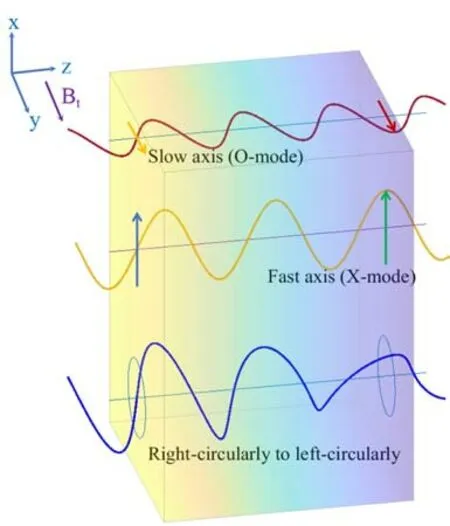
Figure 5.A schematic representation of polarized light entering a birefringent medium -a linear half-wave plate,depicting the phase delay.Three states of polarized light from top to bottom are the the O-mode,X-mode,and their combined light.
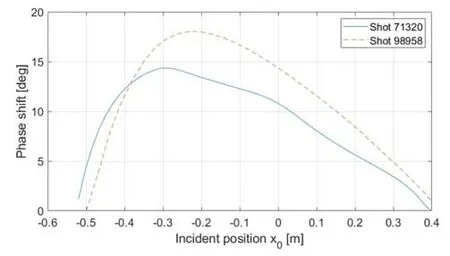
Figure 6.Phase shift of CM effect in the X-direction channels,where the horizontal axis represents the position of the incident laser.The solid line represents shot #98958,and the dashed line represents shot #71320.

Figure 7.The relationship between the phase shift of the CM effect along the central chord and the wavelength of far-infrared laser.The black dot represents the selected wavelength of 432.6 µm.
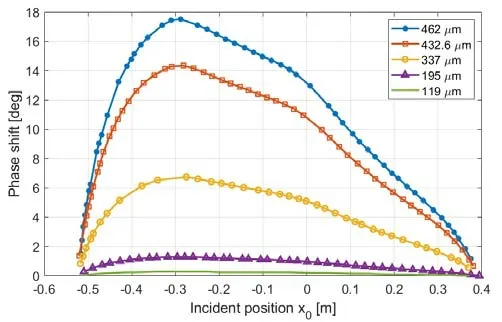
Figure 8.The relationship between phase shift and incident position under different laser wavelengths (shot #71320).
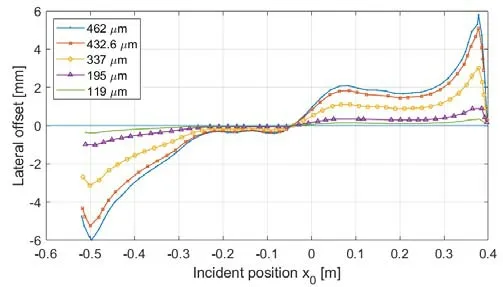
Figure 9.The relationship between the incident position and the lateral offset under different laser wavelengths (shot #71320).
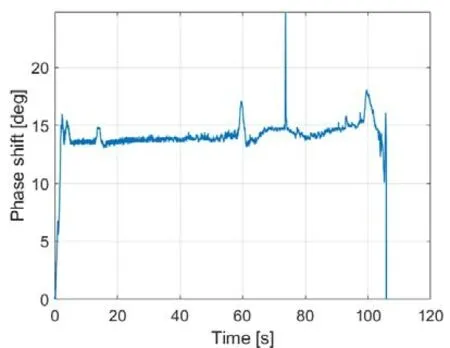
Figure 10.CM effect transformed with time,where the string integral of the density is given by a solid source interferometer arranged in the centre channel.The Bt approximation is considered equal along the course and is regarded as the magnetic field at the magnetic axis.The wavelength is taken to be 432.6 µm (shot 98958)
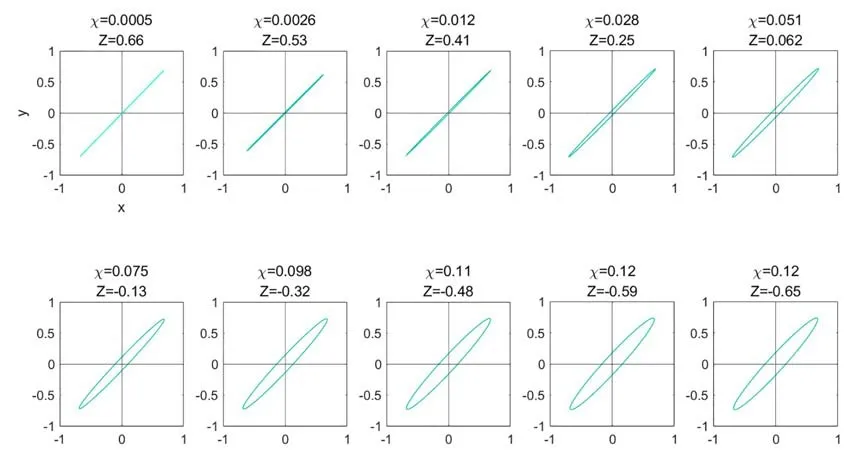
Figure 11.The schematic diagram depicting the variation of the polarized ellipse along the central chord,where the abscissa represents Ex and the ordinate represents Ey.
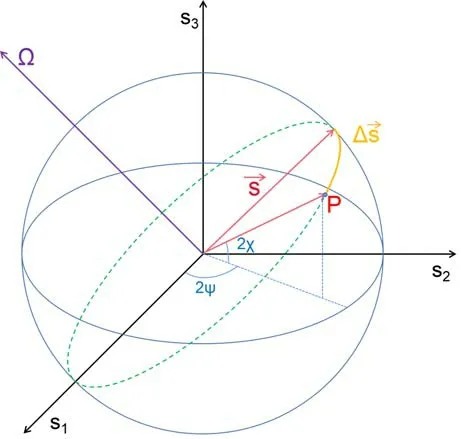
Figure 12.Stokes parameters map the polarization state to a point on the Poincaré sphere,which is a unit sphere in an abstract 3-D space.
Two concepts should be clarified here.The term “orthogonal” in the context of orthogonal electric vector phase refers to the perpendicular relationship in theX-Ycoordinate system of the electric field.The polarization ellipse is the trajectory traced by the endpoints of the electric field vector after one cycle,i.e.,a 360° change in the phase angle.From the extremal point B ofExto the extremal point A ofEythrough a certain phase angle,which is the mapped ∠COD,not necessarily 90°,so-called “quadrature”.CM effect δCMacts directly on the change of phase angle of the orthogonal electric vector,which is a concept of polarization optics.The“phase angle” here is not equivalent to the phase change of the light intensity.
3.Evolution of polarization state based on Stokes equation
As discussed above the measurement of polarized ellipse is non-trivial,it requires two measurements ofExandEy.Accurately measuring the absolute electric field amplitude can be very challenging.Instead the signal is modulated to incorporate the information of the CM effect within the phase difference of the Stokes parameters.One can modulate the polarized ellipse in time so that phase difference betweenExandEycan be determined.In this section we utilize Stokes equation,Jones vector and Mueller matrix to describe evolution of polarization state in EAST.By detecting Stokes parameters one can determine plasma density,magnetic field.
3.1.Description of the polarization state of electromagnetic waves based on the Poincaré sphere
The purpose of introducing Stokes parameters is to provide a mathematical representation of the polarization state of electromagnetic waves.Stokes parameters encompass polarization characteristics such as intensity,degree of polarization,and polarization ellipse orientation.They enable a quantitative description and analysis of the polarization state of light[14].
Introducing the Poincaré sphere with a unit radius of 1 in the (s1,s2,s3) space facilitates the study of polarization,as depicted in figure 12.Here,all possible polarization states(ψ,χ) are uniquely mapped by points P on the unit sphere surface.Establishing an orthogonal Cartesian coordinate system with the center of the sphere as the origin,the three directional components can be represented using a one-rowthree-column matrix of Stokes parameters,corresponding to a latitude of 2 χ and a longitude of 2 ψ.
The normalized Stokes parameters can be defined as [15]
Two orthogonal polarizations are represented by antipodal points on the equator of the Poincaré sphere.Taking the X and O beams under investigation in this paper as examples,the horizontal polarization is characterized by the Stokes parameterssH=(1,0,0),and the vertical polarization is characterized bysV=(-1,0,0).When polarizations propagate through a homogeneous non-absorbing medium,they experience different characteristic refractive indices,denoted as µ1and µ2,respectively,satisfying µ1>µ2.
Ωrepresents the angular velocity of the rotation of the Stokes parameters on the Poincaré sphere [16].The fast axis aligns with the direction of the Ω vector,passing through the two points on the Poincaré sphere that represent the characteristic orthogonal polarizations,sHandsV.An introduction to the fast axis can be found in figure 5.Therefore,the evolution of polarization can be expressed by a vector equation [17].
Here,the magnitudes ofCFRandCCMare given by equation(4) and equation (5),respectively; Ω1,2,3represent the angular velocities of the Stokes parameters rotating around thes1,2,3axes,and each component is contributed by the CM effect dδCM,cross-terms,and the FR effect dψFR.The quantities Ω1,2,3reflect the optical properties of the plasma medium.By setting an appropriate incident laser polarization direction and measuring the changes in polarization optical quantities,Ω1,2,3can be determined,providing information about plasma density,magnetic field,and other parameters.
Figure 13 illustrates when the central chord of the light beam varies along the negative direction of theZ-axis,the impact of the CM effect on three components of the Stokes parameters.The initial Stokes parameters are given by the superposition of horizontally and vertically linearly polarized light,i.e.,s(z=0)=(0,1,0).The variation in the amplitude ofs3is -0.2444 rad,which can be determined through the ∫ vector cross product in equation (10) . Since,the CM effect on EAST can be approximated ass3=0.2508 rad,relating plasma parameter.

Figure 13.The variation of the Stokes parameters along the central chord when the central chord of the light beam varies along the negative direction of the Z-axis.
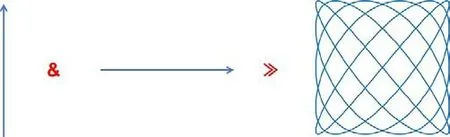
Figure 14.Addition of equal horizontally and vertically polarized beams with a 20 % frequency difference yields a time-varying polarization state [10].
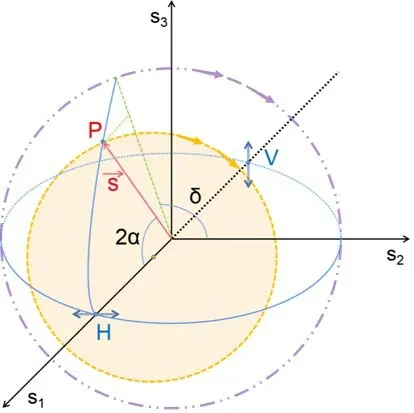
Figure 15.Schematic diagram of elliptical polarization modulation trajectory under different transmission ratio conditions by superimposing X-mode and O-mode.
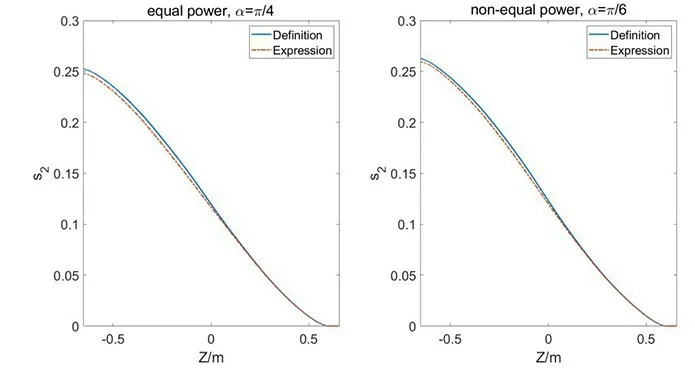
Figure 16.Comparative analysis of the time modulation of s2 (equation (27)) and the simulation results based on definition (equation(10)).The comparative analysis of the simulated results for time modulation of s2.The left plot represents equal power ratio transmission,while the right plot represents non-equal power transmission.
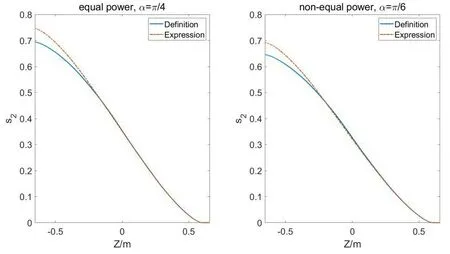
Figure 17.In the case of a significant CM effect (×3),comparative analysis of the time modulation of s2 (equation (27)) and the simulation results based on definition (equation (10)).The left plot represents equal power ratio transmission,while the right plot represents nonequal power transmission.

Figure 18.Schematics of the optical arrangement of the CM polarimeter.
3.2.Derivation of elliptical modulation based on Jones vectors
For application of polarized ellipse time modulation technique,we present the time-dependent Stokes parameter using Jones vectors.From equation (8),it can be observed that the Stokes parameters represent the temporal ensemble average of the orthogonal components of the electric field and cannot reflect the frequency modulation of a single beam of light.Therefore,the Jones vector representation is introduced,which employs a 2 ×1 matrix to represent thexandycomponents of the electric field [17],
The electric field resulting from the superposition of the Xmode and O-mode is
where,Δω=ω2-ω1represents the intermediate frequency of the X-mode and O-mode,and the subscript ‘a’ denotes the amplitude,and δ1and δ2are initial phases for each component.From equation (2),the amplitude ratio α can be obtained as
The parameter α is a constant that is solely related to the ratio of the transmitted power. Furthermore,sinces1=cos(2α),the trajectory of elliptical modulation is reflected on the Poincaré sphere as a constant value ofs1.Phase difference
the trajectory of the modulation process on the Poincaré sphere is represented by a circle drawn from the periodic variation of the phase angle.
In figure 14,the end of the electric field vector traces a more complex shape,which can be interpreted as a timevarying polarization state resembling an evolving ellipse.This distinctive shape is known as a Lissajous figure,which is formed by the parametric equation.To a Stokes polarimeter,this beam appears as unpolarized light and cannot be distinguished.
From equation (8),the Stokes parameters of the synthesized light resulting from the superposition of horizontal and vertical polarization modulation can be obtained as
Non-uniform power emission will introduce deviations in the intensity amplitude of the measurement by affecting the magnitude ofs1.The elliptical modulation trajectory under different transmission ratio conditions is shown in figure 15,represented by a series of circles with their centers falling on thes1axis.The standard form in an orthogonal Cartesian coordinate system between the variabless2ands3can be written as:
which is represented by the yellow dashed line.In general,there exists a nonlinear relationship between Δχ and δCM.
Specifically,when two orthogonally polarized beams are equally transmitted with equal power,i.e.,EaX=EaOor tanα=1,from equation (7) it can be deduced that δ and ellipticity χ have a linear relationship.The relationship between the variabless2ands3is defined by the equationsin2(2×45°),forming a meridian loop byψ=90°and ψ=-90°.The circle can be analogously compared to geographical east longitude 90° and west longitude 90°,as i ndicated by the purple dashed line in figure 15.
3.3.Approximate analytic solutions ofs2
The output polarization state can be characterized using either Stokes parameters or,equivalently,ψ and χ.The former is often more convenient since the detector signals are directly related to the three components of the Stokes parameters.For the design and analysis of polarization measurements,the Mueller matrixMis required to comprehensively describe the effects of optical components or plasma media on the polarization state [18].This matrix is the characteristic of plasma (density and magnetic field etc).The output Stokes vector relates to Mueller matrix (plasma parameters) as the following expression [17]:
Due to the non-commutativity of the Mueller matrices for the two effects,it is not possible to simply integrate each effect separately to calculate the total effect.Therefore,when both effects are strong,the coupling cannot be separated[19].When at least one of the two effects is small,approximate analytic solutions of the evolution equation can be obtained.When the FR effect is small,we consider two cases for discussion: the CM effect where δCM≪1 or δCM~1 .The dimensionless parametersW1,2,3are used for analysis [17].
The parametersW1,2,3correspond to the CM effect δCM,the cross term,and the FR effect ψFRrespectively.(1)W1,2,3≪1
According to equation (18),Asatisfies the following equation:
where now
where the components of the matricesM(1),M(2),M(3)··· are given by
where again repeated indices imply summation [20].
When the plasma effect is small,the Mueller matrix can be expanded to second order,
For a tokamak having up/down symmetry with respect to the equatorial plane,the following relations hold:W2=0,W13=W31=W12=-W21,andW23=-W32.These relations are investigated under the assumption that≪1 and≪1,therefore [17],
Based on equations (16) and (18),and using the the auxiliary angle formula,the second components2of the Stokes parameters can be expressed as follows:
So,multiplyingM21by the constant cos2α only affects the DC offset ofs2,while multiplyingM22andM23by terms involving (Δωt) affects both the amplitude and phase ofs2.
The Stokes parameters2of laser polarization state after plasma is modulated at frequency (Δω).It contains information about the chord integralW1,The phase ofs2does not include quantities related to the power ratio α.One can determineW1by phase measurement instead of amplitude measurement (sin2α).In the process of orthogonal superposition signal radiation,the (Δωt) changes while α remains constant.The simplest case isEax=Eay,α=π/4,where two laser radiations have equal power.
The errors resulting from non-equal power radiation is discussed here.Furthermore,parameters in Mueller matrix may not be very small.These approximations can introduce finite corrections.A comparison is made between the definitional formula (equation (10)) and the computational formula(equation (27)) fors2,and the results are plotted in figure 16.Without loss of generality,we set the modulation phase(Δωt)to be 90°,the phase variation of the AC component is reflected in a larger amplitude variation.
In the case of non-uniform power emission,without loss of generality,the power ratio is assumed as α=Under equal power emission,the result from the definitional formula iss2d=0.252,while the result from the computational formula iss2e=0.248.Under non-uniform power emission,the result from the definitional formula iss2d=0.263,while the result from the computational formula iss2e=0.260.The errors introduced by neglecting higherorder terms in the computational formula are only -1.59%and -1.14% respectively.Now let us perform an order of magnitude analysis on the sources of error.As shown by equation (26),s2(z) consists of three terms,each containingM21,M22,andM23.The errors arise from neglecting terms of order three and higher,beyondM(3),in the derivation from equation (20) to equation (24).In the previous section,we assumed Δωt=90°,making the second term in equation (26)equal to 0.From equation (22) and equation (23),we can derive the expressions forwith respect toW
In equation (26),sinceWis always positive,whenα increases,the weight ofM23becomes greater,leading to an overestimation ofs2by neglectingConversely,when α decreases,the weight ofM21increases,resulting in an underestimation ofs2by neglecting
As previously mentioned,in the case of vertically incident CM effects on the poloidal section,the subscripts indicate that index 3 is attributed to CM effects and index 1 is attributed to FR effects. Therefore,|-W333|>|W111|,|-W322|>|W122|,|-W311|>|W133|.In other words,
This indicates that the error introduced when α takes a smaller value must not be greater than that introduced when α=π/4.
This indicates the feasibility of the proposed heterodyne measurement scheme with small errors.It can be understood that the non-equal power component only generates a DC offset of (W3-W21)cos2α and a signal attenuation of sin2α times at the mixer stage.It is important to emphasize that the derivation in this subsection cannot be extended to cases whereW1≪1 is not satisfied.
(2)W≈W1;W2,3≪1
For example,in the case of vertical propagation in a future tokamak,it may not always satisfy the condition|W1|≪1in practical scenarios.Now let us write the analytical expression for the first-order expansion ofs2(z) whenW~O(1).
Similarly to equation (26),the second components2of the Stokes parameters is given by [17]
where,
The derivation process of expandings2(z) to the first order whenW~O(1) is provided in Appendix A.
To simulate a larger CM effect,the typical toroidal magnetic field magnitudeBtis multiplied by a factor ofeffectively amplifying the CM effect by a factor of 3.figure 17 is plotted to illustrate the measurement under this scenario.Without loss of generality,we set the modulation phase (Δωt) to be 90°,the phase variation of the AC component is reflected in a larger amplitude variation.The power ratio α in the case of unequal power emission isthe same as in figure 16.
In the case of equal power emission,the result from the definition formula iss2d=0.694,while the result from the calculation formula iss2e=0.746.Similarly,in the case of unequal power emission,the definition formula yieldss2d=0.646,and the calculation formula yieldss2e=0.692.The errors introduced by neglecting higher-order terms in the calculation formula are +7.49 % and +7.12 % respectively.
If a longer wavelength laser is chosen to achieve a larger CM effect,this heterodyne measurement scheme will introduce larger errors.Moreover,the longer the wavelength,the more pronounced the refractive effect becomes,so the detector no longer receives the laser signal precisely at the center,leading to a decrease in signal-to-noise ratio.Therefore,in practical experiments,the CM effect is typically not allowed to become excessively large (around δCM~O(1)) during electron density measurements.
In summary,under the condition of non-equal power emission of orthogonal light,the superimposed elliptical modulation can still accurately measure relatively small CM effects through a phase comparator,while being insensitive to variations in the detected signal’s amplitude.In order to achieve an appropriate magnitude of the CM effect,the wavelength of the radiation used should fall within the far infrared (FIR) range.The error arises from neglectingand,so non-uniform power emission only affects the signal-to-noise ratio,with minimal impact on the calculation error of the CM effect phase.
3.4.Determination of Stokes vector
Elliptical modulation enables the direct measurement of δCMthrough the phase difference of the Stokes parameters.In this section,we will discuss the polarization optical components and their configurations in the polarization analyzer system.From equation (16),boths2ands3contain terms modulated with respect to (Δωt).
The intensity measurement ofs2can be performed without the presence of a waveplate.In principle,it is feasible to measures3as well.However,fors3measurement,a quarterwave plate needs to be installed in the optical path,requiring prior measurement of the waveplate’s absorption factor which involving additional effort [21].Therefore,we ultimately decide to measures2.
As shown in figure 18,the micro-displacement platform is used to adjust the length of the resonant cavity,ensuring that the frequency difference between the two laser sources is equal to the desired beat frequency.Modulating the orthogonal light generates an intermediate frequency signalIF~O(1 MHz),facilitating heterodyne measurement.One laser source emits linearly polarized light,which is passed through a half-wave plate to be orthogonal to the polarized light emitted by the other laser source.The beams are then combined,adjusted to a collinear state,and guided through an optical waveguide to the top of EAST device,where they are incident on the plasma.
Direct measurement cannot determine the value of a specific component.The power measured by the detectorID,is the weighted sum of the individual components of the Stokes parameters [8].
where,I0represents the intensity before passing through the polarizer,θ is the angle between the transmission axis of the polarizer and theX-axis.We set θ=45° to ensure that the intensity only contains information abouts2,
Under the assumption of a constantI0,there is a linear relationship between the intensity ands2,withs2having the highest coefficient,thus the phase measurement ofs2can be transformed into a phase measurement of the intensity.Due to the difference in refractive index between the two beams in the plasma,the phase shift difference between the ordinary wave and the extraordinary wave is compared using a mixer and a phase discriminator.This allows for the determination of the chord-integrated plasma chord density.
4.Measurement of Cotton-Mouton effect based on ellipticityχ
When the phase difference of the CM effect is only about 15 degrees,reducing phase noise becomes an important issue.Additionally,when the CM effect is significant,heterodyne measurement methods can introduce an approximate 10%measurement error.Now,we will demonstrate that an accurate analytical solution for the ellipticity χ is feasible under larger Cotton-Mouton (CM) effects.
4.1.The system of differential equations involving ψ andχ
Stokes parameters are observable,but they are not as intuitive as the polarization ellipse parameters.To gain a more comprehensive understanding of the changes in the polarization ellipse within the plasma,it is advantageous to convert the Stokes equations into expressions based on the parameters of the polarization ellipse.
To express the differential interaction between χ andψ[22]
During the propagation of light in a plasma,the presence of the Faraday rotation (FR) effect causes the azimuthal angle to vary continuously.Consequently,sin2ψ is not a constant.By equation (35),ψ is coupled explicitly to χ.The FR effect,although not acting directly on χ,couples implicitly to χ by changing ψ through equation (36) [23].
4.2.The expression ofψ(χ)
If one of the FR and CM effects can be neglected,the other effect,no matter how strong,can be written as an explicit expression and can theoretically be measured [20].When the CM effect can be ignored,the FR effect can be measured no matter how strong it is,and this conclusion was verified in JET [24].This conclusion is obviously.When δCM=0,equations (35) and (36) are written as
Conversely,when the FR effect can be neglected and the CM effect plays a dominant role,the problem can be considered as a generalized Volterra-like problem with nonconstant coefficients [25].
equation (40) is divided by equation (39) to obtain
Because the indefinite integral
wherexis an arbitrary function andCis a constant.
Therefore,integrating equation (42) to obtain,
where χ0and ψ0are known constant values representing the polarization parameters of the incident light.
When |cos2ψ0|·cos2χ0≠0,it satisfies
Furthermore,define Const as
According to the properties of trigonometric and inverse trigonometric functions,the constant Const ∈(0,1] in order to ensure that the value domain of ψ remains within the set of real numbers.
Figure 19 depicts the relationship between ψ andχ obtained from equation (49),where the arrows indicate the direction of phase space trajectories influenced by the CM effect.Points p1and p3represent special cases at χ=0,where ψ reaches extremum.Similarly,points p2and p4correspond to ψ=0,where χ attains extremum.

Figure 19.Considering different values of Const,the phase space trajectories of χ-ψ and the extremal points p1-4 are depicted.The arrows indicate the direction influenced by the CM effect.
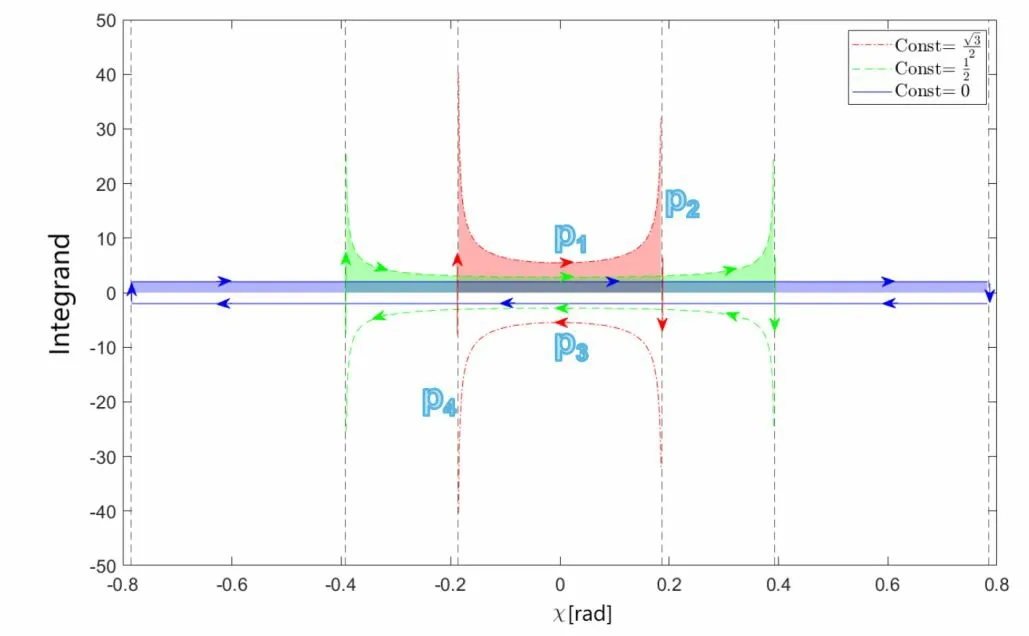
Figure 20.The integrand of dδCM (equations (54) and 63) under different Const,where p1-4 is the same as defined in figure 19.The abscissa of the black vertical dashed line represents the inflection point χ=A.Different line types correspond to different emission power ratios.The blue solid line represents equal power emission with Const=0;the green dashed line represents Const=;and the red dotted line represents Const=.The case of Const =1,which corresponds to point A coinciding with χ=0,cannot be depicted in this figure.
4.3.The explicit expression after decouplingδ(χ)
If the initial polarization parameters (χ0,ψ0) are given and the end-state χ is measured,the phase shift of the CM effect can be written as a function dδCM=dδCM(χ0,ψ0,χ),which achieves the decoupling of χ from ψ.
Noting that at the singularity where ψ=0,the denominator on the right-hand side of equation (41) becomes 0 in the improper integral.EAST satisfies thatBzis homogeneous along the range in thezdirection and ψ varies monotonically along the range.Without loss of generality,ψ is assumed to be monotonically decreasing.We classify and discuss two distinct scenarios for the phase space trajectories based on the positive and negative values of ψ.The first scenario involves trajectories moving from p4to p1and then to p2,while the second scenario entails trajectories moving from p2to p3and then to p4.
(1) ψ in the range greater than 0.Equation (47) is written as
substituting equation (35) into equation (50),
According to equation (51),the integrand function can be computed as follows:
The definite integral is
The integral calculation procedure of equation (55) is shown in Appendix B.
(2) ψ in the range less than 0.
If the polarized light propagates such that ψ=0,i.e.,(cos22χ-Const)=0,the singularity of this elliptic degreeχ can be defined as
by equation (42),
from equation (35),when ψ<0,then sin2ψ<0.Implying d χ<0,χ is monotonically decreasing,i.e.,χ holds true,whereCis an arbitrary constant.Introducing the terms=A-χ > 0 as the difference between the final state of ellipticity and the value ofA,we can express d χ=-ds.Substituting equation (58) into equation (57) results in: The integrand function can be computed as follows: According to equations (54) and (63),the phase space trajectories of the integral function family for different values of Const are illustrated in figure 20,where the ordinate represents the dimensionless quantity “Integrand”.The vertical dashed line represents the inflection point at ψ=0,denoted as χ=A.Following the assumptions stated earlier,when χ>0,ψ monotonically decreases,resulting in clockwise phase space trajectories. Based on the aforementioned analysis,the following conclusions can be inferred: (1) The area enclosed by the “Integrand” curve and theY-axis (y=0) represents the definite integral of the CM effect cumulating along the trajectory.This area has a maximum range of π and is computed as the definite integral with the limits of χ ranging from -AtoA. (2) We will now explore certain scenarios with distinct initial values of Const. (i) In the process of solving the system of differential equations,Const ≠0 was employed.Specifically,the values of (χ0,ψ0) are set such that Const=0,resulting in a simplification of equation (55) as follows: Based on figure 20,it is evident that in this particular case,the domain of χ exhibits the widest range. (ii) In the scenario where Const=1,the domain of (χ0,ψ0) is restricted to a single isolated point at (0,0),indicating that the incident laser is solely a horizontally polarized light.This isolated point,illustrated in figure 19,corresponds to point A coinciding with χ=0,which cannot be depicted in figure 20.Consequently,this confirms the inference that measuring X-mode or O-mode alone is insufficient. (3) When Const ≠1,the CM effect can be explicitly expressed in terms of the initial and final states of elliptical parameters.Notably,assuming the FR effect can be disregarded,this decoupling occurs independently of the final state solution for ψ. Now,we consider the relationship between non-uniform power emission superposition modulation and ellipticity measurement from the perspective of Poincaré sphere.The simultaneous combination of the definition equation (48) for Const and the definition equation (8) for Stokes parameters yields, This indicates that both homodyne measurement and heterodyne measurement of orthogonal light with arbitrary power ratios share a common characteristic ofs1(0) remaining constant over time.This can be derived from equation (9) [20]. When the modulation process crosses the position ofs2=0,the monotonicity of χ changes,which corresponds to the singularities mentioned in section 4.3.If=0,the modulation process is represented by the purple dashed line in figure 15,and the value range of the measured parameters2is maximized.This implies the highest resolution for equalpower transmission of orthogonal light.If=1,the modulation process degenerates into an isolated point H as shown in figure 15,wheres2≡0,meaning that there is no vertically polarized light emitted,making it impossible to measure the CM effect. In order to simulate phase shift measurements under higher parameter conditions,a larger Cotton-Mouton (CM) effect than that of existing tokamak devices is considered.By comparing the definition equation (5),we verify the accuracy of the nonlinear calculation formula equation (55) for the CM phase shift δCMin ellipticity measurements and demonstrate its superiority over the previous linear approximation formula equation (65). Figure 21 presents the results for the same shot (shot#98958) at the same moment (21 s),where the toroidal magnetic fieldBtis multiplied byeffectively amplifying the CM effect by a factor of 3.The vertical axis represents the phase shift,and the horizontal axis represents the incident positionx0.Different incident elliptical polarization conditions,referred to as State 1,State 2,and State 3,are considered to simulate a more general initials1.State 1 corresponds to the initial polarization parameters (χ0,ψ0) ofState 2 corresponds toand State 3 corresponds toIn State 1,State 2,and State 3,the values ofs1are 0,0.309,and 0.294,respectively. Figure 21.Comparison of CM phase shift calculation results between nonlinear computational formula and the definition formula under different incident elliptical polarization conditions.The results calculated using equation (5) are represented by dashed lines,the results calculated using the nonlinear calculation formula equation (55) are represented by “ ×”,and the results calculated using the previous linear approximation formula equation (65) are represented by “+”. The error is defined as where ϕ represents the phase shift. When the polarization parameters (χ0,ψ0) arewhich corresponds tos1=0,the error of the approximation formula is almost zero,whereas for other cases,the error becomes more pronounced.The error reaches 7.32 % for State 2 and 11.55 % for State 3.The computational equation is perfectly fit with the phase shift calculation of the defined equation in either incidence state,and the error in the numerical calculation is small,about 0.5 %,which is basically negligible. In summary,the three subplots in figure 21 correspond to the scenarios in equation (18),where the plasma Mueller matrixM(z) is the same,but the initial Stokes parameters(0)is different.Since the plasma state remains the same throughout the passage,if the nonlinear computational model given by equation (55) is correct,the resulting δCMshould be consistent with the computed results obtained from equation (5).The nonlinear equation makes polarization measurements without having to reduce the wavelength and sacrifice resolution for the applicability of the linear model,ensuring the measuring accuracy of large CM effect. Next,we will discuss the second case mentioned in section 4.3,which corresponds to the situation when ψ crosses the zero point,i.e.,across p2and p4(as shown in figure 20).In this case,the change in χ does not exhibit monotonicity,resulting in the integrand function of dδCMfirst being greater than 0 and then becoming less than 0 after crossing χ=A.This indicates that δCMis no longer a singlevalued function with respect to χ.Therefore,correction is needed. Figure 22 has the same plasma discharge parameters and toroidal magnetic field settings as figure 21.The only difference lies in the initial polarization parameters (χ0,ψ0) set asThe code demonstrates that,when the CM effect is sufficiently strong,it has the ability to reverse the handedness of a wave that is initially launched with circular polarization.A noticeable alignment between the corrected results and the definition is evident,leading to a reduction in error from 48.34 % (whenx0=-0.225 m) to approximately 0.5 %.Whenx0>0,the sign consistency of ψ before and after passing through the plasma ensures that it does not enter the domain of equation (64),thus no correction is needed. Figure 22.Correction of computational equation.The results calculated using equation (5) are represented by dashed lines.Due to the consistency of the plasma discharge parameters and the toroidal magnetic field between the scenarios in figure 21,the ‘Definition’curves in the two plots are identical.The result of the calculation solely using equation (55) is represented as ‘ ×’ and the result of the correction using both equation (55) and equation (64) is represented as ‘+’. Although the nonlinear expression is precise,its limitation lies in the complex square root operation required for signal demodulation.Moreover,ensuring the consistency of the sign of ψ during the measurement process is challenging,and neglecting the Faraday rotation (FR) effect will lead to a significant increase in the calculation error of χ.This makes it difficult to use as a diagnostic tool for real-time feedback of electron density during operation and control of fusion reactors.In the balance between accuracy and real-time capability,practical plasma discharges often do not adopt ellipsometry measurements. This study combines theoretical derivation and simulations to systematically investigate the feasibility of measuring electron density using the Cotton-Mouton (CM) effect on EAST.For laser wavelength of 432.6 µm,fringe jumps due to phase shift over 2 π can be avoided to provide reliable density measurement for machine operation.The study clarifies that elliptical modulation enables the direct measurement of the phase variation of the second components2of the Stokes parameters,providing information aboutThe measurement principle for heterodyne detection in the case of small CM effects is presented,along with the design of an optical setup.In a laboratory environment,the power of the two orthogonal laser beams received by the detector may not be strictly equal.It is shown that non-equal power radiation only affects the DC offset of the light intensity,and does not affect the phase variation of measured signals.It is further confirmed that the higher-order term errors introduced by the Faraday rotation effect on CM effect are small (about 1 %)for current parameters of EAST.However,in the case of large CM effects (δCM~O(1)),the higher-order terms of the Mueller matrix will introduce significant errors. Current plasma density diagnostics based on polarimeter interferometers consider the ellipticity parameters as linear functions of phase shifts.As future fusion devices improve in their parameters,this approach will introduce increasingly large errors.This paper reveals the coupling between the ellipticity parameters χ and ψ,the potential errors they may introduce in plasma density diagnostics based on the CM effect.The study provides an explicit expression for the CM effect phase shift δCMas a function of χ,decoupled from the azimuthal angle ψ,when the Faraday rotation effect can be neglected. In summary,for EAST experiment parameters,a verticalview Cotton-Mouton polarimeter interferometer is capable of providing reliable density measurement with excellent time resolution (a few MHz). Acknowledgments This work was financially supported by National Natural Science Foundation of China (No.12127809). Appendix A The following section will demonstrate the analytical expression for the first-order expansion ofs2(z) whenW~O(1).Whens(z=0) is modulated with a significant CM effect,numerical integration becomes inconvenient. In such cases,the zeroth-order Mueller matrix differential equation is introduced to facilitate the analysis [20] Given t he initial conditionM(0)(z=0)=E,whereEdenotes the identity matrix,the integration yields: Based on the reference [17],it can be derived that the first-order terms of Mueller matrix do not affect the phase ofs2(z). Similarly to equation (26),the second components2of the Stokes parameters is given by Namely,for even values ofn,M(n) has the same distribution of zeros asM(0)and,for odd values ofn,the same asM(1).It can be observed that the non-zero elementsM22andM23of the second-order matrixM(2)will affect the phase ofs2(z)[14]. Appendix B Now,the indefinite integral of equation (55) is to be calculated.From equation (54), The positive sign is taken when sin2χ>0 and the negative sign is taken when sin2χ<0. Derivation of equation (77) substituting equation (79) into equation (76), derivation of equation (81) yields substituting equation (84) into equation (80), Also because When χ0,ψ0are known,the constantCcan be found.The sign of δCMdepends on the positivity or negativity of sin2χ,which is taken to be positive when sin2χ>0 and positive when sin2χ<0 is taken as negative.4.4.Commonalities with heterodyne measurements
4.5.Modeling results and discussion of ellipticity measurement


5.Conclusion
猜你喜欢
杂志排行

Plasma Science and Technology的其它文章
- An improved TDE technique for derivation of 2D turbulence structures based on GPI data in toroidal plasma
- Inward particle transport driven by biased endplate in a cylindrical magnetized plasma
- Progress of Lyman-alpha-based beam emission spectroscopy (LyBES) diagnostic on the HL-2A tokamak
- Development of a toroidal soft x-ray imaging system and application for investigating three-dimensional plasma on J-TEXT
- Electron density measurement by the three boundary channels of HCOOH laser interferometer on the HL-3 tokamak
- Reconstruction of poloidal magnetic field profiles in field-reversed configurations with machine learning in laser-driven ion-beam trace probe