First results of CO2 dispersion interferometer on EAST tokamak
2024-04-06YuyangLIU刘郁阳WeimingLI李维明YuanYAO姚远YaoZHANG张耀JiaminZHANG张家敏HuiLIAN连辉BoHONG洪博ShouxinWANG王守信YinxianJIE揭银先andHaiqingLIU刘海庆
Yuyang LIU (刘郁阳) ,Weiming LI (李维明) ,Yuan YAO (姚远) ,Yao ZHANG (张耀) ,Jiamin ZHANG (张家敏),3 ,Hui LIAN (连辉) ,Bo HONG (洪博),Shouxin WANG (王守信),Yinxian JIE (揭银先) and Haiqing LIU (刘海庆)
1 Institute of Plasma Physics,Hefei Institutes of Physical Science,Chinese Academy of Sciences,Hefei 230031,People’s Republic of China
2 University of Science and Technology of China,Hefei 230026,People’s Republic of China
3 Institutes of Physical Science and Information Technology,Anhui University,Hefei 230031,People’s Republic of China
Abstract A dispersion interferometer (DI) has been installed and operates on the Experimental Advanced Superconducting Tokamak (EAST).This DI system utilizes a continuous-wave 9.3 μm CO2 laser source to measure line-averaged electron densities accurately.In contrast to conventional interferometers,the DI does not require substantial vibration isolations or compensating systems to reduce the impact of vibrations in the optical path.It also employs a ratio of modulation amplitudes,ensuring it remains immune to the variations in detected intensities.Without a variation compensation system,the DI system on EAST reaches a density resolution of less than 1.8 × 10⁻²π rad and a temporal resolution of 20 μs.The measurements made by the POlarimeter-INTerferometer (POINT) system and the far-infrared hydrogen cyanide (HCN) interferometer are remarkably consistent with the DI’s results.The possibility of fringe jumps and the impact of refraction in high-density discharge can be significantly decreased using a shorter wavelength laser source.A rapid density change of 3 × 10¹⁹ m-3 during 0.15 s has been measured accurately in shot No.114755 of EAST.Additionally,the DI system demonstrates dependability and stability under 305 s long-pulse discharges in shot No.122054.
Keywords: dispersion interferometer (DI),electron density,plasma diagnostics,Experimental Advanced Superconducting Tokamak (EAST)
1.Introduction
Interferometry is a widely recognized technique for detecting phase variations between probe and reference waves to calculate plasma electron density.Due to their superior stability and high density resolution,interferometers are commonly used for plasma electron density measurement and density feedback control [1].However,the interferometers must be enhanced in the following issues when the device’s operating density improves and accuracy standards rise.A significant challenge is presented by the wavelength of the light source used in the interferometer,particularly in the context of far-infrared interferometers,where measuring high-density plasma can be problematic.These factors encompass the potential signal loss in the probe channel due to the high-density gradient perpendicular to the direction of propagation [2].In the case of the EAST device,the H-mode density limit can achieve levels of up to (0.8-0.9)nGW[3],wherenGW(1020m-3) is the Greenwald density limit defined asIp(MA)/πa2(m),withIprepresenting the plasma current andabeing the minor radius of the plasma cross-section.Another noteworthy challenge is the missing of a 2π boundary traversal,known as fringe jumps.Due to the proportional relationship between electron density and wavelength,rapid changes in density can cause multiple fringes in a farinfrared interferometer.The lack of precision in the phase detection system,or a density change rate surpassing the sampling rate,may result in computational inaccuracies,necessitating careful consideration and the exploration of alternative approaches to address the consequences of fringe jumps.A possible answer to this problem is to shorten the wavelength of the laser source.However,short-wavelength interferometers are susceptible to the detrimental effects of mechanical vibrations,as the phase shift induced by such vibrations is inversely proportional to the wavelength.Vibration isolation structures alone have not been able to entirely solve the problems caused by vibrations.Moreover,the installation of such systems demands substantial investment of space and financial resources.To overcome this limitation,certain devices like DIII-D [4] and LHD [5] have implemented two-color interferometer diagnostics that utilize a pair of distinct shortwave lasers to mitigate the impacts caused by mechanical vibrations through compensation techniques [6].However,this requires precise alignment of the optical paths of the two colors,as in the case of the toroidal interferometer and polarimeter system [7] on the International Thermonuclear Experimental Reactor (ITER),where the designed coincident optical path exceeds 50 m,imposing stringent demands on the system.In contrast,the dispersion interferometer (DI) system does not require the reference arm,providing an efficient and cost-effective solution to overcome the limitations of traditional interferometers.
During the 1990s,the DI was employed to gauge the electron density of plasma on a gas-dynamic trap (GDT) [8].It was subsequently utilized on the TEXTOR tokamak in the 2000s [9].Like its homodyne far-infrared counterpart,the homodyne DI has a phase detection range that is less than π,making it unable to distinguish between positive and negative phase shifts brought on by changes in detection intensity.To overcome this limitation,an electro-optical modulator was introduced for phase modulation in the DI on the TEXTOR device in 2006 [10].Additionally,Akiyamaet alenhanced the traditional DI on LHD in 2014 by incorporating a photoelastic modulator and extracting the amplitude using a lock-in amplifier [11].Subsequently,DI systems have been installed on other devices such as DIII-D [12],HL-2A [13],and KSTAR [14],and a DI has been designed as a complementary density diagnostic for ITER [15].Advances in DIs demonstrate their broad applicability and effectiveness in plasma devices [16].
This article introduces the DI utilizing a phase modulator (PEM) installed on EAST for accurate measurement of plasma electron density.The remainder of the article is organized as follows.Section 2 provides an overview of the principle of the DI system with PEM.Section 3 describes the optical layout of the DI system as implemented on EAST.Measurement results are presented in section 4,where the preliminary findings obtained from this system are compared to those from the far-infrared HCN interferometer [17] and the POlarimeter-INTerferometer (POINT) system [18],showing their consistency.Finally,section 5 provides a comprehensive conclusion.
2.Principle of the DI system
The DI generates two second harmonic beams using two nonlinear crystals,allowing it to assess the interference pattern to determine the electron density.In contrast to homodyne DIs,modulation-based DIs have a dynamic range of 2π [9] and can mitigate the impact of variations in probe intensity [11].
To produce second harmonic waves,nonlinear crystals I and II are positioned before and after the plasma,respectively,in the DI setup shown in figure 1.The PEM modulates the fundamental waves and introduces a phase delay of ρ0sinωmt(ωmis the drive frequency andρ0is the optical retardation by the PEM).Through nonlinear crystal I,a horizontally polarized fundamental wave produces a vertically polarized second harmonic wave (a).After traversing the plasma,the fundamental and the second harmonic waves generate phase shifts ofrespectively.Nonlinear crystal II generates a second harmonic wave(b) from the fundamental wave,while the filter selectively filters out the fundamental waves.Finally,coherent signals are detected.
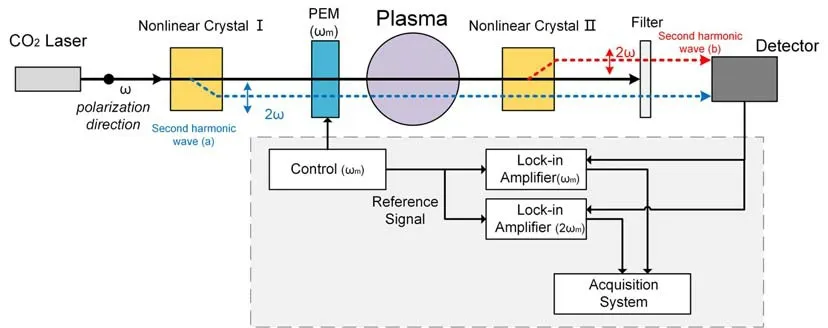
Figure 1.The principle and main components of the DI utilizing modulation amplitude ratio.
The detected interference signal intensity is:
Using lock-in amplifiers or FFT analysis to expand equation (1),are the amplitudes of fundamental and second harmonics of the signal spectrum obtained by the lock-in amplifiers in figure 1,respectively:
ρ0=1.3 rad is set to makeJ1(2ρ0)=J2(2ρ0),whereJ1andJ2signify the first and second Bessel functions of equation (1)[19].The line-average density calculation can be obtained using the following equation [11,20]:

Figure 2.The optical layout of the DI syste in the EAST experimental hall,with the optical table being positioned in the laser room on the first floor of the basement.
3.Descriptions of the DI system on EAST
A two-layer optical bench is installed in the laser room on the first floor of EAST’s experiment hall basement,without the implementation of a vibration isolation system [21].The layout of the DI system on EAST can be seen in figure 2.
Figures 3(a) and 4(a) illustrate the configuration of the lower optical table.In this table,the 9.3μm CO2laser source(DIAMOND C-55L,Coherent),the first frequency doubling crystal (AgGaSe2with anti-reflectance coating,5 mm×5 mm×20 mm),and the PEM (II/ZS50,Hinds Instruments) are installed.The 4.65μm second harmonic can reduce the interaction with H2O [16].
The PEM modulates the fundamental wave at a frequency of 50 kHz.The light enters the EAST device after passing through the telescope system,as shown in figure 4(b),and is slightly reflected by the top planar mirror,which is installed at the waveguide of the HCN interferometer,as depicted in figure 4(c).
Figures 3(b) and 4(a) illustrate the layout of the upper optical table.At the upper optical table,the second AgGaSe2crystal (anti-reflectance coating,5 mm×5 mm×20 mm) and a detector are installed.The detector receives the signal and transmits it to the lock-in amplifier for further processing.Figure 4(b) illustrates the mounting of the telescope system on the vertical optical table.
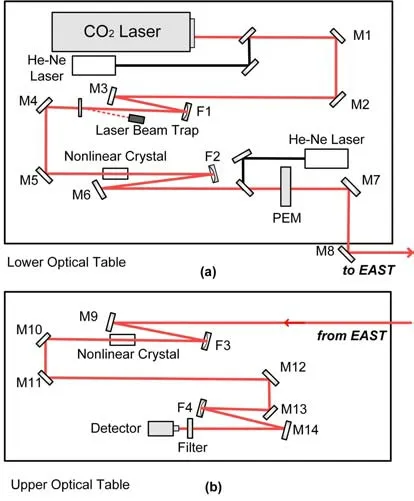
Figure 3.(a) The lower optical layout of the DI on the optical table.(b) Plasma-transited laser beam proceeding to the upper optical table.

Figure 4.Images of the DI system.(a) Two-layer optical table without a vibration isolator in the experimental hall.(b) Vertical optical table.(c) Top reflector installed on top of the EAST tokamak.
To achieve maximum frequency doubling efficiency,both crystals are positioned at the beam waist of the laser.Figure 5 illustrates the optical path,with the beam waist diameters at various locations.The first crystal,PEM,the top reflector,and the second crystal have diameters of approximately 0.6 mm,1.9 mm,6.1 mm,and 0.3 mm,respectively.Specially designed crystal holders facilitate crystal rotation to identify their respective phase-matching angles while the temperature of the crystals can be maintained below 35 °C through the air-cooling function of fans.The CO2laser output power is 55 W.To meet the required measurement criteria,we use a beam splitter to ensure the initial beam power output typically reaches 15 W before reaching the first crystal.
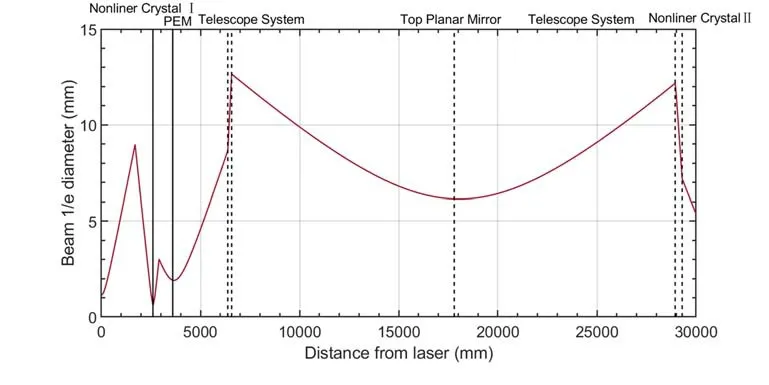
Figure 5.Distributions of the 1/e beam diameter of the fundamental beam.
The frequency doubling efficiency attained is about 9.25×10⁻⁶,which is sufficient for accurate measurements.Signal strengths of 50 kHz and 100 kHz are approximately 120 mV and 100 mV,respectively.
4.Experiment results and discussions
The DI system has been successfully installed on EAST,enabling the acquisition of preliminary experimental data.The far-infrared HCN interferometer (with a wavelength of 337μm,a single path lengthLof approximately 1.3 m,and a modulation frequency of 10 kHz),and the POINT system(operating at a wavelength of 432μm and a modulation frequency of 850 kHz for density measurement) have consistently delivered density feedback for experiments conducted on EAST for several years.Consequently,by comparing the measurements obtained from the DI system (utilizing a double path with a path lengthLof about 2.4 m) with those collected from the HCN interferometer and the sixth chord of the POINT system (utilizing a double path with a path lengthLof around 1.8 m),the accuracy of the DI system can be effectively verified (figure 6).
Figure 6 illustrates the optical path of the DI system and the plasma magnetic surface on EAST.The position of the HCN interferometer path (R=1.82 m) is near the DI’s optical path (R=1.91 m),while the sixth chord of the POINT system passes through the plasma center (Z=0 m).The measured outcomes from these systems exhibit a striking similarity,validating the measurement accuracy of the DI system.
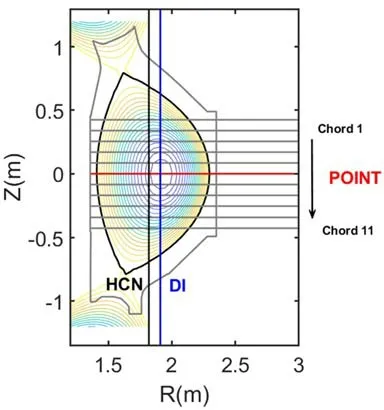
Figure 6.Magnetic surface of the EAST tokamak and corresponding optical paths.The blue line represents the path of the DI,the black line represents the path of the HCN interferometer,and the red line represents the path of the sixth chord of the POINT system.
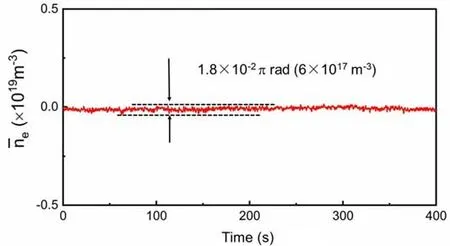
Figure 7.The drift of the baseline in 400 s of DI on EAST.
Without the use of a special variation isolation system,the density fluctuation measures approximately 1.8×10⁻²π rad (equivalent to line averaged density 6×10¹⁷m-3) over the duration of 400 s,suggesting effective cancellation of the phase shifts caused by mechanical vibration.This is evidenced by the variations in baseline line average density,as shown in figure 7 .However,the residual variations(marked by the two arrows) may be attributed to factors such as optical axis displacement or temperature influences [10].The next step will be to upgrade the system’s density resolution from the above two aspects.
4.1. Density measurement by DI system
Figure 8 compares the average line density measurements obtained from various interferometers on EAST.Specifically,in shot No.110733 of EAST,the measurements from the DI system demonstrate excellent consistency with those from the HCN and POINT systems during a plasma discharge of 24.8 s.The line-averaged density is recorded as 4.4×10¹⁹m-3,while the plasma current is measured at 400 kA.In this shot,the HCN and DI systems measure fast density fluctuations.It is essential to know that the slight variations in the results can be attributed to the different optical paths used by each system.The lock-in amplifier is set with a time constant of 1 ms,which allows the system to supply signals for density feedback control in the future.
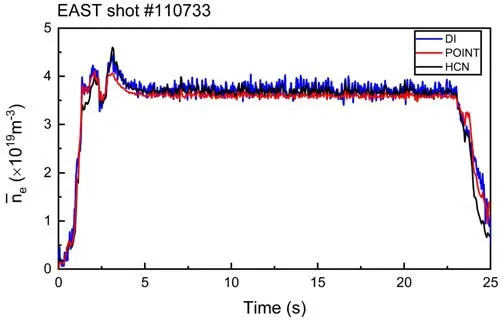
Figure 8.Comparison of density measurement by dispersive interferometer with other interferometers in shot No.110733 of EAST.

Figure 9.Influence of rapid density changes on interferometer measurements.HCN interferometer (black line) shows errors due to rapid density changes at 6.6 s,while the results of DI and POINT systems remain unaffected.
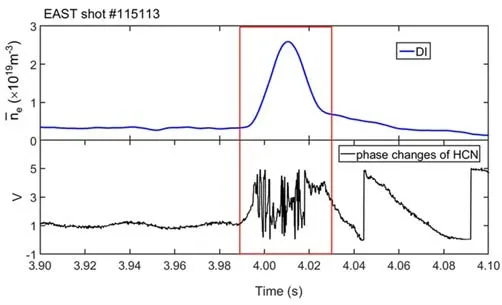
Figure 10.The loss of the phase changes in the HCN interferometer and the dispersion interferometer’s measurement remains stable.

Figure 11.Stability of the DI system in long-pulse discharge.The DI system demonstrates excellent stability during extended plasma discharges lasting over 300 s.(a) Plasma current,(b) loop voltage,(c) line-integrated density measured by POINT and DI,(d) the power of lower hybrid wave (LHW) and the electron cyclotron resonance heating (ECRH),(e) plasma stored energy,and (f) the signal of supersonic molecular beam injection (SMBI).
4.2. Stability of density measurement using the DI system
Rapid density changes pose challenges for long-wavelength interferometers,as depicted in shot No.122054 in figure 9.At 6.6 s,a rapid density change of 3×10¹⁹m-3during 0.15 s is observed.The phase shifts of the HCN interferometer have been misinterpreted due to fringe jumps at 6.8 s,which are unacceptable for accurate density feedback.The phase shift of the HCN interferometer involves five fringes.When there is a miscalculation in the phase comparison system,it leads to an improper recognition and calculation of successive fringe shifts.It is possible to enhance the calculation accuracy of the signal real-time calculation system,but fewer fringes in discharges are more reliable.
In contrast,the DI system does not encounter fringe jumps,resulting in measured data that align with the POINT system.For the 9.3μm DI,this density change corresponds to approximately 0.45π in terms of phase.This observation confirms that the short-wavelength CO2DI is less susceptible to fringe jumps during high-density plasma discharges,indicating its potential for reliable density measurements in future high-density plasma discharges.
As shown in figure 10,localized regions of high density in the active plasma rupture experiment’s shot No.115113 cause the beam to deflect in the far-infrared interferometer.This loss is evident from the phase shifts in the HCN interferometer,where the signal is entirely lost between 4.01 and 4.02 s.In contrast,the DI’s measurement remains stable.
Furthermore,the DI system exhibits stability in longpulse H-mode discharges (shot No.122054,more than 30 s),as illustrated in figure 11(b).The plasma current is about 0.3 MA,the line-averaged density is around 3.4×10¹⁹m-3.This stability is crucial for future density feedback in plasma discharges,highlighting the reliability and suitability of the DI system.
5.Conclusions
The 9.3μm CO2laser source-equipped DI system with a PEM has been installed on the EAST,and the initial experimental data have been obtained.The acquired data have been verified through a comparative analysis with data obtained from the HCN interferometer and the POINT system.This validation serves to corroborate the precision of the DI system in the assessment of plasma density.Furthermore,the DI system has demonstrated precise measurement of rapid density fluctuations within plasma discharges,maintaining stability even during extended discharges lasting beyond 300 s.The DI system exhibits resilience to mechanical vibrations,and utilization of a short-wavelength laser source has proven beneficial in mitigating the effects of fringe jumps.
Future efforts will concentrate on optimizing the DI system’s signal-to-noise ratio and minimizing electromagnetic influences to accommodate the routine utilization of the DI system for density measurements and density feedback control in high-density,long-pulse plasma discharges on the EAST tokamak.
Acknowledgments
We extend our special thanks to Dr.T Akiyama for his invaluable assistance and guidance. This work was supported by the Comprehensive Research Facility for Fusion Technology Program of China (No.2018-000052-73-01-001228) and the Major Special Science and Technology Project of Anhui Province (No.912188707023).
猜你喜欢
杂志排行

Plasma Science and Technology的其它文章
- Forward modelling of the Cotton-Mouton effect polarimetry on EAST tokamak
- Experimental study of core MHD behavior and a novel algorithm for rational surface detection based on profile reflectometry in EAST
- Reconstruction of poloidal magnetic field profiles in field-reversed configurations with machine learning in laser-driven ion-beam trace probe
- Electron density measurement by the three boundary channels of HCOOH laser interferometer on the HL-3 tokamak
- Development of a toroidal soft x-ray imaging system and application for investigating three-dimensional plasma on J-TEXT
- Inward particle transport driven by biased endplate in a cylindrical magnetized plasma