A dual-route optical emission spectroscopy diagnostic with wide spectral range and high wavelength resolution on HL-2A tokamak
2024-04-06YueCHEN陈越JikunGAO高继昆TingLONG龙婷LinNIE聂林JinmingGAO高金明YaoMA马尧YuanHUANG黄渊WenjingTIAN田文静YanminLIU刘延民XiaodongZHU朱晓东GeZHUANG庄革WulyuZHONG钟武律andMinXU许敏
Yue CHEN (陈越) ,Jikun GAO (高继昆) ,Ting LONG (龙婷) ,Lin NIE (聂林) ,Jinming GAO (高金明) ,Yao MA (马尧) ,Yuan HUANG (黄渊),Wenjing TIAN (田文静),3,Yanmin LIU (刘延民),Xiaodong ZHU (朱晓东),*,Ge ZHUANG (庄革),Wulyu ZHONG (钟武律) and Min XU (许敏)
1 School of Physical Sciences,School of Nuclear Sciences and Technology,University of Science and Technology of China,Hefei 230026,People’s Republic of China
2 Southwestern Institute of Physics,Chengdu 610041,People’s Republic of China
3 Tsinghua University,Beijing 100084,People’s Republic of China
Abstract A dual-route optical emission spectroscopy (D-OES) diagnostic is newly developed to monitor the optical emission from the X-point plasma region on the HL-2A tokamak.This diagnostic is composed of an imaging system,a beam-splitting system for dual-route measurements,fiber bundles,a spectrometer system,and a control and acquisition system.One route is used to obtain wide-spectral-range spectra,and the other route is used to acquire high-wavelengthresolution line shapes.The spectral resolution of the wide-range spectrometers is 0.8 nm with a coverage of 800 nm (@200-1000 nm).The spectral resolution of the high-resolution spectrometer is 0.01 nm with a coverage of 6 nm (@200-660 nm).The spatial resolution of each route of D-OES is about 4 cm with 11 channels.The temporal resolution is 16 ms at maximum in the single-channel mode.Wide-range spectra (containing Balmer series and a Fulcher band)and highly resolved Hα line shapes are obtained by D-OES in the hydrogen glow discharge in the lab.D-OES measurements are carried out in the high-density deuterium experiments of HL-2A.The electron density ne and deuterium temperature TD in the X-point multifaceted asymmetric radiation from the edge (MARFE) region are derived simultaneously by fitting the measured Dα shape.The density ne is observed to increase from~ 8.7×10¹⁸ m-3 to~7.8×10¹⁹ m-3,and the temperature TD drops from~14.4 eV to~2.3 eV after the onset of MARFE in the discharge #38260.
Keywords: optical emission spectroscopy,Balmer series,tokamak
1.Introduction
The atomic and molecular kinetics and radiation behavior at the boundary of tokamaks strongly affect the plasma-wall interaction [1],divertor detachment and impurity flux into the main plasma [2],which are critical issues in magnetic fusion research.Optical emission spectroscopy (OES)provides a useful diagnostic tool for understanding atomic and molecular processes via the measurements of the optical spectra from the emission of atoms,molecules and ions [3-8].Comprehensive information can be derived from these spectra.The species can be distinguished from the characteristic lines,and their concentration can be obtained from the radiation intensity.Meanwhile,plasma parameters are related to the shapes of spectral lines [9,10].A spectral line with an infinitely sharp line shape cannot be observed due to the natural broadening from Heisenberg’s uncertainty principle.In addition,Doppler broadening from random thermal motion and Stark broadening from the effects of collision and the electric field are important and often not negligible[3,11-13].By fitting the spectral line shape,the plasma temperature from the Doppler width and the electron density from the Stark width can be derived.
Spectroscopic investigations of plasma in the divertor and edge regions have been carried out on many tokamaks[14-20].Maoet almonitored the line radiation of W I to investigate the tungsten flux in the divertor of EAST [21].By measuring the intensity ratio of C III and C IV,Koubitiet alobtained the electron temperature profile and showed the existence of a recombining zone around the X-point multifaceted asymmetric radiation from the edge (MARFE)in JT-60U [22].Further,the high-resolution spectrometer of Alcator C-Mod was used to obtain the electron density by measuring the line shapes of the deuterium Balmer series[2].Xuet alobtained the electron density in the divertor region by measuring the line width of Dδon EAST [23].The OES diagnostic at the boundary of tokamaks requires the measurement capability of both wide spectral range and high wavelength resolution,because of the existence of different radiating species and various plasma parameters.The timeresolved OES integrated with wide-spectral-range and highwavelength-resolution measurements for the same detecting area is not routinely applied,since the higher resolving power of dispersing elements for spectroscopic techniques usually allows a lower wavelength coverage.
In this work,we develop a dual-route optical emission spectroscopy (D-OES) diagnostic on the HL-2A tokamak to monitor the optical emission from the X-point region.The dual routes,one for wide-range spectra and the other for highresolution line shapes,are synthesized via a dedicated beamsplitting system.The remainder of this paper is organized as follows.Section 2 introduces the overall design and test results of D-OES.Section 3 reports the derivation of density and temperature from D-OES measurements on the HL-2A.Section 4 presents the conclusion.
2.Design and test of D-OES diagnostic
2.1. Layout of D-OES on HL-2A
A dual-route optical emission spectroscopy (D-OES) diagnostic with wide spectral range and high spectral resolution is newly developed on the HL-2A,which is used to detect the light emitted from the X-point region.The HL-2A is a medium-size tokamak device with a major radius ofR0=1.65 m and a minor radius ofa=0.4 m [24].The DOES is installed at the SSW (i.e.between the south and southwest) port of the HL-2A,which is 30 cm above the midplane.The 11 lines of sight of D-OES in the cross-section of the HL-2A are shown in figure 1.
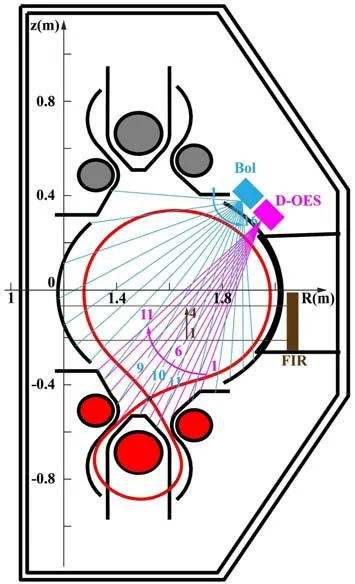
Figure 1.The layout of D-OES and some other diagnostics mapped on the cross-section of HL-2A tokamak.FIR: far-infrared laser interferometer;Bol: bolometer.
2.2. Design and construction of D-OES
A schematic diagram of the D-OES diagnostic is shown in figure 2 .The D-OES diagnostic consists of an imaging system,a beam-splitting system,fiber bundles,a spectrometer system,and a control and acquisition system.The imaging system contains a shutter,a protecting plate,a reflecting mirror,a vacuum window and imaging lenses.The shutter is in front of a protecting plate.The plate is made of fused silica with a 50 mm diameter,which is installed inside the vacuum chamber of HL-2A.It can avoid contamination by plasma emission.The 75 mm mirror next to the protecting plate is used to change the direction of the optical axis to be coaxial with the subsequent optical components.The window on the vacuum chamber is made of fused silica with a 50 mm diameter.The imaging lenses coaxial with the vacuum window have a focal length of 50 mm.When the shutter is opened,the plasma emission from the object plane near the X-point passes through the protecting plate,gets reflected by the mirror,and then goes through the vacuum window.Later,the emission is collected by the imaging lenses and focused on the image planes.The field of view of the imaging system is 16.8 degrees.The magnification of the lenses is about 40.The diameter of the object plane is about 50 cm,and the diameter of the image plane is 12.5 mm.
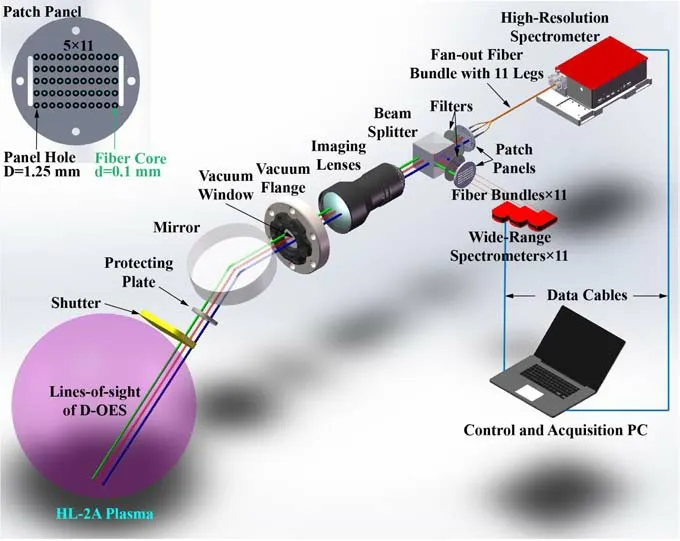
Figure 2.Overall sketch map of D-OES diagnostic.The insert is the enlarged view of fiber patch panel.
To achieve dual-route measurements,a beam-splitting system after the imaging lenses is used to divide the plasma emission into two beams.The splitting system consists of a non-polarizing 50:50 beam-splitter cube,two filter components and two fiber patch panels,as shown in figure 2.The splitter cube is used to obtain two emission beams.The filter component contains neutral density filters (NDFs) and narrow bandpass filters (NBFs).The NDFs are used to attenuate the emission intensity to avoid overexposure,and the NBFs are used to select the spectral range for measurement.The two fiber patch panels,which are made of aluminum,are installed and aligned at two image planes of the lenses,respectively.Each beam divided by the splitter cube then passes through the filter component.The two filtered beams are transmitted onto the two fiber patch panels and enter the fiber bundles for the wide-range spectrometers and highresolution spectrometer,respectively.There are 5×11 fiber ports on each patch panel for spatial resolved measurements,as shown in the insert of figure 2.The spatial resolution is about 4 cm.The observation spots can be flexibly changed by plugging the fibers into different ports on the patch panel.The 1×11 fiber ports in the middle are used in the experiments.
The spectrometer system is composed of 11 wide-range spectrometers and one high-resolution spectrometer.The wide-range spectrometers (Thorlabs CCS200) have gratings with 600 grooves/mm,covering a wavelength range of 200-1000 nm.The resolution of the corresponding CCD (Charge Coupled Device) is 1×3648 with an 8µm pitch.The linear CCD can only work in single-channel mode.The highest temporal resolution is 5 ms and the spectral resolution is about 0.8 nm with a fixed entrance slit of 20 µm.The highresolution spectrometer (SOL MSDD1004i) is a double dispersion monochromator-spectrograph with an effective focal length of 1 m.The 2400 grooves/mm grating is used to resolve the emission with a wavelength range of 200-660 nm.The spectral resolution is 0.01 nm and the coverage is 6 nm with an entrance slit of 30 µm.The resolution of the corresponding CCD camera (SOL HS101H) is 506×2048 with a pixel size of 12×12 µm2.In the single-channel mode,this CCD can achieve a 16 ms temporal resolution at maximum.The temporal resolution is about 56 ms in the multi-channel mode.For the synchronous measurements of D-OES,the temporal resolutions of the wide-range spectrometer and high-resolution spectrometer are usually set to be the same.Thus,the temporal resolution of the D-OES is limited by the high-resolution spectrometer.For the whole spectrometer system,a temporal resolution of 16 ms can be achieved in the single-channel mode.
The control and acquisition system are realized by a local/remote PC.Control software is developed based on the software development kits provided by the manufacturers.Using this software,the control of spectrometers and data acquisition are automatically achieved at the same time.The total D-OES diagnostic can be synchronized with the external trigger signal.
2.3. Test results of D-OES in the lab
The D-OES performance is tested with a DC hydrogen glow discharge [25].As shown in the insert of figure 3(a),DC hydrogen plasma is generated between two plate electrodes at 1.3×10⁴Pa with a discharge current of 13 A.The lines of sight of D-OES are set to pass through the middle of the two electrodes.An NBF with a center wavelength of 660 nm and full width at half maximum of 10 nm is used for the highresolution route.The measured optical spectrum in the range of 200-1000 nm is shown in figure 3(a),where the hydrogen Balmer series (Hα656.3 nm,Hβ486.1 nm,Hγ434.0 nm) and hydrogen Fulcher alpha band (590-640 nm)are presented.At the same time,the line shape of Hαis shown in figure 3(b) and the total line width is about 52 pm.
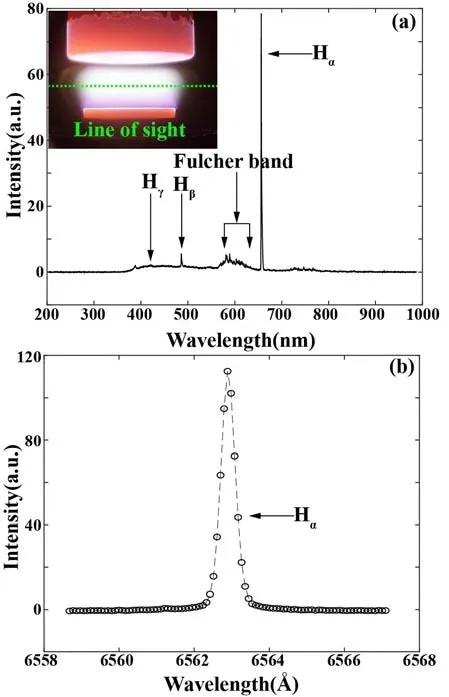
Figure 3.The spectrum obtained by D-OES in DC hydrogen glow discharge experiment.(a) Spectrum of DC hydrogen glow discharge obtained by wide-range spectrometer,(b) Hα line shape of DC hydrogen glow discharge obtained by high-resolution spectrometer.
The instrument width of the high-resolution spectrometer is estimated in the lab [26].Since the gas temperature and electron density of the DC hydrogen plasma above are high,the corresponding Doppler width and Stark width are much larger than the instrument width in the total line shape in figure 3(b).Instead,a deuterium electron cyclotron resonance (ECR) plasma at low pressure is used to directly measure the instrument width.The microwave power and plasma pressure are 200 W and 0.1 Pa,respectively.Due to the low electron density and deuterium temperature (near room temperature) of this ECR plasma,the Stark width and Doppler width are below 1 pm.These are much lower than the instrument width (typically dozens of pm).Thus,it is reasonable to regard this measured Dαline width as the instrument width at 656.1 nm.Basically,the instrument broadening is caused by the non-zero slit width and aberrations of the spectrometer [27].The fitted line profile is shown in figure 4 with an entrance slit of 30 µm.The total width is composed of a Gaussian component (9.6±0.3 pm)and a Lorentz component (1.7±0.4 pm) .Therefore,the instrument width is estimated to be about 10 pm with a Gaussian line shape in experiments.
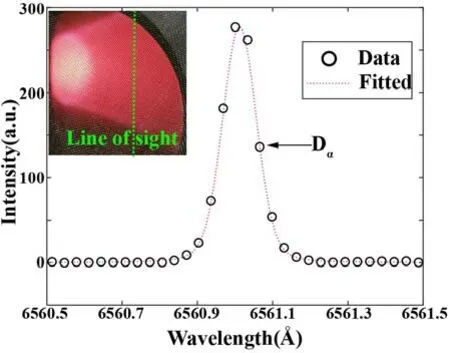
Figure 4.The measured spectrum and fitted line shape for deuterium ECR plasma.
3.D-OES measurements on HL-2A
The D-OES diagnostic is used to monitor the plasma emission in the X-point region of the HL-2A tokamak with divertor configuration.An NBF with a center wavelength of 660 nm and full width at half maximum of 10 nm is used for the high-resolution route to obtain the deuterium Balmer line shape.The Dβand Dγin HL-2A plasmas are extremely weak compared with Dα.Therefore,the high-resolution spectrometer of D-OES is used only to measure the DαBalmer line. Dαconsists of seven fine components distributed within 20 pm.However,their structures are difficult to distinguish because the broadening of their spectral lines (Doppler,Stark,Zeeman and instrumental effects)overlaps with each other.Meanwhile,the measured spectral width on the HL-2A tokamak,which is shown below,exceeds 100 pm.It is much larger than 20 pm.Therefore,the fine structure of Dαis not considered in the OES measurements.
The main parameters in deuterium Ohmic discharge#38260 are shown in figure 5.The plasma currentIP,the central line-averaged density by the FIR system,the neutral gas pressure measured by a fast ionization gauge,and radiation from bolometer (Bol) measurements are shown in figures 5(a)-(d),respectively.A MARFE characterized by the localized enhanced radiation near the X-point appears at 1246 ms.
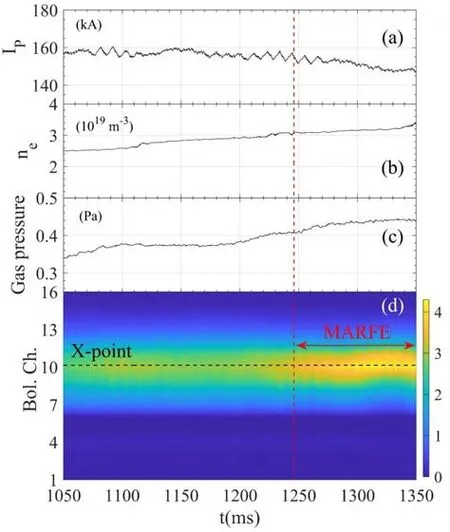
Figure 5.(a) Plasma current,(b) line-averaged density,(c) neutral gas pressure,and (d) bolometer radiation,for discharge #38260.
Figures 6(a) and (b) display the visible light images.It is found that the light emission near the X-point,which is marked with the dashed box,is greatly enhanced when MARFE is generated.For the D-OES,high-resolution spectrometer measurements are conducted,while the measurements of wide-range spectrometers are not available due to their low sensitivity.An upgrade of the wide-range spectrometers is planned for future work.The Dαline shape measured by the high-resolution spectrometer of D-OES at 1040-1240 ms without MARFE is shown in figure 6(c).The Dαline shape at 1300-1500 ms with MARFE is shown in figure 6(d).
The Dαline shape is mainly affected by the instrument broadening,Doppler broadening,Stark broadening and Zeeman broadening mechanisms [28].The instrument width ΔλInstrumentis about 10 pm with a Gaussian line shape,as shown in section 2.3.The Doppler line shape originates from the thermal motion of D atoms,and presents a Gaussian line shape.The Doppler width ΔλDis expressed as
whereMis the relative atomic mass of the D atom,and λ is the central wavelength in nm. ΔλDis only related to the temperatureTDof D atoms.The Zeeman broadening with a Lorentz shape originates from the energy level splitting by external magnetic field with a width of ΔλZas
whereBis the magnetic field.Ambient charged particles influence the emission process of radiators.This results in a broadening and shift of spectral lines with a Lorentz shape,which is termed Stark broadening [29,30].The Stark width ΔλSis mainly related to the local electron densityne,
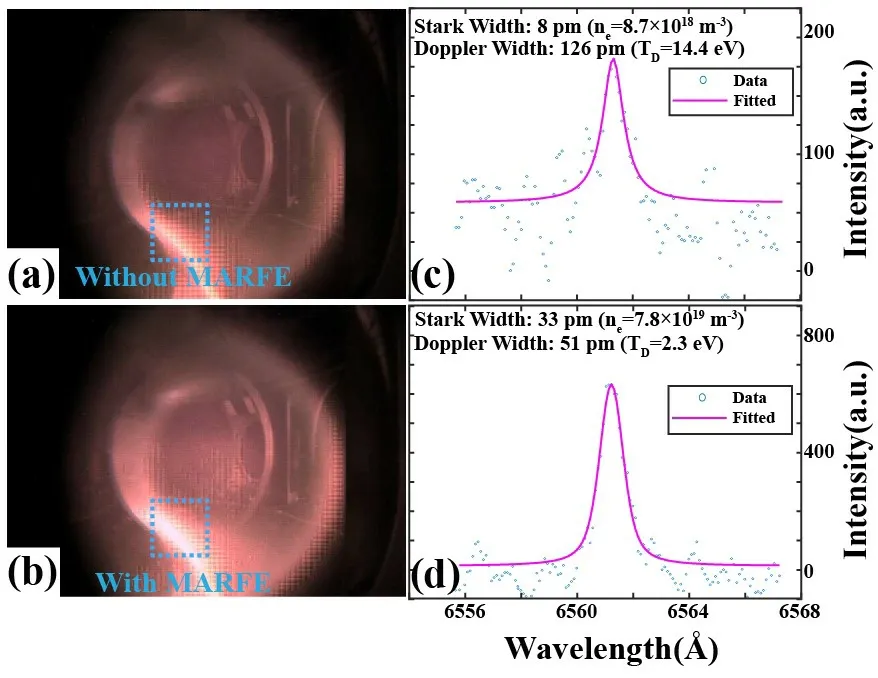
Figure 6.Visible light images and Dα line shape fitting for the cases without (top row) and with (bottom row) MARFE.
The measured Dαline shape is the convolution of the Lorentz line shape and Gaussian line shape with different functions [28].A nonlinear least-square fitting routine is used to obtain the fitted Lorentz and Gaussian line shape separately.The Doppler width is obtained by extracting the instrument broadening effect from the total broadening ofthe Gaussian line shape,ΔλD=The Stark width is obtained by extracting the Zeeman broadening effect from the total broadening of the Lorentz line shape,ΔλS=ΔλLorentz-ΔλZ.The temperature and density are then estimated from the Doppler width and Stark width,respectively [10,11,30].
The local electron density and deuterium temperature near the X-point are investigated by analyzing the Dαline shape before and after the MARFE onset.At 1040-1240 ms without MARFE,the fitted Stark width is ΔλS=8 pm with a fitting uncertainty of ±3 pm,and the calculated electron density is 8.7×10¹⁸m-3with an uncertainty of±4.1×10¹⁸m-3.The fitted Doppler width is ΔλD=126 pm with a fitting uncertainty of ±21 pm,and the calculated deuterium temperature is 14.4 eV with an uncertainty of±4.6 eV.These are shown in figure 6(c).At 1300-1500 ms with MARFE,the Dαintensity is enhanced by about three times,as shown in figure 6(d).The fitted Stark width is ΔλS=33 pm with a fitting uncertainty of ±6 pm,and the calculated electron density is 7.8×10¹⁹m-3with an uncertainty of ±2.0×10¹⁹m-3.The electron density rises after MARFE appears,and is even higher than the line-averaged density.This feature of high local electron density in the MARFE region was also reported in Alcator C-Mod and EAST [31].Meanwhile,the fitted Doppler width is ΔλD=51 pm with an uncertainty of ±8 pm,and the calculated deuterium temperature drops to 2.3 eV with an uncertainty of ±0.7 eV.The localized high density,low temperature and enhanced radiation of MARFE are in agreement with previous observations on tokamaks [2,23,31,32].
4.Conclusion
We have developed a D-OES diagnostic on the HL-2A tokamak.One route is used to measure wide-range spectra,and the other route is used to acquire high-resolution line shapes.The D-OES diagnostic consists of a dedicated imaging system,a beam-splitting system,fiber bundles,a spectrometer system,and a control and acquisition PC.The spectral coverage of the wide-range spectrometers is 200-1000 nm with a resolution of 0.8 nm,while the spectral resolution/coverage of the high-resolution spectrometer is 0.01 nm/6 nm.The D-OES can measure the optical spectra near the Xpoint region of the HL-2A with both the wide spectral range and the high-wavelength resolution.The spatial resolution of each route of D-OES is about 4 cm with 11 channels.The temporal resolution is 16 ms at maximum in the single-channel mode.The D-OES diagnostic is tested using a DC hydrogen glow discharge in the lab.The high-resolution Hαline shape and the wide-range spectra including the hydrogen Balmer series and hydrogen Fulcher alpha band are observed.By conducting D-OES measurements in the highdensity operations of the HL-2A tokamak,the electron density and deuterium temperature in the X-point MARFE region are derived at the same time from the fitted Dαshape,and instrument broadening,Doppler broadening,Stark broadening and Zeeman broadening are taken into account.After the onset of MARFE in discharge #38260,the electron density is observed to increase from~ 8.7×10¹⁸m-3to~7.8×10¹⁹m-3,and the deuterium temperature drops from~14.4 eV to~2.3 eV.
Acknowledgments
The authors thank the HL-2A team for their support with the experiments and discussion.This work was supported by the National MCF Energy R&D Program of China (Nos.2018YFE0301102,2022YFE03100004 and 2018YFE 0303102),National Natural Science Foundation of China(Nos.12375210 and 12305238),and the Sichuan Natural Science Foundation (Nos.2022NSFSC1791,2022JDRC0014 and 2022TFQCCXTD).
杂志排行
Plasma Science and Technology的其它文章
- An improved TDE technique for derivation of 2D turbulence structures based on GPI data in toroidal plasma
- Inward particle transport driven by biased endplate in a cylindrical magnetized plasma
- Progress of Lyman-alpha-based beam emission spectroscopy (LyBES) diagnostic on the HL-2A tokamak
- Forward modelling of the Cotton-Mouton effect polarimetry on EAST tokamak
- Development of a toroidal soft x-ray imaging system and application for investigating three-dimensional plasma on J-TEXT
- Electron density measurement by the three boundary channels of HCOOH laser interferometer on the HL-3 tokamak