Empowering smart city situational awareness via big mobile data∗
2024-03-01ZhiguangSHANLeiSHIBoLIYanqiangZHANGXiatianZHANGWeiCHEN
Zhiguang SHAN ,Lei SHI‡ ,Bo LI‡ ,3 ,Yanqiang ZHANG,Xiatian ZHANG,Wei CHEN
1State Information Center, Beijing 100045, China
2School of Computer Science and Engineering, Beihang University, Beijing 100191, China
3Zhongguancun Laboratory, Beijing 100094, China
4Beijing Tendcloud Tianxia Technology Co., Ltd., Beijing 100027, China
5The State Key Lab of CAD & CG, Zhejiang University, Hangzhou 310027, China
Abstract: Smart city situational awareness has recently emerged as a hot topic in research societies,industries,and governments because of its potential to integrate cutting-edge information technology and solve urgent challenges that modern cities face.For example,in the latest five-year plan,the Chinese government has highlighted the demand to empower smart city management with new technologies such as big data and Internet of Things,for which situational awareness is normally the crucial first step.While traditional static surveillance data on cities have been available for decades,this review reports a type of relatively new yet highly important urban data source,i.e.,the big mobile data collected by devices with various levels of mobility representing the movement and distribution of public and private agents in the city.We especially focus on smart city situational awareness enabled by synthesizing the localization of hundreds of thousands of mobile software Apps using the Global Positioning System(GPS).This technique enjoys advantages such as a large penetration rate (∼50%urban population covered),uniform spatiotemporal coverage,and high localization precision.We first discuss the pragmatic requirements for smart city situational awareness and the challenges faced.Then we introduce two suites of empowering technologies that help fulfill the requirements of (1)cybersecurity insurance for smart cities and(2)spatiotemporal modeling and visualization for situational awareness,both via big mobile data.The main contributions of this review lie in the description of a comprehensive technological framework for smart city situational awareness and the demonstration of its feasibility via real-world applications.
Key words: Smart city;Mobile data;Situational awareness
1 Introduction
Smart city is a term originally coined by IBM as part of its marketing initiative(Palmisano,2008).The concept of a smart city has grown rapidly and come to encompass and integrate cutting-edge information technologies,such as the Internet of Things(IoT) (Kamal et al.,2023),cloud computing (Qi et al.,2021),big data (Chen W et al.,2021),and digital twins (Caldarelli et al.,2023).Worldwide,the development and realization of the smart city initiative have significantly accelerated the transition of cities into the modern era,by transforming their current models of urban planning(Cheng et al.,2022),service,and management into smarter ones.
With the recent waves of modernization in global cities,governments and citizens have benefited significantly,and are yet posed with multifaceted challenges,e.g.,inefficient transportation systems,surging carbon emissions,and critical emergency events.Empowered by the comprehensive smart city infrastructure in place nowadays,and considering the vastness of the urban space characterizing smart cities and the potential for provisioning the same in real time,a new research domain has emerged to ascertain the optimal means for enabling situational awareness within modern cities.More formally,smart city situational awareness refers to the utilization of technologies such as IoT and big data to acquire,process,and analyze key dynamic data on urban operations.By generating statistical indicators that describe the city operational status,aggregating and promptly notifying the presence of anomalies,and leveraging historical data to forecast short-and long-term urban conditions,the city management agencies are empowered to understand the current state and trends,proactively identify and address abnormal situations,and obtain valuable data-driven insights to support decision-making and urban planning.Smart city situational awareness is normally supported by contemporary urban data sources including but not limited to surveillance video cameras,mobile localization systems(Wei et al.,2022),multi-source satellite imagery(Tang et al.,2016),and meters/sensors in municipal infrastructure.While all kinds of urban data sources can be important in enhancing smart city situational awareness,this paper focuses on the methodology,effectiveness,and case studies relevant to implementing big mobile data in an urban scenario.Compared with most other data sources,big mobile data enjoy the advantages of a higher penetration rate among urban users and a broader coverage of the spatiotemporal urban territory.
1.1 Big mobile data: concept,taxonomy,and overview for smart city applications
Essentially,sensing is the first step in empowering smart city situational awareness.For example,for understanding the traffic status of a city,the sensing technology has been widely deployed to detect vehicle movement information.Modern intelligent buildings are equipped with facility sensors for temperature and air quality and also fire alarms to ensure workplace health and track emergencies.Considering all the urban sensing technologies,the resulting data generated can be divided into two categories:the first type represents the traditional sensing data measured statically in an urban space,typically the roadside inductive-loop sensors to detect traffic volume;the second type is composed of dynamic urban data normally collected by moving agents within a city in real time.Regarding smart city situational awareness,the new dynamic data collection methodologies have played a more important role,mainly because the requirements on situational awareness(Section 2)are mostly time-critical and could be anywhere in a city.
Big mobile data,characterized by their real-time nature,high data value,and extensive scale,can be combined with other datasets to provide valuable insights into comprehending smart city situational awareness.For example,integrating big mobile data with traffic data enables a more refined analysis of residents’ mobility patterns,including their movement directions and travel durations within the city.Such insights can greatly assist city management agencies in optimizing urban road networks,facilities,and overall infrastructure planning.The big mobile data studied in this paper are obtained majorly from a number of dynamic urban data sources.They are defined as the data collected by devices with various levels of mobility that represent the movement and distribution of public (e.g.,buses,trains) or private (e.g.,people) agents in the city.The generated mobile data at the entire city scale could be extremely large (petabyte or above),consist of multiple data modalities (locations,statuses,images,videos,etc.),and are essentially dynamic in space and time.According to Zheng et al.(2014),we further classify the means of acquisition of big urban mobile data into the passive sensing and participatory sensing modes.For mobile data derived from the passive sensing mode,e.g.,the call detail records (CDRs) from mobile cell phones,agents do not need to know the detailed sensing process,and the data collection is generally objective.In contrast,for mobile data derived from the participatory sensing mode,e.g.,tweets/weibo with location information uploaded by urban users,agents need to actively report their situation/information and the data collection can be subjective.
Apart from these two main types,much of our work in this paper (Section 4) builds on a new kind of big mobile data not only obtained by synthesizing the GPS sensing of hundreds of thousands of mobile Apps,typically hosted by TalkingData Inc.(Shi et al.,2021a),but also available from other public/private urban shareholders.Compared with other kinds of mobile data,this new source enjoys three advantages: first,the penetration rate on the urban population is as high as 50%in megacities having millions of residents,while most previous data sources cover only specific groups of the population(e.g.,tourists,drivers);second,the spatiotemporal distribution is highly consistent with the mobility of the entire population,while a lot of traditional mobile data sources focus on the regular spatial regions and temporal intervals (e.g.,road networks by GPS navigation Apps);third,due to the use of GPS sensing,the spatial precision(<100 m)is much better than that with other data sources using mobile base stations or Wi-Fi.Empowered by this new generation of big mobile data,the situational awareness of smart cities can be greatly enhanced in many real-world scenarios,as we elucidate in the present paper.
1.2 A technical framework for smart city situational awareness over big mobile data
Fig.1 illustrates an overall technical framework to enable smart city situational awareness using big mobile data.The framework includes,first,the various requirements from urban shareholders (government,enterprise,citizen)for enabling situational awareness(Section 2).To satisfy these requirements,comprehensive smart city infrastructure has been built up,encompassing elements reused from common infrastructure (e.g.,the Internet and mobile network)and software/hardware specially manufactured for situational awareness (command center,executive dashboard).On the other hand,shareholders design big mobile data standards and the data needed for these can be collected through the use of the sensing infrastructure deployed in smart cities;such data encompass both passive crowd sensing data and participatory sensing data.The big mobile data are then processed via a sequence of urban computing engines,including but not limited to mobile data management &sharing,analytics &mining,and visualization&visual analytics.In this paper,we will focus on the technology for smart city cybersecurity and the spatiotemporal visual analytics methods for a smart city.The framework and associated technology have been successfully deployed in many smart city applications ranging from business optimization to urban culture and tourism.
This paper focuses on the big mobile sensing data and their processing or analysis for rudimentary situational awareness.For advanced requirements for smart city situation understanding and emergency response,state-of-the-art high-throughput remote sensing technology can be deployed (Tang et al.,2019).For example,with the development of consumer-level RGB-D sensors,indoor 3D scene modeling in cities can be achieved with improved accuracy and reduced cost.Yuan ZL et al.(2021)have conducted a survey on the recent advancement of this new kind of sensing technology.
1.3 Related reviews
The worldwide development of smart city situational awareness has attracted great attention from the research community.Previous works have systematically reviewed the situational awareness of smart cities in different fields,such as network security(Franke and Brynielsson,2014;Yao JY et al.,2019;Neshenko et al.,2020;Jiang LY et al.,2022),natural disasters (Vongkusolkit and Huang,2021),and life monitoring(Woodward and Ruiz,2023).For example,Franke and Brynielsson (2014) conducted a survey in the field of cyber situational awareness,in which they ran queries on four leading scientific databases to form a good review of 102 articles comprised in the literature on the topic.Thereafter,Yao JY et al.(2019) conducted a survey from three aspects: network security situation element extraction,network security situation assessment,and network security situation prediction,aiming to ascertain the internal relationship among these security elements and analyze the security situation of urban networks in real time.However,the ambiguity of the evolving cyber threats and their damaging consequences presents new obstacles for policymakers.Hence,Neshenko et al.(2020) examined the threat landscape of smart cities,discussing the potential impact of specific attack types and investigating and revealing advances in data-driven situational awareness approaches.Considering that network data visualization can provide efficient and meaningful insights into smart city situational awareness,Jiang LY et al.(2022) systematically reviewed and analyzed the literature on network situational awareness visualization,visualizing not only threat information but also impact information,response plans,and information shared within teams,and provided support for translating research findings into industrial practices.
Additionally,several studies have systematically analyzed situational awareness in other areas of smart cities.For example,Vongkusolkit and Huang(2021) explored social media data (i.e.,data from sources such as Twitter and Facebook) to improve situational awareness during disasters and outline existing situational awareness classification patterns for urban natural disaster events from five different analytical perspectives(content,time,user,emotion,and spatiotemporal).Woodward and Ruiz (2023)conducted a systematic literature review to examine how information is currently presented in augmented reality (AR),specifically in systems used for health situational awareness.They focused on visual elements (e.g.,monitoring a patient’s vital signs) to enhance the environment.A total of 140 relevant studies were analyzed.
However,situational awareness in the context of smart cities has not been thoroughly studied.First,the aforementioned review studies are all aimed at a single field of urban service and strongly rely on traditional static city-monitoring data and lack a comprehensive study on real-time smart city situational awareness.Second,the existing reviews have ignored the heterogeneity,dynamics,and complexity of smart city network security data.Third,existing smart city situational awareness reviews are all at the government level.Contrastingly,the unique insights of this paper are: (1)we focus on the relatively new but very important urban data sources,namely,the big mobile data collected by devices with various levels of mobility,both exploring multiple fields of smart cities and distilling technical commonalities in different fields;(2) at variance with the approaches adopted in existing cyber-security situational awareness reviews,we leverage heterogeneous information networks to model the complex network security dependencies of smart cities and consider dynamic detection technology to defend against new network attacks in real time;(3)we concentrate on the situation awareness at the individual level in the context of smart cities,which can enable the provision of more fine-grained services.
1.4 Technical challenges
To harness the vast potential of big mobile data for enhancing smart city situational awareness,this paper delves deep into the multitude of challenges that need to be overcome for the successful development and deployment of algorithms and platforms.These challenges encompass diverse facets,including data privacy,the nature of sparse data,scalability issues,and the integration of these innovations with existing urban infrastructures.
1.4.1 Data privacy
The metropolitan-scale measurement of human trajectories via mobile sensing data inherently introduces the significant challenge of data privacy.Within this domain,two primary obstacles emerge.First,the essence of mobile sensing data,often laden with personal identifiers or attributes,underscores the critical need for anonymity preservation.Despite the necessity of ensuring anonymity,achieving complete data anonymization without diminishing its quality and pertinence is intricate,leading to the indispensable design of algorithms that discern meaningful patterns without betraying individual identities.Second,the ever-evolving landscape of data privacy laws worldwide necessitates steadfast regulatory compliance.This entails not only a thorough comprehension of varied legal edifices but also the incessant refinement of platforms and algorithms to be in tandem with these changing mandates.
1.4.2 Sparse data
As a result of pragmatic constraints,the data collected often exhibit sparsity over time,with average record intervals as long as many hours.Notably,this sparsity impacts inference algorithms.Traditional mobility inference algorithms designed for dense trajectories struggle in the face of sparse data.Additionally,visualization requirements become more complex.The urban trajectory data have long-tailed temporal sparsity due to privacy concerns,implying that existing visualization techniques for dense data might not be directly applicable.
1.4.3 Computational costs and scalability
Scalability becomes a critical concern when examining the mobility behavior of large urban populations.Specifically,the enormous population size of modern cities,which can contain tens of millions of individuals,leads to extensive location records.This vastness,in turn,results in scalability issues when profiling and comparing mobility behavior.Furthermore,resource allocation is a cornerstone challenge.Ensuring that algorithms and platforms can effectively use available computing power and storage resources to cater to the demands of smart city applications becomes paramount,especially when managing and optimizing computational resources to process and analyze such a vast amount of data efficiently.
1.4.4 Integration with existing infrastructures
The integration of innovative algorithms and platforms with existing urban infrastructures poses its own set of formidable challenges.Specifically,real-time data handling is essential.To incorporate these technologies into live trajectory streams,robust real-time data handling capabilities must be developed,with the core challenge being the creation of systems that can efficiently process incoming data streams in real time while safeguarding data integrity and accuracy.Additionally,security and reliability take precedence.The integration process mandates a high priority on data security and system reliability because smart city applications frequently handle sensitive information and necessitate uninterrupted operation.Thus,implementing robust security measures and fail-safe mechanisms is of the utmost importance.
2 Smart city situational awareness and key applications in China
Situation awareness is a key technology for improving urban governance,and mobile big data are an important source for situation awareness.In this section we introduce the requirements for smart city situational awareness,analyze the role of big mobile data in smart city situational awareness,and provide case studies involving the use of situational awareness to improve urban governance,aiming to provide an intuitive understanding of empowering smart city situational awareness via big mobile data.
2.1 Requirement analysis
2.1.1 Essential requirements for urban governance capabilities
Based on IoT and big data technology,smart city situational awareness realizes the identification,status monitoring,information collection,and data analysis of people,municipal facilities,the ecological environment,and road vehicles through satellite positioning,video monitoring,radio frequency identification,sensing conversion,and other IoT sensing means,forming a city operation sensing neural network with territory-wide coverage.It offers data support for dynamic perception,rapid reflection,and scientific decision-making regarding urban operation.Smart parking,smart manhole covers,smart meter reading,smart streetlights,smart security,and other IoT applications achieve intelligent management and remote scheduling,and the connection between people and people,people and things,and things and things will be more seamless and convenient,thereby making city management more efficient.Based on smart city situational awareness,the “city brain” can collect dispersed urban data,detect urban vital signs,optimize urban resource allocation,and strengthen urban risk control.It plays a crucial role in comprehensively enhancing urban quality,improving the living environment,enhancing the ability to cope with risks,and enhancing urban “resilience” in all aspects,spawning new digital,networked,informed,and intelligent concepts and modes of urban governance.
2.1.2 Importance of achieving urban sensitive governance
In recent years,urban operations have frequently been disrupted by unforeseen public events.Currently,the urban governance scenario is transforming into a combination of peacetime and wartime as well as a sensitive state system,and the urban governance paradigm is being converted into space–time integration and human–computer interaction.Data flow is required to drive the global control flow,business flow,element flow,and decision flow in such a way that a quick and timely response always stands enabled,to support the efficient allocation and optimization of resources and the rapid coordination and interconnection of systems,and to facilitate the formation of the global optimum and group wisdom.Smart city situational awareness creates a cyberspace representation of the city’s numerous subsystems and their intricate relationships.Combined with real-time IoT systems(Yuan B et al.,2019),it can facilitate the transformation of urban governance from human-intensive to human–computer-interactive,as well as the shift from empirical judgment to data analysis and from disposal of inert to active discovery.
2.1.3 Promoting the fusion of cyber-physical systems in smart cities
Physical space,social space,and information space overlap one another in cities,which are open,complex,and gigantic systems.The emergence and effectual functionality of a smart city is an outcome of the wisdom transformation of the city under the conditions of triadic space (Guo et al.,2020),which is made possible with the utilization of digital technology and triadic space big data (Chen W et al.,2021)to build a city governance model in cyberspace that matches the governance of the physical space,to promote the simultaneous planning and construction of digital cities and real cities,to optimize the spatial structure and infrastructure of the city,and to enhance the operational efficiency.The link between the physical and the digital cities is exactly smart city situational awareness.Through the cyber-physical system,a closed-loop empowerment system based on the automatic flow of data between the information space and the physical space is created to realize the synergy and optimization of the physical and the digital cities.The IoT technology,geographic information systems (GISs),and building information modeling (BIM) enable the digital twin city to sense changes in the physical city in real time and obtain insight into the risks associated with urban operations.Alternatively,through planning,design,and other simulations of the digital twin city,the city can be intelligently warned of potential negative impacts,conflicts,and potential dangers,thereby guiding and optimizing the planning and administration of the actual city.
2.2 Role of big mobile data
2.2.1 Emerging model of smart city situational awareness
Numerous innovative applications,such as the city management hand shot,the traffic police App illegal report,the epidemic prevention and control scanning operator QR code to check the personal trajectory,and other public interaction and mass prevention innovation applications,have generated a large amount of mobile big data,constituting an important source of data for smart city situational awareness,thereby enhancing urban governance capabilities.During the epidemic,the digital itinerary card platform,developed by the China Academy of Information and Communications Technology in collaboration with China Telecom,China Mobile,and China Unicom,used mobile phone signaling data to provide mobile Internet users with 14-day location information queries,providing a scientific basis and monitoring means to ensure the orderly movement of people across areas.Using prevention and control of the COVID-19 epidemic as an example,many cities use the mobile big data technology to analyze,identify,and mine the migration trajectories of target populations through government big data sharing and Internet big data interaction,to find people in close contact with suspected populations,and to visualize data such as the regional distribution of people’s origins,the number of new health abnormalities,the number of people returning each day,statistics on people departing the domain,and transportation rides.Such a strategy can effectively aid the government in analyzing high-risk groups,identifying suspects,and conducting effective research on key individuals and areas.
2.2.2 Boosting human-centered urban governance
Cities are where people live and work,and more than 55% of the world’s population presently resides in cities,a number that is projected to increase to 70% by 2050 (UN DESA,2019).China’s urbanization rate has reached 65.22% by the end of 2022(National Bureau of Statistics,2022).By technology integration,business integration,and data integration,smart cities could achieve cross-level,cross-regional,cross-system,cross-department,and cross-business collaborative management and services,thereby enhancing the people’s sense of access,happiness,and security.Along with the rapid development of population,society,and the economy,cities exhibit rapid change and large spatial differences at multiple levels and dimensions.Massive mobile big data have been generated by the wide use of smart mobile devices and geolocation systems,and such data can reveal the city’s status,hotspots,and trends,as well as other situational information connected with the city from multiple dimensions such as time and space.It is advocated that the concept of urban governance evolves from one-way management to two-way interaction,offline to online–offline integration,and departmental to comprehensive governance.
2.2.3 Promoting innovative urban planning and layout optimization
Mobile big data can track the dynamic situation of urban operation in terms of parameters such as people flow,traffic flow,and logistics in real time(Yao YY et al.,2022),and help urban management departments monitor urban operations by integrating the offline location distribution and online behavioral characteristics of urban people and vehicles,combining spatial bearing,analysis and simulation,trend prediction,and operational assessment analysis of urban layout,and facilitating the pursuit of a more scientific understanding of urban layout.By analyzing data on the movement trajectories,travel times,and destinations of urban vehicles and pedestrians,plausible traffic control policies can be developed to direct traffic flows to suitable routes,thereby reducing traffic congestion and energy waste.Zhang RJ (2019) conducted a study on bus network optimization using the big data of shared bicycle trajectories,with the minimization of residents’ travel time and the minimization of bus network operation costs as the optimization objectives,and constructed a model for urban bus network optimization,thus arriving at innovative concepts for use in such optimization.Liao CC et al.(2023) used Gaode map data to identify and analyze the spatial organization structure,node characteristics,and linkage mechanism of the transportation linkage network in the Guangdong–Hong Kong–Macao Greater Bay Area,thereby contributing to the Bay Area’s future development planning.
2.3 Case studies
2.3.1 Worldwide technological effort
In the promotion of smart city situational awareness applications abroad,information and communication technologies are used to sense,analyze,and integrate the key information from the core systems of urban operations,thereby providing intelligent responses to diverse needs,such as people’s livelihood,environmental protection,public safety,urban services,and industrial and commercial activities.By sensing,monitoring,analyzing,integrating,and displaying various data,Dubuque in the United States uses IoT technology to digitize and connect all the city’s resources,including water,electricity,oil,gas,transport,and public services,to provide an overview of the entire city’s resource usage,intelligently respond to citizens’ needs,and reduce the city’s energy consumption and costs,thereby enhancing the government administrative efficiency and city management.By constructing a citywide Internet network,Seoul (Chen Q,2014) has made it possible for its citizens to use or manage various social services from any part of the city,learn about water,air,and traffic conditions,control electronic and electrical devices in their homes,and even track the movements of their minor children.More than 20 000 smart sensors have been installed in Barcelona(Yan H and Xu,2022),allowing collection of data for the ascertainment of various elements of information,including weather,noise,and traffic flow;analysis of such data would assist in better management of various smart city functionalities through the city’s operation system.For example,the smart bins can automatically sense the quantity and volume of waste,and when the bins are about to be filled,the internal sensors will feed the information to the central control system,and the staffwill arrange the routine accordingly.
2.3.2 City brain projects in China
In the domestic development of smart city situational awareness construction,the system concept is emphasized,and modern information and communication technologies are employed to achieve intelligent urban infrastructure,scientific urban planning&design,refined urban operation &management,universal urban public services,and modernized urban governance.Specifically,cities such as Beijing,Shanghai,Guangzhou,Hangzhou,and Shenzhen (Liao RZ and Chen,2022) have adopted the integrated city management platform as their guiding principle and have prioritized practical applications.To ensure this platform’s validity in the case of specific application scenarios,through the construction of the city brain,city transport center,and other system platforms,comprehensive integration and convergence of regional suspicious subjects,places,incidents,activities,and other governance elements have created a “one map” that covers grid management,public services,urban transportation,comprehensive law enforcement,and other key areas of governance elements.The “one map” facilitates instantaneous cognizance of the operational status of the city.Positive results have been achieved in the prevention and control of traffic congestion,the quick response to in-door emergencies through building information modeling (Tang et al.,2022),and the optimization of industry.Based on hydrological,meteorological,and drainage data,combined with urban hydrological models and electronic maps,Gu(2023)’s Huizhiguan urban operation and management hub enables the visualization and simulation of the evolution of flooding in flood-prone areas,serving as a reference for flood prevention and relief.Shanghai has constructed China’s first mega-city operation digital indication system(Wang Z,2021),which subdivides various city operation indications into more than 1000 indicators in 55 categories,forming a neuron system for city operation encompassing the entire city.More than 34 million pieces of real-time,dynamic data,pertaining to parameters such as water quality,district entrance,exit safety,and elderly services,are collected daily via 218 categories and over 11 million IoT terminals.Through the scientific application of threshold management,color management,and closed-loop management,the system enhances its capacity to detect problems and analyze the situation,and creates a new governance model for megacities.
3 Cybersecurity insurance for smart city via big mobile data
As the Internet continues to move toward openness and intelligence,cyberattack tools are increasingly available,which gradually reduces the cost of network intrusion.Cyberattacks could severely affect people’s production and lives in the city(Skopik et al.,2016;Wang Q et al.,2020).At present,the Internet ecosystem is in a dynamic and changing environment,and the network security guarantee of smart cities requires timely and reliable attack detection and defense technology to enable an understanding of the potential internal and external threats to the smart city system and minimize risks (Singh et al.,2019;Kamal et al.,2023).Therefore,accurate analysis and detection of cybersecurity threat intelligence,malicious code,and network traffic is of practical significance to the cybersecurity situational awareness of smart cities.
3.1 Large-scale threat intelligence analysis for smart city
Cyber threat intelligence is organized and shared in the form of an indicator of compromise(IOC),which is the fingerprint information that network threat intelligence uses for security protection,such as against malicious domain names and malicious file signatures (Tounsi and Rais,2018).As shown in Fig.2,smart city mobile terminals(such as hacker forums and black production platforms) are filled with a large number of description texts related to network threats,and these description texts contain a large number of IOCs with security protection value.According to different data sources,network threat intelligence can be divided into external network threat intelligence and internal network threat intelligence (Qamar et al.,2017).The external network threat intelligence focuses on extracting malicious IOC from the open-source threat description text,while the internal network threat intelligence focuses on analyzing internal system traffic,logs,and other data to identify potential network threats.
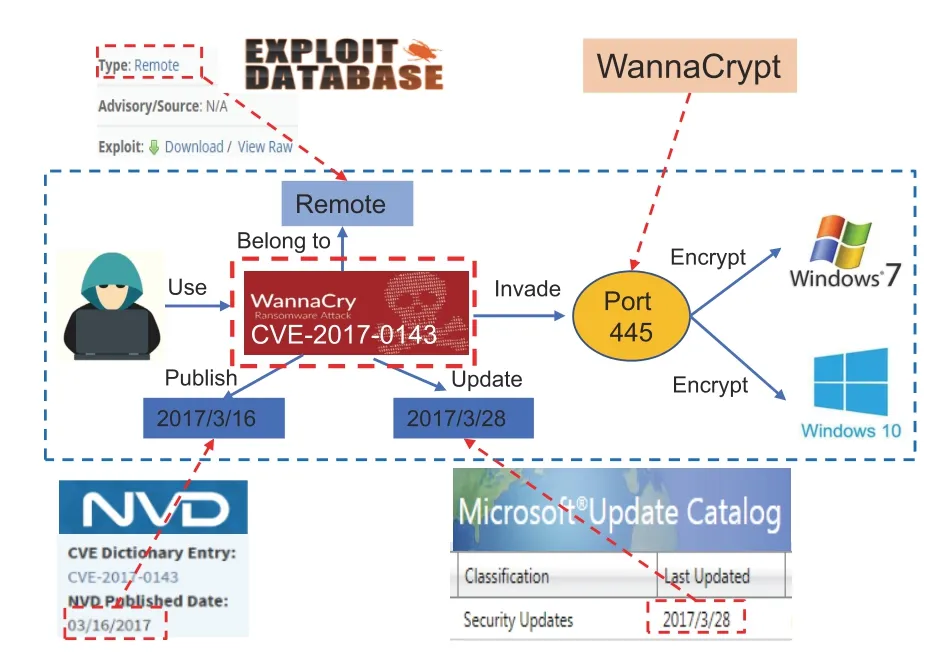
Fig.2 Multisource heterogeneous network threat intelligence analysis in smart cities
3.1.1 Smart city’s external network threat intelligence analysis
Recently,Zhao J et al.(2020a) focused on extracting external network threat intelligence from social texts,which is formalized as: given a set of network threat description textsD={d1,d2,...,dn},they first identified all IOCs that meet the requirements indi(i=1,2,...,n) using the context-aware IOC extraction algorithm;then they extracted the correlation relationship between the IOCs using the syntactic shortest dependency tree (Chen DQ and Manning,2014)based on accurately identifying malicious IOCs and represented the relationship in the triple form (IOCi,relationj,IOCi+1);finally,they aggregated all the extracted threat relation triples into a heterogeneous graphG=(V,E).The external network threat intelligence extraction algorithm proposed in this subsection solves the problem of high false positive rate of IOC extraction,using the shortest syntactic dependency tree to extract the association relationship between IOCs and heterogeneous graphs to conduct fusion modeling of the association relationship.It is a prerequisite for further realizing the representation learning of network threat intelligence.
The purpose of network threat intelligence representation learning is to learn a mapping function to embed unstructured threat intelligence into a lowdimensional vector space and to calculate the interaction relationships of IOCs.This subsection presents a threat intelligence representation learning framework based on hierarchical attention learning,which is formalized as: given a network threat intelligence heterogeneous graphGand the corresponding meta-path setψ={P1,P2,...,PM},wherePm(m=1,2,...,M)represents themthmeta-path in the heterogeneous graph,the learning tasks of the network threat intelligence representation based on hierarchical attention learning include: (1)calculate the importance of each neighbor node of the connected nodeviunder the path to represent the node and obtain the node level attention weight under meta-pathPm(Wang X et al.,2019);(2) learn the importance of different meta-pathsPm’s to represent nodevi,and obtain the attention weight of each meta-path level;(3)learn the feature information ofvi’s neighbor nodes of different importance under all meta-paths simultaneously using the attention weights of nodes and meta-paths,use the learned features to represent it,and obtain its low-dimensional representation learning vector(Fu et al.,2020).The embedded network threat intelligence can realize automatic analysis and mining and support the downstream automated intelligence analysis.
3.1.2 Smart city’s internal network threat intelligence analysis
This subsection focuses on the research of internal network threat intelligence in smart cities and takes the identification of botnet nodes from traffic data as an example to study the modeling method of internal network threat intelligence(Albanese et al.,2019).It includes mainly four important phases,which are:
1.AHIN construction: To consider a more sophisticated network flow entity,Zhao J et al.(2020b)mainly extracted the entity in the network traffic into a six-tupleγ=(IPsrc,IPdes,Port,Protocol,Request,Response).To further study the interaction relationship between heterogeneous entities in network traffic,six types of basic interaction relationships are considered between heterogeneous entities and a heterogeneous graph is used to model them.
2.Similarity embedding: Meta-paths and metagraphs are effective tools for depicting interaction relationships between heterogeneous entities (Sun et al.,2011).Ten meta-paths and seven meta-graphs are designed to depict the interaction relationships between botnet nodes.The main purpose of the node similarity evaluation algorithm proposed is to map host nodes in heterogeneous graphs to homogeneous networks and learn their interaction patterns in heterogeneous graphs.In view of this,a node similarity evaluation algorithm based on weight learning is proposed to evaluate the similarity between host nodes in the two dimensions of meta-path and meta-graph(Zhao H et al.,2017)separately,and to embed it into the similarity adjacency matrixA.
3.Graph convolution operation(Li et al.,2018):Based on the source IP adjacency matrixAobtained by the host similarity evaluation algorithm and the eigenmatrixXobtained by the source IP,graph convolution operationG(X,A)can synchronously learn the node attribute features of the source IP and the interactive behavior patterns between them,so as to ensure the learning of more refined and more distinguished botnet node features.
4.Botnet node detection: The embedded features obtained based on the graph convolution operation are inputted into a two-layer forward neural network and an automated model is trained to judge whether a host node is a botnet node.
3.2 Malicious code detection for smart cities
With the continuous upgradation and development of the network technology,smart city malicious code attacks are becoming more complex and diversified.However,traditional network security protection schemes(such as firewalls and gateways)rely on existing matching rules and cannot cope with tens of thousands of malicious codes every day (Abdelnabi et al.,2020;Xiong et al.,2022).Therefore,accurate analysis and real-time detection of malicious codes have practical significance for forward-looking smart city network security protection.
3.2.1 Real-time malicious code detection for smart cities
Given the execution event flow of the target malicious code,Liu C et al.(2021) first used the sliding window (Wang JY et al.,2019)W={W1,W2,...,WT}to process it and modeled it into a dynamic heterogeneous graph sequenceG={G1,G2,...,GT},whereGt(t=1,2,...,T) represents the graph snapshot of the target malicious code at timet.Therefore,the real-time detection framework of malicious codes based on dynamic heterogeneous graph learning includes mainly the following three modules:
1.Malicious code dynamic heterogeneous graph building module: Given the newly arriving behavior eventDtin the current window of malicious code,Gtcan add new events inDtbased onGt-1and remove the expired event generation.
2.Dynamic graph learning module: Specifically,according to the proportion of new nodes inGt,two dynamic graph encoders are designed which can incrementally update the graph embedded in the current windowhGtaccording to the outputhGt-1of the previous window:
whereu1,u2,...,unare dynamic neighbor nodes in the current heterogeneous graphGt.
3.Real-time detection module: This module calculates the similarity betweenhGtof the target malicious code and all known malware family samples.Then,the sample families with the highest similarity and exceeding the threshold valueτare outputted as the real-time detection results.
3.2.2 Few-shot malicious code detection for smart cities
Previous malicious code detection techniques rely too much on supervised learning methods,resulting in the absence of sufficient samples and real labels to effectively detect few-shot malicious codes(Park et al.,2019;Liu YX et al.,2021).Therefore,a few-shot malicious code detection framework(Fig.3) is proposed based on contrastive learning.Liu C et al.(2022)first used the attribute heterogeneous graphGito model the malware objects contained in the target malicious code instance.Giincludes processes,application programming interfaces(APIs),files,networks,signatures,and their interactions(Fan et al.,2018;Zhang XH et al.,2020).Then,they designed prior knowledge based graph augmentations to generate real positive instance pairs and negative instance pairs of target malicious code through three types of transformation,including attribute masking,metapath-based sampling,and obfuscation.Afterward,they employed graph attention network (GAT) encoders to learn the graphlevel representations ofGi,,andseparately,where the subscripts P and Q represent the encoders for processing positive and negative samples,respectively.Finally,they adopted the discriminator(Hassani and Khasahmadi,2020) to evaluate the consistency between the graph-level representations of instance pairs by contrast loss and predict the malicious family ofGi.
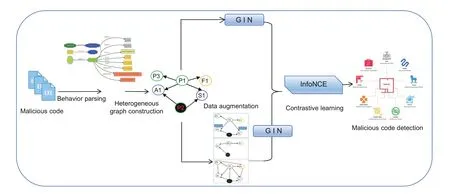
Fig.3 Few-shot malicious code detection framework for smart cities
3.3 Cyberattack detection for smart cities
The importance of smart city network security is steadily increasing.Timely detection of attack behavior and abnormal states in network traffic is crucial for avoiding large-scale network attacks (Yang et al.,2022).Network traffic packets contain abundant traffic feature information,which is an excellent source of network attack detection.
3.3.1 Network attack traffic detection for smart cities
Lan et al.(2022b) proposed a multi-task learning model with hybrid features to solve the challenge that the existing single model makes it difficult to identify multiple network attack traffic in smart cities(Kilincer et al.,2021).First,to alleviate the impact of the unbalanced distribution of network data classes,they innovatively introduced two auxiliary tasks,namely a memory-enhanced autoencoder(AE)and a distance-based prototype network,into a convolutional neural network (CNN) structure to capture discriminative and expressive communication patterns.In particular,CNN’s distancebased prototype network seeks to maximize interclass change and minimize intraclass change training data,while AE attempts to preserve the critical normal pattern of network traffic and distinguish attacks on normal network access.These three deep learning tasks can benefit each other through endto-end neural networks.Then,they used the feature fusion layer to fuse the representation and capture a final feature vector from the above tasks,with the objective being the classification of malicious traffic in smart cities.
3.3.2 Darknet traffic classification for smart cities
Lan et al.(2022a)proposed a new self-attentive deep learning approach for darknet traffic classification and application identification.Each part of the framework handles the payload content or payload statistics for network flows(Iliadis and Kaifas,2021).Specifically,self-attention-embedded 1D-CNN and Bi-LSTM networks were used to extract local temporal and spatial features from the payload content of data packets,and a multihead self-attention mechanism was proposed to process the payload content in parallel.The output of the multihead self-attention module and the local spatiotemporal features extracted by 1D-CNN and Bi-LSTM networks embedded in self-attention were simultaneously fed into another attention module,to automatically capture the global intrinsic dependence and hidden relation between local spatiotemporal features with different attention weights.In addition,to improve the classification accuracy,a side-channel feature learning module was leveraged to extract feature representations from the payload statistics.Finally,the abovementioned deep features were concatenated into a single vector and fed into a classification layer to obtain predictions.
4 Spatiotemporal smart city situational awareness via big mobile data
4.1 Spatiotemporal model of big mobile data
4.1.1 Spatiotemporal model for mobile trajectory data in smart cities
Urban trajectory data,such as mobile traces,taxi logs,and check-ins collected from Ratti et al.(2006),Andrienko G et al.(2013),and Yuan J et al.(2013),provide valuable insights into human mobility patterns in cities.The segmentation of trajectory data into stay and travel segments is crucial for various urban analytics tasks,including traffic planning,travel time estimation,and trade area analysis.While stay segments have been defined as trajectory portions within spatially constrained regions for a sufficient duration,the definition of travel segments remains unclear.The studies of Calabrese et al.(2010),Phithakkitnukoon et al.(2010),and Jiang S et al.(2013) were conducted under the assumption of dense trajectory data with short time intervals;however,the relevance of this assumption is negated in the case of sparse trajectory data often encountered in metropolitan-scale measurements due to practical constraints like power consumption and user privacy.
To address the challenge of inferring stay and travel segments from sparse trajectory data,Shi et al.(2023)presented a formal definition of stay and travel segments in the context of sparse trajectory data.By introducing a pair of spatial and temporal parameters,they established a continuous mobility model that links the sparse trajectory data with the concept of stay and travel segments.Next,they proposed the slice &doubly sliding (SDS) algorithm,a single trajectory inference algorithm designed specifically for the long-tailed sparsity pattern observed in our trajectory data.The SDS algorithm ensures 100%inference precision and a lower-bounded recall based on single trajectory information.
Considering that the above algorithm is applicable only to a single trajectory,Shi et al.(2023)adopted a deep learning approach to capture the regularity of human mobility at a population scale.As shown in Fig.4,their method employs a singleton transformer design and introduces specialized space–time embedding of location records and a mask apparatus at the network’s output side.These customizations enable the utilization of spatiotemporal information from multiple sparse trajectories.
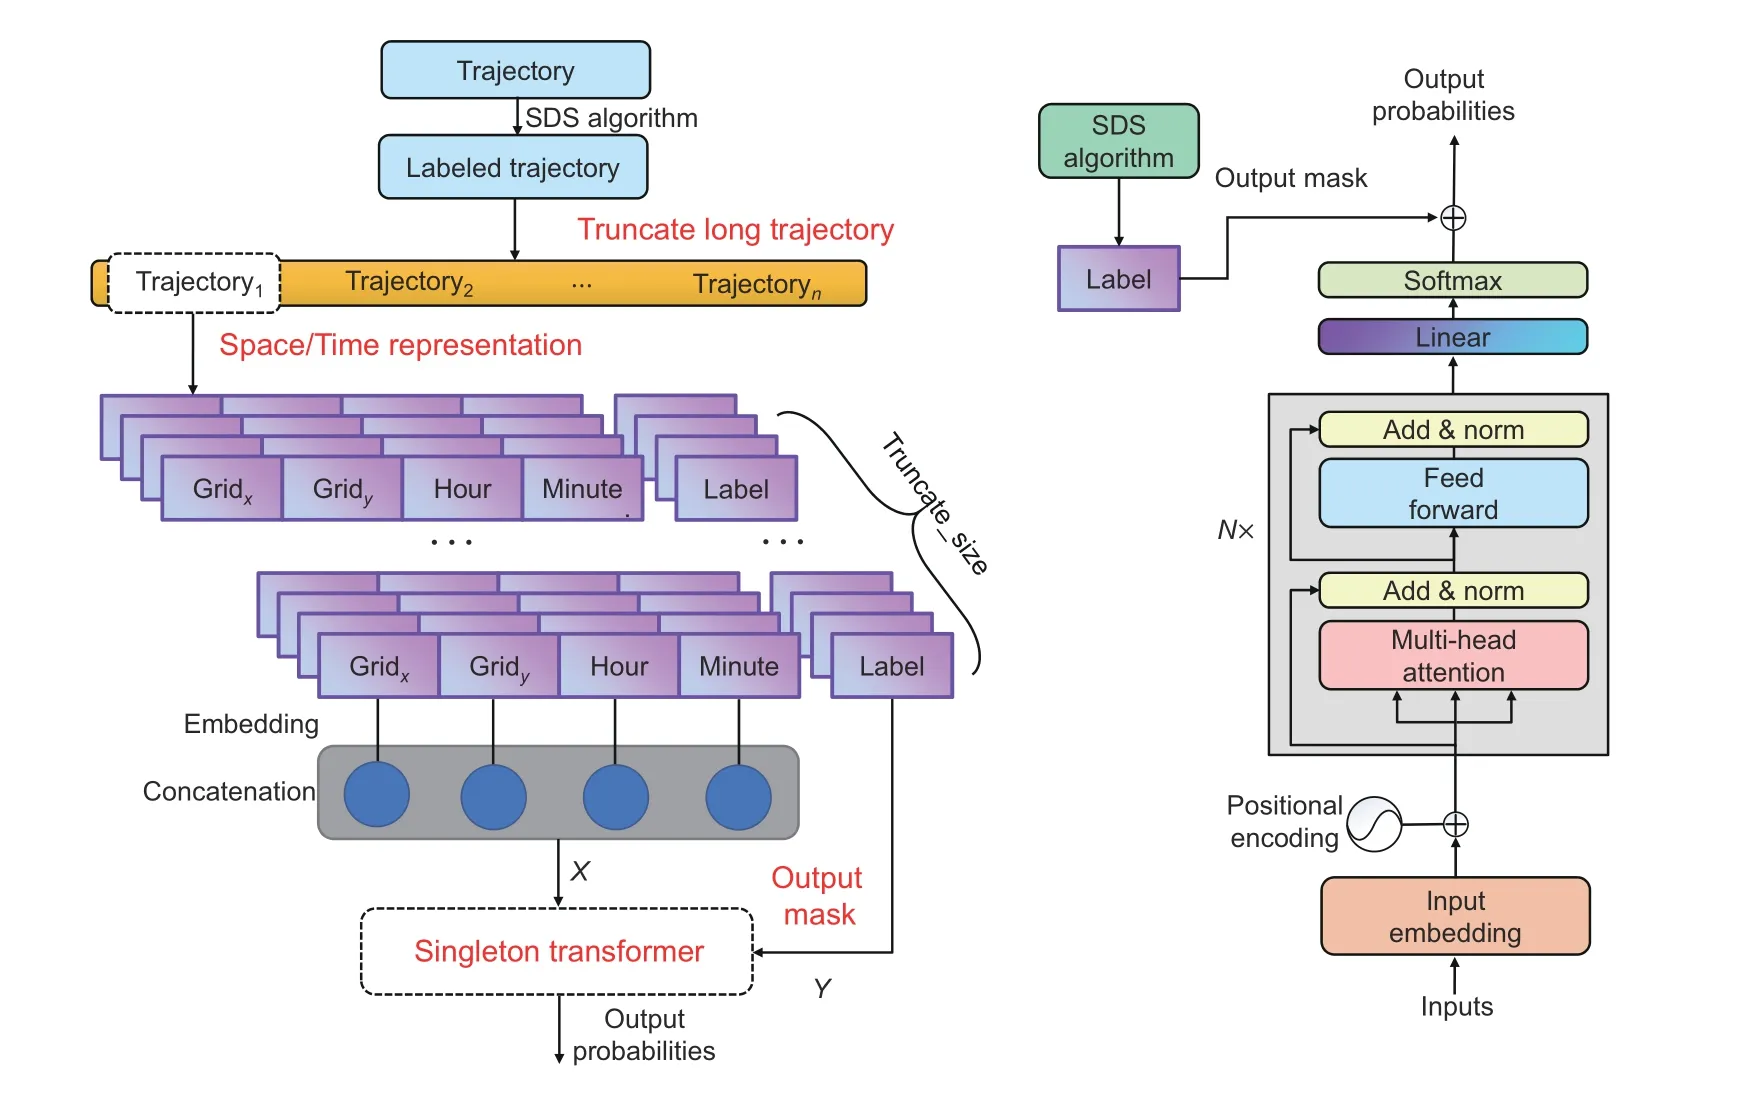
Fig.4 A deep learning architecture for multiple trajectory mobility inference.Reprinted from Shi et al.(2023),Copyright 2023,with permission from ACM
Shi et al.(2023) evaluated the SDS algorithm and the deep learning model using simulated trajectory data and sparse trajectory datasets from three major Chinese cities,involving 40 million residents.The experimental results validated the theoretical performance of the SDS algorithm and demonstrated the advantages of the deep learning model,including its ability to use spatiotemporal information,scalability to large training data,and generalizability to different urban data sources.These were applied and deployed in specific business scenarios on China’s largest independent third-party mobile data platform.
4.1.2 Semantic augmentation model for spatiotemporal big data in smart cities
The analysis of human trajectories in modern cities can help governments and corporations finish their daily jobs such as urban planning,public security,and business site configuration.In the literature,visualizations of human movement have been widely studied on the topic of trajectory visualization,including cluster-based(Schreck et al.,2008),origin–destination(Andrienko G et al.,2017),and density-based (Willems et al.,2009) aggregations.However,trajectory visualization methods generally illustrate short-term human displacements that have taken place in individual travel segments of the trajectory and cannot be directly applied to the long-term distribution of stay locations in human trajectories.More importantly,trajectory visualization methods are designed to reveal topological mobility patterns in the trajectory,but they do not consider the semantic relationship between human movement and the underlying socioeconomic and demographic factors.
After referring to the literature(González et al.,2008;Calabrese et al.,2010;Cottineau and Vanhoof,2019) and pointing out the remaining problems of the previous methods,Shi et al.(2021b)defined two information-theoretic measures for steadystate human mobility in cities,namely people entropy and segment entropy.This was done to illustrate the steady-state human mobility patterns from their long-term trajectory data.The definition of people entropy has three advantages.First,the form of Shannon entropy captures the uncertainty of a distribution,which corresponds well with the objective of measuring the user’s mobility.Second,the entropy-based mobility metric is a scalar that is computationally efficient to be aggregated over space and time.Third,as the entropy is defined over distributions,the resulting metric is insensitive to the sampling rate of the mobility data set with respect to all the user trajectories.The city with a larger number of trajectories can be effectively compared with other cities with fewer trajectories.
By applying point-of-interest (POI) based resource distribution and administrative division(DIV) based region distribution,Shi et al.(2021b)proposed four metrics useful for large-scale human mobility analysis.Vibrancy indicates the uncertainty of a user’s trajectory while accessing different types of urban resource.A high vibrancy suggests that the user is able to connect to many types of resources uniformly,while a low vibrancy suggests that he/she is able to connect to only a few types of resource.Commutation indicates the uncertainty of a user’s trajectory switching among different administrative divisions.A high commutation region can be interpreted as home or working places with more high commutation people.Diversity indicates the difference between a stay location’s resource distribution and the overall resource distribution of the trajectory.A high diversity region can be interpreted as having the type of resource that is rarely connected to its visitors.Fluidity indicates the difference between a stay location’s administrative division and the overall DIV distribution of the trajectory.A high fluidity region can be interpreted as the land mixing people from quite different home/working places.
4.2 Spatiotemporal visualization of big mobile data in smart cities
4.2.1 Spatiotemporal visualization for mobile trajectory data in smart cities
Mapping human movement in urban areas has gained significant attention in the fields of GIS and visualization (Andrienko N and Andrienko,2013).Advanced sensing technologies,such as GPS,roadside sensors,and participatory crowdsourcing applied by Miranda et al.(2017),enable the measurement of human movements in modern cities.Visualizations of large-scale movement data play a crucial role in various real-world applications,including traffic optimization,urban planning,and business site configuration.
However,human movement data in cities often suffer from sparsity in both space and time.Spatially,different measurement techniques and sensors capture the movement of specific groups of people or movement under particular circumstances.Temporally,due to communication cost constraints,individual trajectories are seldom measured in real time,resulting in sparse records with intervals of seconds or minutes.
Various aggregation methods have been proposed,such as origin-destination (OD) based (Zhou et al.,2019),route-based(Xu et al.,2020),and spatiotemporal(ST)(von Landesberger et al.,2016)aggregations.However,these methods either require trajectory information and characteristics not available in sparse data or fail to capture global movement patterns.
As shown in Fig.5,Shi et al.(2021a)proposed the UrbanMotion framework,which leverages the long-tailed sparsity of sparse trajectory datasets to extract and aggregate population movements from dense parts of trajectories,allowing for global and local movements to be visualized simultaneously.Trajectory data are collected from various mobile App domains in Beijing.A hybrid aggregation approach is then applied,using ordinary gridding on space and time,with movement directions as the focal point for clustering or map-matching based aggregations.This is followed by the implementation of a wind-map like visualization,which serves as a visual metaphor enabling the simultaneous display of population distribution and movement patterns.This visualization simultaneously encodes movement direction,volume,and speed.Additionally,Shi et al.(2021a)employed a flow tracing algorithm as a technique for discovering global population flows.To evaluate the effectiveness of UrbanMotion,comparative experiments and case studies were conducted.
4.2.2 Visual analysis of semantic information in spatiotemporal big data in smart cities
Based on the semantic enhancement model of smart city mobile big data(Miranda et al.,2017),Shi et al.(2021b) proposed a multi-dimensional mobility visualization method for urban users,namely the petal map.The design takes mobile trajectory big data as input and illustrates citizens’ semantically rich situation information,including their mobility,difference,communication status.
Shi et al.(2021b)proposed an integrated visualization interface that applies and adapts state-of-theart multivariate glyph designs and multiclass layer synthesization methods to support the visual analysis of multifaceted mobility panorama and its correlation with urban structure and POI distributions.The map-based visualization in the main panel of UrbanFACET has two default layers: the base layer and the metric layer.The base layer in the background gives the geospatial information about the city,serving as location references,while the metric layer is overlaid on top of the base layer and displays the key distributional information across the city.
In UrbanFACET,Shi et al.(2021b) proposed a kernel density estimation method over the gridbased aggregation technique,namely the grid KDE,which is shown to be better in the scenario than alternative visualization methods.Specifically,binning with grid KDE does not produce aliased visualization and reduces a large online computation overhead in comparison with the standard KDE(Lampe and Hauser,2011).In rendering the metric layer,a two-color palette was adopted to display the metric value.The highest and lowest values were mapped to red and yellow,respectively,and the intermediate value was interpolated in the color hue space.By contrast,the single-color palette (Tominski et al.,2008;Mittelstädt et al.,2015) can introduce ambiguity between the low metric value and the empty value (no record or filtered out).The standard rainbow palette with many base colors is also considered harmful due to the lack of perceptual color ordering (Borland and Ii,2007).The final choice of a two-color palette features a compromise wherein low values can be noticed while the color ordering issue is minimized.
In addition,to visualize multiple mobility metrics,Shi et al.(2021b) introduced a flower-shaped glyph design to illustrate the multiple metrics on each cluster.The glyph was composed of four colored petals and one ring surrounding the petals,which visualizes the four-tuple of mobility metrics plus density:
As shown in Fig.6,to meet the practical needs,Shi et al.(2021b) adopted UrbanFACET to analyze human mobility in the national capital region of China.The distribution of the foregoing entropybased mobility metrics was studied over Beijing.For instance,it can be inferred that the northern people live a more abundant life than the southern people in Beijing by analyzing the vibrancy distribution prevalent in the city.Furthermore,the paper provided several constructive suggestions for city governors,enterprise managers,and security officers after studying the case,and these can serve as valuable references to assist in decision-making.
4.3 Anomaly visualization of big mobile data in smart cities
Anomaly detection is a vital research area in the domain of a smart city;it can guide the users to accurately discover and diagnose failures and faults in smart cites’ big mobile data and beyond(e.g.,power consumption data by Xiao et al.(2022)).With the recent surge of data visualization technology,related methods have been widely used in anomaly detection.Using the correlation graph,Shi et al.(2011) detected the similarity among the sensor node runtimes for the outlier analysis.Yan J et al.(2020) detected collective anomaly of big mobile data using high-order correlation graphs.Their work has been referred to in subsequent studies of big mobile data in smart cities (Herr et al.,2020;Xiao et al.,2022).
4.3.1 Visual analysis of anomalies in big mobile sensing data
Aiming at the problem of abnormal situation awareness of big data from urban mobile sensors(Ni et al.,2009),a time-series expansion fusion method for sensor information collection network was proposed which fuses the time-varying topology of the sensor network into a unified information collection tree,considering the topology change and transmission performance perception of the sensor network and designing the growth of the annual ring.The method can support situation analysis and event detection of mobile sensing big data.
Previous products (Buschmann et al.,2005;Miao et al.,2011) lack the intelligent analytic capability to detect and analyze the abnormalities of wireless sensor nodes.Besides,while there are techniques dealing with time-series data visualizations (Bak et al.,2009),very few of them are designed specially for the diagnosis of performance issues in sensor networks and for the easy exploration of root causes for which there may be no prior established knowledge.To resolve these problems,Shi et al.(2011) presented the Sensor Anomaly Visualization Engine (SAVE),a system that fully leverages the power of both visualization and anomaly detection analytics to guide the user to quickly and accurately diagnose sensor network failures and faults.
Compared to the existing suite of algorithmic approaches,SAVE has the following advantages.First,the visualization of sensor network data from multiple perspectives helps the administrator collect evidence in a more comprehensive and consolidated manner.Second,the advanced visual interface provides a more intuitive display of data,which by its nature is more suitable for human diagnosis of largescale data intensive systems.Third,the visual analytics solution combines human knowledge with algorithmic results to work better at diagnosing salient sensor network failures.
Considering the need for a more intuitive graph for the visualization task,Shi et al.(2011)proposed the temporal expansion model (TEM) graph.TEM leverages the key feature of the sensor network studied in this work: all the sensor nodes send packets only to the central sink node for information fusion.The basic idea is to split one physical sensor node into multiple logical nodes according to the separate routing paths to the sink.The advantages of TEM are twofold.First,the graphs generated are directed trees,and accordingly much better for visualization and navigation.Second,temporal changes to the network are surfaced to the graph,providing input for further analytics.With the statistics shown in this paper,the TEM approach was proved to be feasible for most sensor topology scenarios as the resulting graph will not grow indefinitely and the overhead was shown to be limited.
Next,Shi et al.(2011) introduced a correlation graph to monitor temporal correlation patterns and detect anomalies between numerical sensor data dimensions.To know both the spatial and temporal anomalies of high-dimensional sensor nodes,the authors divided the dimensions of sensor data into two categories of properties: sensor readings and sensor counters.Apart from the correlation graphs,the paper also incorporates the dimension projection view to visualize the high-dimensional data values associated with the sensor nodes and their changes over time.
4.3.2 Visualization of anomaly correlations in a smart city’s big spatiotemporal data
Aiming at the problem of anomaly discovery in the mobile big data of a smart city,Yan J et al.(2020) proposed the technology of spatiotemporal relationship network data abstraction,visual analysis,and anomaly discovery based on a high-order correlation graph,which can detect low-level risk events in mobile data and associate massive events to form the high-order correlation graph according to time,space,object,and other dimensions,assisting in discovering high-level situation information such as group anomalies contained in mobile big data.
Yan J et al.(2020) first introduced the concept of collective anomaly defined by coordinated events on a group of interrelated objects whose cooccurrence is highly anomalous.The detection of collective anomalies is challenging,because their anomalous states are revealed by point anomalies,and are heavily dependent on the relationship among the events.The prevalent methods have different shortcomings.On one hand,most techniques on the collective anomaly detection are often limited to a single type of data and application(Hazel,2000;Noble and Cook,2003;Chan and Mahoney,2005).On the other hand,visualization methods do not generalize to solve the common problem of collective anomaly detection (Thom et al.,2012;Miao et al.,2013;Zhao J et al.,2014).
As shown in Fig.7,to detect the collective anomalies in different applications,Yan J et al.(2020) proposed the novel concept of the faceted high-order correlation graph (HOCG),in which anomalous events detected from the behavior of individual objects at multiple facets were modeled as nodes,while their high-order correlations were modeled as edges.HOCG has the advantages of interactivity,scalability,and generality.

Fig.7 HOCG visualization system to illustrate collective anomaly in smart cities: (a) double overview +detail timeline selectors;(b) visualization controller;(c) correlation graph view;(d) anomaly time series of individual nodes (objects);(e) visual interpretation of a selected point anomaly;(f) data value of the selected anomaly;(g) spatial detail view (Yan J et al.,2020)
The work of Yan J et al.(2020)can be summarized as follows: First,the authors formally defined HOCG in a domain and data type independent manner.A flexible framework was proposed to construct the HOCG by integrating point anomaly detection,multimodal correlation analysis,and anomaly propagation algorithms.Second,they designed a visual analytics system to display large HOCGs through visual abstraction,which provides several interaction models to validate the individual point anomalies,visually detected the collective anomalies,and conducted a root cause and dynamic analysis for the containment actions.Third,they demonstrated the effectiveness of the system in the visual reasoning of the collective anomalies through three case studies in the facility monitoring,intrusion detection,and software analysis domains.
Putting it briefly,Yan J et al.(2020)described a visual analytics framework based on the concept of the faceted HOCG to detect,analyze,and reason about collective anomalies.Besides,an interactive visualization interface has been designed in the work,which allows the flexible and scalable exploration of detected point anomalies,their multimodal relationships,and the potential root cause of the overall collective anomaly.
5 Conclusions and future work
This review summarizes the latest requirements on smart city situational awareness,from the aspects of government,industry,and citizens.A new type of urban data source,i.e.,big mobile data,is defined and discussed which,in the best capable form,significantly outperforms traditional urban surveillance data with static spatial and temporal granularity.Employing the new mobile data,two kinds of empowering technology for smart city situational awareness have been introduced,i.e.,cybersecurity insurance and spatiotemporal modeling/visualization.Both techniques have been evaluated to be advantageous over existing methods in the same domain.The significance of this review lies in the introduction of a comprehensive technological framework for smart city situational awareness,in the context of a number of modern megacities in China.
More work is required to further empower smart city situational awareness,however.First,though the proposed technologies are empirically proven to be effective,the experiment scale is generally small to medium.Large-scale deployment of smart city situational awareness systems will be essential for technological validation,and also for understanding the pros and cons when interacting with hundreds of smart city sub-systems.Second,with the emergence of 5G technology and the potential roll-out of 6G in the foreseeable future(Wang XB et al.,2023),the speed,capacity,and reliability of mobile data transmission are expected to undergo tremendous increase.Urban infrastructure can further be integrated with a variety of mobile devices,paving the way for real-time data analytics,instant response to emergent city situations,and innovative/immersive urban applications via augmented reality and virtual reality technologies.Third,the intersection of big mobile data with artificial intelligence holds significant promise.The confluence can give birth to predictive analytics in smart cities,where potential incidents can be forecast,allowing authorities to take preemptive measures.
Contributors
Zhiguang SHAN,Lei SHI,Bo LI,Yanqiang ZHANG,and Xiatian ZHANG drafted the paper.Wei CHEN helped organize the paper.Lei SHI,Bo LI,Yanqiang ZHANG,and Xiatian ZHANG revised and finalized the paper.
Compliance with ethics guidelines
Zhiguang SHAN,Lei SHI,Bo LI,Yanqiang ZHANG,Xiatian ZHANG,and Wei CHEN declare that they have no conflict of interest.
杂志排行

Frontiers of Information Technology & Electronic Engineering的其它文章
- Towards resilient average consensus in multi-agent systems:a detection and compensation approach∗&#
- Modified dynamic event-triggered scaled formation control for multi-agent systems via a sparrow search algorithm based co-design algorithm∗
- Event-triggered distributed optimization for model-free multi-agent systems∗#
- Event-triggered finite-time command-filtered tracking control for nonlinear time-delay cyber physical systems against cyber attacks∗
- Outlier-resistant distributed fusion filtering for nonlinear discrete-time singular systems under a dynamic event-triggered scheme∗
- Recursive filtering of multi-rate cyber-physical systems with unknown inputs under adaptive event-triggered mechanisms∗#