Voluntary wheel running ameliorated the deleterious effects of high-fat diet on glucose metabolism, gut microbiota and microbial-associated metabolites
2024-01-24LingZhngWenyuZouYongynHuHonghuWuYingGoJunqingZhngJiZheng
Ling Zhng, Wenyu Zou, Yongyn Hu, Honghu Wu, Ying Go, Junqing Zhng, Ji Zheng,
a Department of Endocrinology, Peking University First Hospital, Beijing 100034, China
b Laboratory Animal Facility, Peking University First Hospital, Beijing 100034, China
Keywords: High-fat diet Voluntary wheel running Gut microbiota Metabolomics Glucose metabolism
ABSTRACT Exercise training is critical for the early prevention and treatment of obesity and diabetes mellitus. However,the mechanism with gut microbiota and fecal metabolites underlying the effects of voluntary wheel running on high-fat diet induced abnormal glucose metabolism has not been fully elaborated. C57BL/6 male mice were randomly assigned to 4 groups according to diets (fed with normal chow diet or high-fat diet) and running paradigm (housed in static cage or with voluntary running wheel). An integrative 16S rDNA sequencing and metabolites prof iling was synchronously performed to characterize the effects of voluntary wheel running on gut microbiota and metabolites. It showed that voluntary wheel running prevented the detrimental effects of high-fat feeding on glucose metabolism. 16S rDNA sequencing showed remarkable changes in Rikenella and Marvinbryantia genera. Metabolic prof iling indicated multiple altered metabolites, which were enriched in secondary bile acid biosynthesis signaling. In conclusion, our study indicated that voluntary wheel running signif icantly improved glucose metabolism and counteracted the deleterious effects of high-fat feeding on body weight and glucose intolerance. We further found that voluntary wheel running could integratively program gut microbiota composition and fecal metabolites changes, and may regulate muricholic acid metabolism and secondary bile acid biosynthesis in high-fat fed mice.
1. Introduction
A sedentary lifestyle is the leading cause of the prevalence of obesity and diabetes mellitus worldwide[1]. Especially, the increasing of obesity and diabetes mellitus in children and adolescents has been a public health concern in almost all regions of the world[2]. Recently,the World Health Organization (WHO) has developed integrated management of obesity and promotes regular physical activity, with the increment of sedentary work[3]. As a doctor’s all natural, no-pill prescription for better health, regular physical exercise, has been well established in its whole-body benefits for people with obesity,diabetes mellitus and cardiovascular diseases[4]. Physical exercise is a complex physiological stimulus which can induce different adaptations to main organs involved in glucose metabolism, including liver, skeletal muscle, pancreas, adipose tissue, and central nervous system (hypothalamus)[4-6]. Besides, as critical factors linked with lifestyle and human health, gut microbiota have been demonstrated to play multiple and complex roles in obesity and weight management,including the regulation of appetite, nutrients absorption, the hormonal and immune systems, and bile acid metabolism[7].
Recent advances in research have shown that physical exercise,as a metabolic stimulus can alter gut microbiota structures and composition with benefits of obesity and glucose metabolism[8-9].Of note, in most experiments, forced treadmill exercise, rather than voluntary wheel running was chosen as the exercise intervention[10-13].Compared with forced treadmill exercise, voluntary wheel running performs under non-stressed conditions, which is similar to natural running behavior and has distinct advantages to be easily applied in long-term studies and clinical intervention[14]. In addition, most data of physical exercise and gut microbiota are conflicting, and it is very descriptive, without further investigations about the exact function of gut microbiota. The mechanisms underlying the effects of voluntary wheel running training on gut microbiota in high-fat fed mice are not yet well elaborated, and little is known about the crosstalk between the alteration of gut microbiota and fecal metabolome profiling.
In this study, we aimed to determine whether voluntary wheel running could attenuate the deleterious effects of high-fat feeding on body weight and glucose metabolism. Moreover, an integrative 16S rDNA based-microbial sequencing and mass spectrometry based-metabolic profiling was synchronously performed to characterize the effects of voluntary wheel running on gut microbiota composition and metabolites changes in high-fat fed mice. Based on the findings of comprehensive analysis between microbial sequencing and metabolites profiling, we further decipher the specific species and gut microbiota-derived metabolites by which the gut microbiota can mediate obesity and glucose homeostasis.
2. Materials and methods
2.1 Ethics statement
All the experiments were conducted at the Animal Research Center of the Peking University First Hospital, following the guidelines for the Care and Use of Laboratory Animals (NIH).The protocols were approved by the Ethics Committee for Animal Experimentation of the Faculty of Peking University First Hospital(No. J201944).
2.2 Animals and study design
C57BL/6J male mice were housed at room temperature (22 ± 2) °C on a 12-h light/dark cycle at the Animal Research Center of Peking University First Hospital. Mice were givenad libitumaccess to food and water. After adaptation, all mice were housed in singular cages and fed either a normal chow diet (NC, 13% kcal fat; Keao Xieli Feed Co., Ltd., Beijing, China) or a high-fat diet (HF, 60% kcal fat; Keao Xieli Feed Co., Ltd., Beijing, China), as our previous study[15]. Mice were then randomly divided into 4 subgroups according to either housed individually in static cages or in wheel cages. Mice housed in wheel cages represents voluntary wheel running (VWR). Thus,the mice were as following 4 groups according to diet and running paradigm: NC (fed with normal chow diet and housed in static cage),NC+VWR (fed with normal chow diet and housed with voluntary running wheel), HF (fed with high-fat diet and housed in static cage),and HF+VWR (fed with high-fat diet and housed with voluntary running wheel). The running wheels were 13 cm in diameter and 6 cm in width (Yuyan Instruments Company, Shanghai, China).The running distance was monitored every day and any mouse that ran 10% less than the average running distance was excluded from analyses. After 6 weeks, mice were anesthetized, and cecal contents were immediately removed and stored at −80 °C for further analysis.
2.3 Glucose tolerance test
Mice were fasted for 12-h (8:00 PM–8:00 AM) with free access to drinking water. Glucose (2.0 g/kg body weight) was intraperitoneally injected as previously described[15]. Blood samples were taken from the tail at baseline (0 min), 15, 30, 60, and 120 min post-injection.Glucose concentrations from blood were measures using a portable glucometer (Contour TS, Bayer, Beijing, China). Area under the curve (AUC) was calculated to evaluate blood glucoses response to glucose and insulin tolerance tests.
2.4 Gut microbiota sequencing and analyses
2.4.1 DNA extraction, PCR amplification and sequencing
To characterize the effects of voluntary wheel running on gut microbiota, 16S rRNA gene sequencing was performed as our previous study[15]. Microbial DNA of cecal contents was extracted using a QIAamp DNA Stool Mini Kit (Qiagen, Hilden, Germany).The V3–V4 regions of the 16S rRNA genes were amplified using the primers with 338F, 5’-ACTCCTACGGGAGGCAGCAG-3’and 806R, 5’-GGACTACHVGGGTWTCTAAT-3’. Amplicons were purified using the AxyPrep DNA Gel Extraction Kit (Axygen Biosciences, Union City, CA, USA) and quantified using Quantus™Fluorometer quantitative system (Promega, USA). Then, the purified amplicons were sequenced on an Illumina MiSeq PE300 platform(Illumina, San Diego, USA).
2.4.2 Bioinformatic analysis of gut microbiota sequencing
Sequencing data was further analyzed according to our previous study[15]. Raw data from the Illumina MiSeq platform were obtained,and Uparse software platform (http://drive5.com/uparse/) was utilized to identify the chimeric sequences. Operational taxonomic units(OTUs) were clustered by UPARSE with 97% similarity cutoff[16].Then, the Ribosomal Database Project (RDP) (https://sourceforge.net/projects/rdp-classi er/) was used to annotate taxonomic information[17].α-Diversity of gut microbiota community was calculated by Mothur(https://www.mothur.org/w iki/Download_mothur)[18].β-Diversity was calculated by Quantitative Insights Into Microbial Ecology(QIIME) software (http://qiime.org/install/index.html)[19]. The principal co-ordinates analysis (PCoA) plots were performed using unweighted UniFrac. Linear discriminant analysis (LDA) Effect Size(LEfSe) was performed using nonparametric Kruskal-Wallis rank sum test. Spearman correlation analysis was further performed between microbial taxonomy and metabolic parameters in mice.
2.5 Untargeted metabolomics sequencing and analyses
2.5.1 Liquid chromatography-mass spectrometry (LC-MS)
As you have hitherto always behaved well in my service I will not send you to prison; but leave your place instantly and never let me see your face again
To investigate the effects of voluntary wheel running on fecal metabolites, untargeted metabolomics sequencing and analysis were performed as previous study[20]. Briefly, fecal samples were analyzed using the LC-MS platform (Thermo, 210 Ultimate 3000LC,Q Exactive). Chromatographic separation was performed on a ultra-performance liquid chromatography (UPLC)-class system(Waters, Milford, USA). The mobile phases were 0.1% formic in water and acetonitrile/isopropanol (1:1,V/V) with 0.1% formic acid.Mass spectrometry detection was performed by triple TOF 5600+MS/MS system (AB Sciex, Concord, Ontario, Canada). The positiveion and negative-ion electrospray ionization modes were detected.The capillary and cone voltage were optimized at 2.5 kV, and 40 V,respectively. Centroid data were collected fromm/z50–1 500 in mass spectrometry elevated energy continuum mode. Quality control samples were prepared and the raw data were subjected to data preprocessing.
2.5.2 Bioinformatic analysis of metabolomics sequencing
The raw LC-MS data were pre-processed using Waters Progenesis QI 2.0 software (Nonlinear Dynamics, Newcastle, UK). All the metabolites were identified as Human Metabolome Database (HMDB,http://www.hmdb.ca/). To compare the different metabolite profiles,the metabolites were analyzed by orthogonal partial least squares discriminant analysis (OPLS-DA). The importance of each metabolite was ranked according to the variable important in projection (VIP)scores andPvalue. Fecal metabolites with VIP > 1.0 andP< 0.05 were identified as significant. The pathways involved in differential metabolites were enriched by functional annotation of metabolic pathways, which were conducted in Kyoto Encyclopedia of Genes and Genomes (KEGG) database (https://www.kegg.jp/kegg/pathway.html) by R packages and Python software package. Spearman correlation analysis was further performed between fecal metabolites and metabolic parameters in mice.
2.6 Procrustes analysis
The correlations between gut microbiota composition and fecal metabolites were performed by Procrustes analysis[21]. The selected gut microbiota composition and the differential metabolites were included and performed by Spearman correlation analysis. It was analyzed by the hierarchical clustering algorithm and average hierarchical clustering method. All the analysis was processed by the Majorbio Cloud Analysis Platform (Shanghai Majorbio Bio-pharm Technology, Shanghai, China).
2.7 Statistical analysis
The data were presented as the mean ± standard errors (SEM).The statistical significance of differences among groups was performed using two-way analyses of variance (ANOVA), followed by Turkey multiple comparisons test.Pvalue < 0.05 was considered as significantly different. All statistical analyses were performed using GraphPad Prism version 9.0 software.
3. Results
3.1 Running distance monitoring and the effects of voluntary wheel running on body weight
Male mice were fed a normal chow or high-fat diet, and housed in regular cages or cages with voluntary running wheels for 6 weeks. The total running distance was monitored every day (Fig. 1A). As shown in Fig. 1B, mice fed with normal chow and high-fat diet ran about(4.0 ± 0.7) and (4.1 ± 0.7) km/day, respectively (P> 0.05). There is no difference in the cumulative running distance between mice fed with normal chow and high-fat diets (P> 0.05, Fig. 1C). Body weight was measured per week until the end of each experiment. As shown in Fig. 1D, compare with NC group, mice fed with high-fat diet had higher body weight at the 5thweek (P< 0.01). There is a tendency of lower body weight in HF + VWR group, compare with HF group(P= 0.059). At the 6thweek, voluntary wheel running could significantly decrease body weight of high-fat fed mice (P< 0.05).The increment of body weight was significant higher in high-fat mice,which can be counteracted by voluntary wheel running (P< 0.001 andP< 0.01, Fig. 1E). Food intake was measured weekly and corrected for spillage. There was no significant difference in average energy intake among the 4 groups during the experiments (P> 0.05, Fig. 1F).
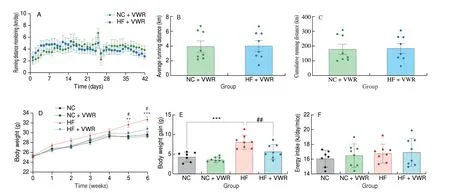
Fig. 1 Running distance monitoring and body weight of mice (n = 6–8). (A) Running distance monitoring; (B) Average running distance per day; (C) Cumulative running distance; (D) Body weight; (E) Energy intake. **P < 0.01, ***P < 0.001, HF vs. NC group; #P < 0.05, ##P < 0.01, HF + VWR vs. HF group.
3.2 Voluntary wheel running ameliorated the detrimental effects of high-fat feeding on glucose metabolism
To determine whether voluntary wheel running can ameliorate the detrimental effects of high-fat feeding on glucose metabolism, fasting blood glucose (FBG) and glucose tolerance test were detected to evaluate the effects of voluntary wheel running on glucose metabolism in mice.Due to the intervention of several previous studied was 3 weeks[6,22],we first detected FBG and performed glucose tolerance test at the 3rdweek of voluntary wheel running intervention. As shown in Fig. 2A,FBG levels were undifferentiated among the 4 groups (P> 0.05).For glucose tolerance test, blood glucose concentrations of the mice fed with high-fat diet and housed in static cage (HF group)were significantly higher at 60 min (P< 0.001), compared with NC group. However, no difference in blood glucose concentration was observed between HF + VWR and HF groups (allP> 0.05)(Fig. 2B). AUC level was higher in HF group compared with NC group (P< 0.01), with no significant difference in AUC level between HF + VWR and HF groups (P> 0.05) (Fig. 2C).
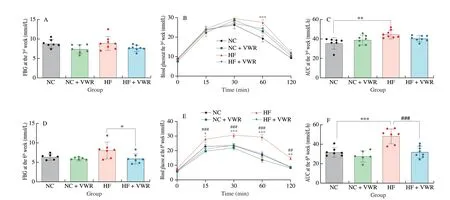
Fig. 2 Voluntary wheel running ameliorated the detrimental effects of high-fat diet on glucose metabolism (n = 6–8). (A) FBG at the 3rd week; (B) Glucose tolerance at the 3rd week; (C) AUC of glucose tolerance test at the 3rd week; (D) FBG at the 6th week; (E) Glucose tolerance at the 6th week; (F) AUC of glucose tolerance test at the 6th week. *P < 0.05, **P < 0.01, ***P < 0.001, HF vs. NC group; ##P < 0.01, ###P < 0.001, HF + VWR vs. HF group.
At the 6thweek of voluntary wheel running intervention, the beneficial effects of voluntary wheel running on glucose metabolism became prominent. Voluntary wheel running decreased the FBG concentration in mice fed with high-fat diet, compared with those of HF group (P< 0.05) (Fig. 2D). Moreover, mice fed with high-fat diet and housed in static cage resulted in marked glucose intolerance, with higher blood glucose at 15 (P< 0.05), 30 (P< 0.001), 60 (P< 0.001)and 120 min (P< 0.01) of glucose tolerance test, compared with NC group. Remarkably, the blood glucose concentrations of high-fat fed and exercised mice were significantly decreased at 15 (P< 0.001),30 (P< 0.001), 60 (P< 0.001) and 120 min (P< 0.01), compared with mice fed with high-fat diet and housed in static cage (Fig. 2E).Consistently, AUC level was higher in HF group compared with NC group (P< 0.001), with significant difference in AUC level between HF + VWR and HF groups (P< 0.001) (Fig. 2F). Thus, these findings demonstrated that high-fat diet feeding resulted in impaired glucose metabolism, whereas voluntary wheel running for 6 weeks can significantly improve glucose intolerance.
3.3 Voluntary wheel running changed gut microbiota structure and composition
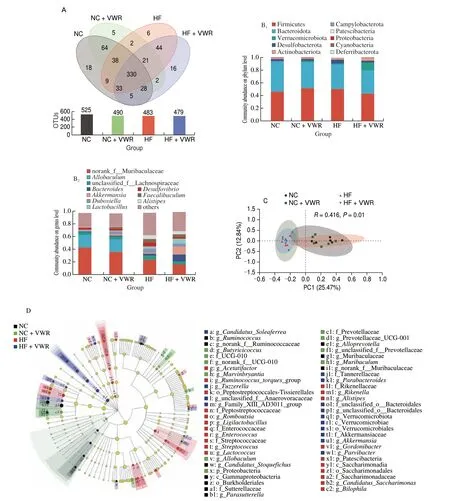
Fig. 3 Voluntary wheel running altered structures and composition of gut microbiota (n = 6–8). (A) Venn diagram of the OUTs. (B) Relative abundance of the bacterial population at the phylum (B1) and genus (B2) levels. (C) PCoA plot of gut communities of 4 groups. (D) Taxonomic representation of statistically and biologically consistent differences among 4 groups. Differences are represented by the color of the most abundant class (black, NC group; green, NC + VWR group; red, HF group, blue, HF + VWR group). The diameter of each circle is proportional to the taxon’s abundance.
To further examine alteration in microbiota composition, we analyzed the differential species using the Wilcoxon rank sum test.At the genus level, the abundance of 19 genera were significantly different between HF and NC groups. It is noteworthy that two genera of the 19 species showed different abundance between HF + VWR and HF groups, includingRikenellaandMarvinbryantia.Rikenellabelongs to Bacteroidetes phylum, withMarvinbryantiabelonging to Firmicutes phylum. Specifically, the abundance ofRikenellawere increased in HF group compared with NC group, and it was conteracted by voluntary wheel running of mice fed with high-fat diet. Conversely, the abundance ofMarvinbryantiawere decreased in HF group compared with NC group, and it was partially recovered by voluntary wheel running (Table 1).
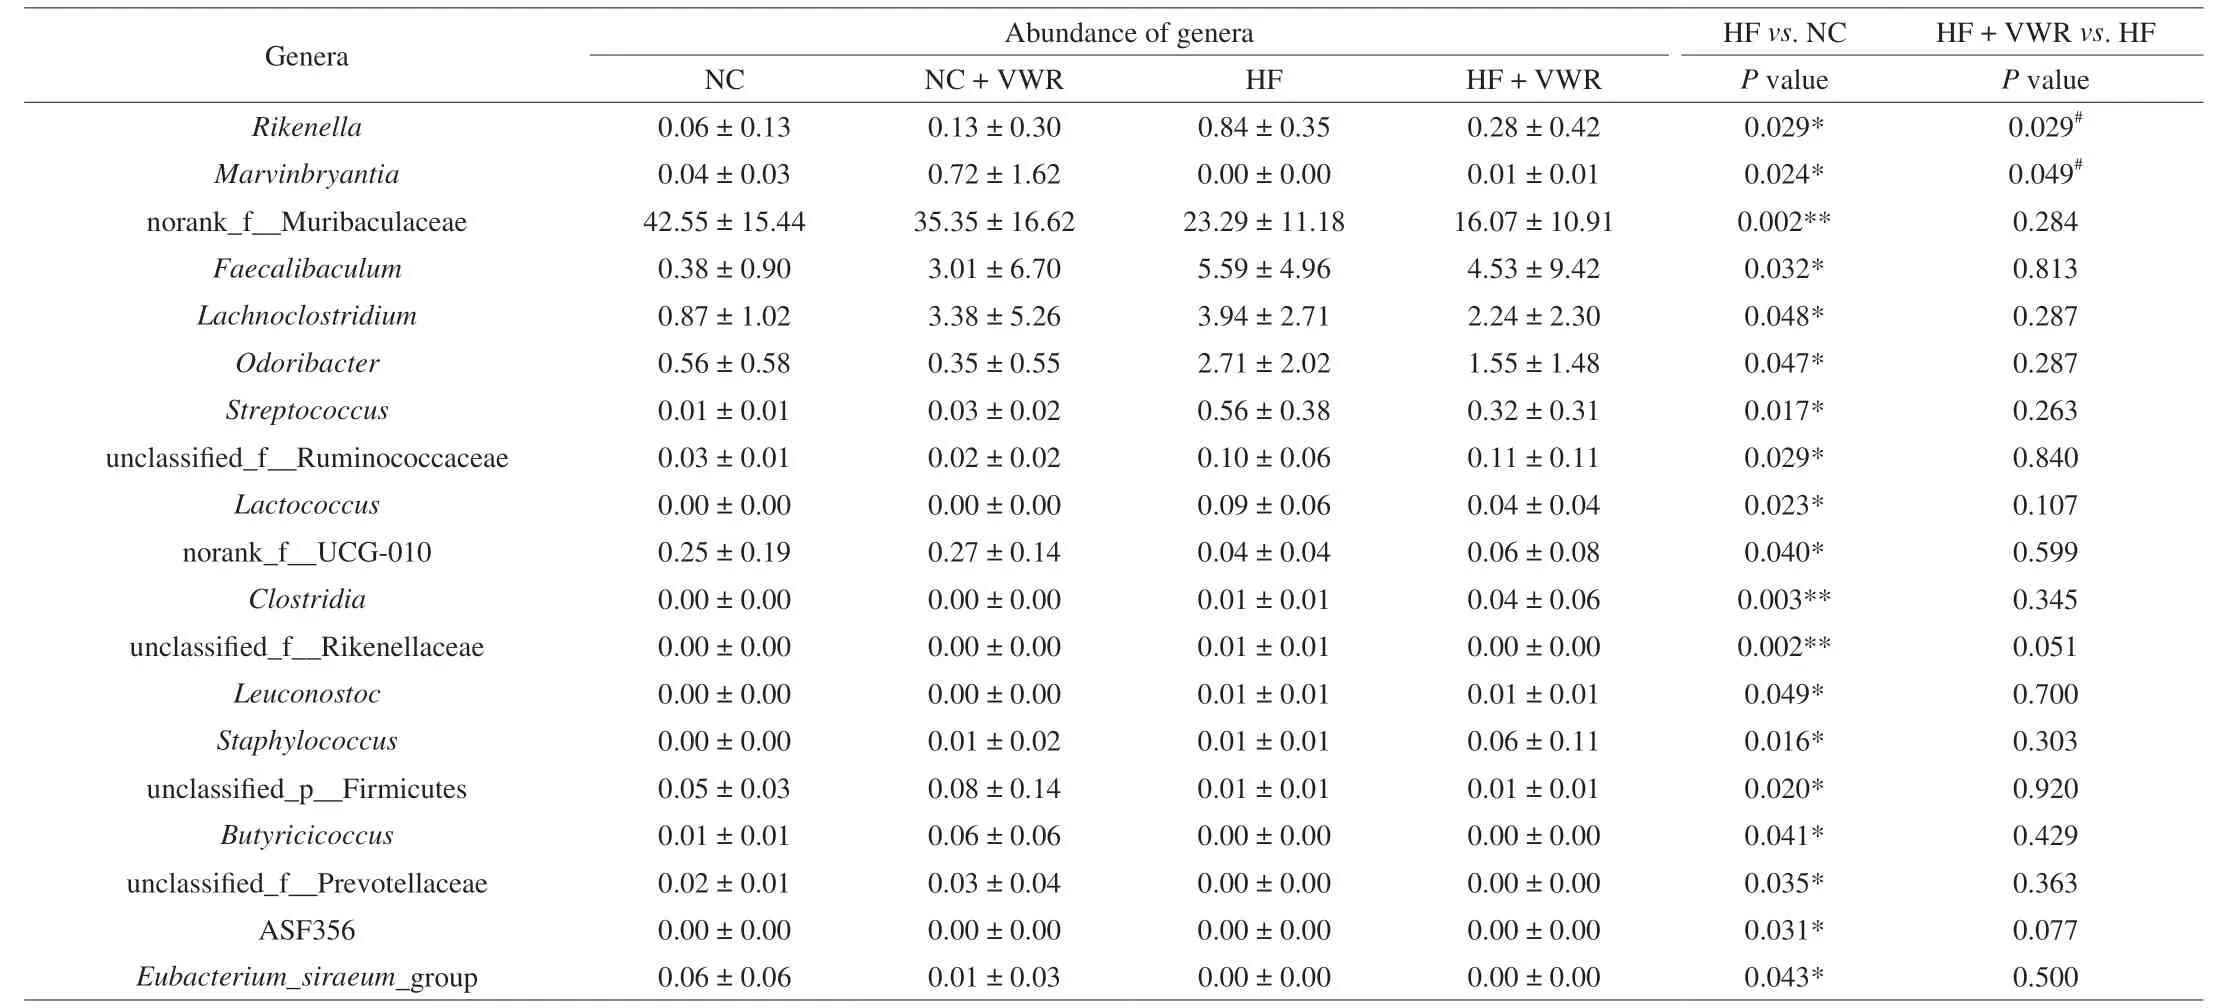
Table 1 Differential species at the genus level among 4 groups (n = 6).
3.4 Correlation analyses between gut microbiota and metabolic parameters
Further, spearman correlation analysis was performed to examined the correlation between the abundance of differential genera (RikenellaandMarvinbryantia) among the groups and metabolic parameters in mice. The metabolic parameters included body weight at the 6thweek,blood glucose concentrations and AUC level of glucose tolerance test. Interestingly, we found that the abundance ofRikenellawere positively correlated with body weight, 30-, 60-, 120-min blood glucose concentrations and AUC level of glucose tolerance test. The abundance ofMarvinbryantiawas negatively correlated with body weight, 0-, 30-, 60-, 120-min blood glucose concentrations and AUC level of glucose tolerance test (Table 2).

Table 2 The correlation between the gut microflora and metabolic parameters (n = 6).
3.5 The effects of voluntary wheel running on fecal metabolites alterations
To further investigate the effects of voluntary wheel running on microbial-derived metabolites and the function of bacteria alteration, fecal metabolites was detected in mice. As shown in Fig. 4A, shared and unique metabolites were analyzed among the 4 groups. It indicated 2 129 shared metabolites among the 4 groups. OPLS-DA model was constructed and the OPLS-DA score plot exhibited distinct discrimination between HF and NC groups(cum) = 0.491,(cum) = 0.987,Q2(cum) = 0.886) (Fig. 4B1),and between HF + VWR and HF groups (R2X(cum) = 0.361,(cum) = 0.929, Q2(cum) = 0.037) (Fig. 4B2). It indicates that OPLS-DA model was really reliable and predictive. Hierarchical clustering was utilized to identify the differential metabolites of VIP scores > 1 andP< 0.05. Finally, 758 differentially abundant metabolites were identified between HF and NC groups, with 362 metabolites up-regulated and 396 metabolites down-regulated in HF group compared with NC group (Fig. 4C1). In addition,84 differentially abundant metabolites were identified between HF + VWR and HF groups, with 36 metabolites up-regulated and 48 metabolites down-regulated in HF+VWR group compared with HF group (Fig. 4C2). Notably, of them, a total of 31 differentially abundant metabolites were co-changed between HFvs. NC groups and HF + VWRvs. HF groups (Figs. 4D, 5A1–2). Furthermore,of the 31 metabolites, 10 metabolites were significantly downregulated in HF group compared with NC group, and it was recovered by voluntary wheel running, including muricholic acid (MCA), 3’-hydroxyamobarbital, annuolide C, aspartame,chenodeoxycholylthreonine,γ-glutamylvaline, leucyl-glutamate,N-α-acetyl-L-arginine,N-eicosapentaenoyl tyrosine, and Thr-Tyr (Fig. 5B1). Conversely, 17 metabolites were significantly upregulated in HF group compared with NC group, and it was partially reversed by voluntary wheel running, including tauro-α-muricholic acid (TαMCA), 3-methyl-5-pentyl-2-furantridecanoic acid,4-(1-hydroxy-2-methoxyethyl)-5-(hydroxymethyl)-2-methylpyridin-3-ol, Ac-Pro-Gly-Pro-OH, DG(a-17:0/PGD2/0:0),γ-tocotrienol,Ile-Asp-Thr, indanone, Leu-Leu-Ile,N-stearoyl tryptophan,17-O-deacetylvindoline, 1-tert-butyl 4-ethyl 3-oxopiperidine-1,4-dicarboxylate, 4-aminophthalonitrile, apo-10’-violaxanthal, capsidiol,sinapyl alcohol, and tricin (Fig. 5B2). Thus, these data suggest that voluntary wheel running could significantly ameliorate high-fat feeding induced metabolites changes.
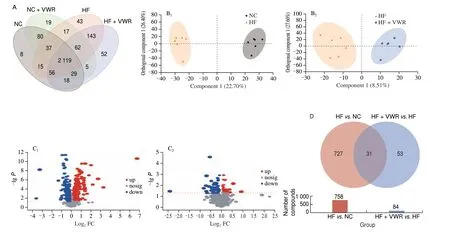
Fig. 4 Fecal metabolites profiling in mice (n = 6). (A) Venn diagram of the metabolites. (B) OPLS-DA plots showing spatial division between groups.(C) The volcano plot graph of altered metabolites between HF and NC groups (C1), and between HF + VWR and HF groups (C2). (D) Co-changed 31 differentially abundant metabolites.
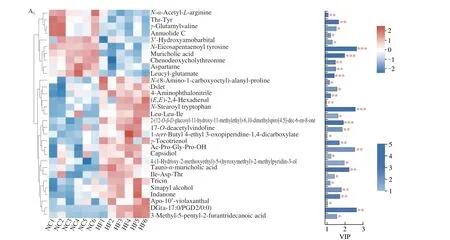
Fig. 5 Fecal metabolites were changed by high-fat feeding and voluntary wheel running (n = 6). (A) Hierarchical clustering and heatmap in the left panel showing the total 31 metabolites that were significantly differentially abundant between HF and NC groups (A1), and between HF + VWR and HF groups (A2).Each row represents data for a specific metabolite, and each column represents one mouse. Different colors correspond to different metabolite abundance levels.Red and blue colors represent increased and decreased levels of metabolites, respectively. The histogram in the right panel represents variable VIP scores derived from the OPLS-DA model for each metabolite. (B) Different metabolites among 4 groups. *P < 0.05, **P < 0.01, ***P < 0.001, HF vs. NC group; #P < 0.05,##P < 0.01, ###P < 0.001, HF + VWR vs. HF group.
3.6 Correlation analyses between differential metabolites and metabolic parameters
Further, we examined the correlations between the 31 differentially abundant metabolites and metabolic parameters by the Spearman correlation analysis. The included metabolic parameters were as aforementioned. It showed that most of the metabolites were correlated with metabolic parameters in mice. Notably, 10 metabolites that were decreased in HF group and recovered by voluntary wheel running were negatively associated with body weight, blood glucose and AUC levels of glucose tolerance test, including MCA,N-α-Acetyl-L-arginine,N-eicosapentaenoyl tyrosine, aspartame,3’-hydroxyamobarbital, Thr-Tyr, annuolide C,γ-glutamylvaline,chenodeoxycholylthreonine, and leucyl-glutamate. Meanwhile,15 metabolites that were up-regulated in HF group and partially reversed by voluntary wheel running were positively associated with body weight, blood glucose and AUC levels of glucose tolerance test, including TαMCA,N-stearoyl tryptophan, DG(a-17:0/PGD2/0:0), Leu-Leu-Ile, capsidiol, 1-tert-butyl 4-ethyl 3-oxopiperidine-1,4-dicarboxylate, 4-aminophthalonitrile, 17-O-deacetylvindoline,γ-tocotrienol, indanone, sinapyl alcohol, Ac-Pro-Gly-Pro-OH, 3-methyl-5-pentyl-2-furantridecanoic acid, 4-(1-hydroxy-2-methoxyethyl)-5-(hydroxymethyl)-2-methylpyridin-3-ol, and tricin (Fig. 6).

Fig. 6 Heatmap of correlation analysis between the differential metabolites and metabolic parameters (n = 6). The metabolites were on the right, and the metabolic parameters were at the bottom. Each grid represented the correlation between the two attributes, with the red-positive correlation and the blue-negative correlation. BW_6W, body weight of the 6th-week of running; GTT_BG0, 15, 30, 60, and 120 represent blood glucose levels at 0-, 15-, 30-, 60-, 120-min of glucose tolerance test (GTT); GTT_AUC, AUC of GTT. *P < 0.05, **P < 0.01, ***P < 0.001.
3.7 Functional predictions of differential fecal metabolites by KEGG pathway database
To predict the metabolic function of the changed metabolites,KEGG pathway enrichment analysis of all the different metabolites between HF + VWR and HF groups were first performed.Interestingly, five pathways were significantly enriched, including secondary bile acid biosynthesis pathway,β-adrenergic receptor agonists/antagonists pathway, indole alkaloid biosynthesis pathway,axon regeneration pathway, and tryptophan metabolism pathway(Fig. 7A). Then, the co-changed 31 fecal metabolites were further analyzed, and two important pathways were enriched, including secondary bile acid biosynthesis, and taste transduction. Of the 31 fecal metabolites, we further found MCA were significantly enriched in secondary bile acid biosynthesis pathway (Fig. 7B). It indicates that MCA may play an important role in secondary bile acid biosynthesis,then regulate the beneficial effects of voluntary wheel running on glucose metabolism.
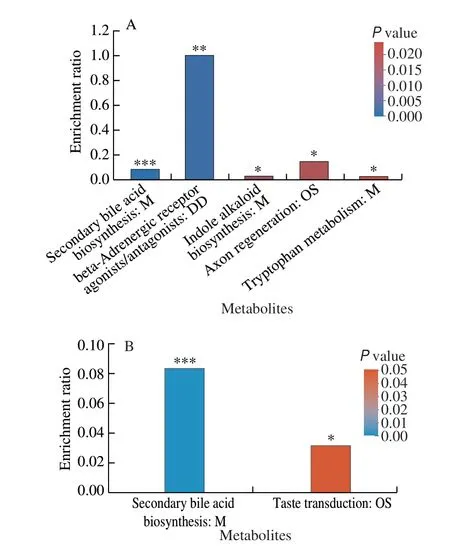
Fig. 7 Functional predictions of different metabolites by KEGG pathway database (n = 6.) (A) KEGG pathway enrichment analysis of all the different metabolites between HF + VWR and HF groups. (B) KEGG pathway enrichment analysis of the co-changed 31 differentially abundant metabolites.M, Metabolism; DD, Drug development; OS, Organismal systems. *P < 0.05,**P < 0.01, ***P < 0.001.
3.8 Correlation between gut microflora and fecal metabolites
The Procrustes analysis was performed to investigate the correlations between gut microflora and fecal metabolites, indicating significant consistency between the gut microflora and fecal metabolites (M2= 0.646,P< 0.001) (Fig. 8A). It showed that the abundance ofRikenellaandMarvinbryantiagenera were significantly correlated with the differential 31 gut metabolites.Rikenellagenus was negatively associated with a total of 9 metabolites,including MCA, 3’-hydroxyamobarbital, annuolide C, aspartame,chenodeoxycholylthreonine,γ-glutamylvaline,N-α-acetyl-L-arginine,N-eicosapentaenoyl tyrosine, and Thr-Tyr. Whereas,Rikenellagenus was positively associated with 5 metabolites, including 4-aminophthalonitrile, DG(a-17:0/PGD2/0:0),γ-tocotrienol, Leu-Leu-Ile, andN-stearoyl tryptophan. ForMarvinbryantiagenus, it was only positively correlated with leucyl-glutamate (Fig. 8B).
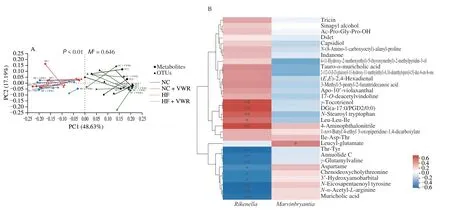
Fig. 8 Correlation between intestinal microflora and fecal metabolites (n = 6). (A) Procrustes analysis of intestinal microflora and metabolites (black, NC group;green, NC + VWR group; red, HF group, blue, HF + VWR group). M is the goodness-of-t statistic of the two ordering results in Procrustes analysis, which is used to evaluate the correlation between the two sorting results. The P value is the result of Monte Carlo permutation test, which is used to test the significance of M2. (B) Heatmap of correlation analysis between gut microbiota and metabolites. Correlation matrix between Rikenella/Marvinbryantia genera and the 31 differential metabolites. The metabolites were on the right, and the bacteria were at the bottom. Each grid represented the correlation between the two attributes,with the red-positive correlation and the blue-negative correlation. *P < 0.05, **P < 0.01.
4. Discussion
Obesity and diabetes mellitus are complex metabolic diseases arising from both environmental and genetic factors, which is increasing dramatically worldwide[23]. It has long been recognized that exercise has important health benefits for obese and diabetic patients, and regular physical exercise can distinctly postpone or prevent the incidence of obesity and diabetes mellitus[24-26]. There may be multiple adaptations to several tissues that mediate the beneficial effects of physical exercise on glucose metabolism, including liver,skeletal muscle, pancreas, and adipose tissue[5]. Considering the distinct effects of physical exercise on glucose metabolism and the increasingly pivotal role of gut microbiota in body weight and glucose homeostasis, we hypothesized that gut microbiota and its-derived fecal metabolites could be regulated by voluntary wheel running.Thus, an integrative 16S rDNA sequencing and gut metabolites profiling was originally performed to explore the mechanisms by which voluntary wheel running ameliorates the detrimental effects of high-fat diet on glucose metabolism.
Consistent with previous studies, we found that voluntary wheel running altered gut microbiota composition, and programed fecal metabolites changes in high-fat fed mice. However, in most studies,forced treadmill exercise, rather than voluntary wheel running was chosen as the exercise intervention[10-13]. In our study, voluntary wheel running was utilized as the exercise intervention, which is an interesting model to study the chronic adaptation to exercise in mice. Compared to forced treadmill exercise, voluntary wheel running presents several advantages, including that running pattern of voluntary wheel running is similar to natural running behavior of mice and it is performed under non-stressed conditions, which is more conforms with physiology and rhythmicity of mice. In addition,voluntary wheel running is more maneuverable which can be easily applied in long-term studies[14]. However, it is really difficult to quantitate the running activity of the mice in the static cage. Voluntary wheel running is a very mature intervention model for exercise and the running wheels have been merchandised. We think mice housed in wheel cages are much more active than the mice housed in static cage. Thus, deciphering the effects of voluntary wheel running on gut microbiota and microbial-derived fecal metabolites has potential clinical significance and it is more feasible for clinical translation.
It indicated that the structure and composition of gut microbiota were significantly changed in high-fat diet fed mice, which can be partially modified by voluntary wheel running. Of note, we found thatRikenellaandMarvinbryantiawere the most significant genera that were changed by high-fat diet and then recovered by voluntary wheel running. ForRikenellagenus, the abundance was increased by high-fat diet feeding and it was ameliorated by voluntary wheel running. Consistently, Geurts et al.[27]showed thatRikenellagenus was identified exclusively indb/dbmice compared to lean mice. It indicated that high abundance ofRikenellawas found in obesity and diabetes[27-28], and an increased abundance of theRikenellagenus was associated to low-grade inflammatory conditions[29]. Further,Fransen et al.[30]demonstrated that a higher abundance ofRikenellacould induce transmissible colitis. ForMarvinbryantia, the abundance was decreased in high-fat diet fed mice, which was partially recovered by voluntary wheel running, indicating it is beneficial for regulating glucose metabolism. Consistently, in a cross-sectional study of more than 2000 participants in two large population-based studies, it found that a higher abundance of 12 taxa, includingMarvinbryantiamight benefit risk of insulin resistance and type 2 diabetes mellitus. The abundance ofMarvinbryantiawas also negatively associated with homeostatic model assessment of insulin resistance (HOMA-IR)[31].Further, one recent study indicated thatMarvinbryantia, which can produce short chain fatty acid (SCFA), were enriched in the feces of normal elders[32]. Gao et al.[33]also found thatMarvinbryantia, as one fiber-degrading bacteria, its abundance was increased in alfalfa consumption pig, with improved concentrations of acetate, propionate,butyrate, and total SCFA in colonic content. Collectively, it supports thatRikenellaandMarvinbryantiagenera may play an important role in the regulation of glucose metabolism by voluntary wheel running.
Furthermore, characterization of fecal metabolome changes contributes to understanding the metabolic regulation of gut microbiota perturbations. The fecal metabolites were significantly regulated by voluntary wheel running. A total of 31 differentially abundant metabolites were co-changed in both high-fat feeding and voluntary wheel running intervention. Remarkably, MCA were significant down-regulated in high-fat fed mice, and it was recovered by voluntary wheel running. Meanwhile, TαMCA showed the opposite tendency, which was consistent with previous studies.Plasma TαMCA level was significantly increased in high-fat fed mice, and blueberry extract administration substantially decreased the augmented plasma TαMCA level[34]. Further, we found that MCA was a critical molecular that can regulate secondary bile acid biosynthesis pathway, which was the most significantly enriched pathway by the 31 differential metabolites. It suggested that MCA, as one kind of bile acid could activate farnesoid X receptor (FXR)[35], whose role has been well-established in regulating glucose metabolism and the secretion of glucoregulatory hormones[36-38]. Sayin et al.[39]elaborated that gut microbiota could regulate secondary bile acid metabolism and inhibited bile acid synthesis in the liver by alleviating FXR inhibition in the ileum. In one recent study, Barone et al.[40]found that obese women with uncontrolled eating behavior were characterized by low-diversity microbial states, with low transcriptional activity of genes involved in secondary bile acid biosynthesis. In addition,TαMCA was inversely correlated with insulin clearance and insulin resistance in obese patients[41]. Thus, it indicated that MCA and secondary bile acid biosynthesis may be the potential metabolite and pathway that regulate the beneficial effects of voluntary wheel running on glucose metabolism.
In addition, considering the integrative analysis of 16S rDNA sequencing and metabolites profiling, it demonstrated that voluntary wheel running could both modify the abundance ofRikenellaandMarvinbryantia, and MCA. Consistent with our findings, one recent study investigated the interaction between intestinal microbiome and plasma metabolomics indb/dbmice. It showed thatRikenellawere up-regulated in the colon ofdb/dbmice compared with non-diabetic controls, with decreased abundance of TαMCA[42]. Li et al.[43]found that the decrease ofRikenellawas particularly noticeable in azithromycin-treated mice, with decrease concentrations of secondary bile acids in colon. The underlying correlation betweenRikenellaand MCA indicates the crosstalk between gut microbiota and microbialderived metabolites.
In conclusion, our study indicated that the detrimental effects of a high-fat diet on glucose metabolism could be negated by voluntary wheel running. We further found remarkable changes inRikenellaandMarvinbryantia,and fecal metabolites were significantly regulated by voluntary wheel running. To the best of our knowledge,our study was novel in demonstrating that voluntary wheel running could integratively programed gut microbiota composition and fecal metabolites changes, and then regulated MCA and TαMCA metabolism and secondary bile acid biosynthesis. These findings can advance our thinking about the critical role of altered gut microbiota and metabolites underlying the benefits of voluntary wheel running on counteracting the deleterious effects of high-fat feeding on body weight and glucose metabolism.
Declaration of interest
The authors declare that the research was conducted in the absence of any commercial or financial relationships that could be construed as a potential conflict of interest.
Acknowledgements
This study was sponsored by National Natural Science Foundation of China (81800703 and 81970701), Beijing Nova Program (Z201100006820117 and 20220484181), Beijing Municipal Natural Science Foundation (7184252 and 7214258), the Fundamental Research Funds for the Central Universities, Peking University Clinical Scientist Training Program (BMU2023PYJH022),China Endocrine and Metabolism Young Scientific Talent Research Project (2022-N-02-01), Peking University Medicine Seed Fund for Interdisciplinary Research, the Fundamental Research Funds for the Central Universities (BMU2021MX013), China Diabetes Young Scientific Talent Research Project and Bethune-Merck Diabetes Research Fund of Bethune Charitable Foundation (G2018030). The funders had no role in study design, data collection and analysis, or preparation of the manuscript.
杂志排行
食品科学与人类健康(英文)的其它文章
- GUIDE FOR AUTHORS
- Call for Papers from Food Science of Animal Products
- Ascophyllum nodosum and Fucus vesiculosus ameliorate restenosis via improving inf lammation and regulating the PTEN/PI3K/AKT signaling pathway
- Alleviatory effect of isoquercetin on benign prostatic hyperplasia via IGF-1/PI3K/Akt/mTOR pathway
- Adsorption, in vitro digestion and human gut microbiota regulation characteristics of three Poria cocos polysaccharides
- Effect of simulated gastrointestinal digestion on antioxidant, and anti-inflammatory activities of bioactive peptides generated in sausages fermented with Staphylococcus simulans QB7
