Low soil C:N ratio results in accumulation and leaching of nitrite and nitrate in agricultural soils under heavy rainfall
2023-12-21XiaosongYANGZhengyiHUZijianXIESongyanLIXiaoleiSUNXianlinKEandMingmingTAO
Xiaosong YANG,Zhengyi HU,,,Zijian XIE,3,Songyan LI,Xiaolei SUN,4,Xianlin KE and Mingming TAO
1Resource and Environmental College,Universityof Chinese Academyof Sciences,Beijing 100049(China)
2Sino-Danish College,Universityof Chinese Academyof Sciences,Beijing 100049(China)
3National Engineering Laboratoryfor Lake Pollution Control and Ecological Restoration,Chinese Research Academyof Environmental Sciences,Beijing 100012(China)
4Institute of Bio-and Geosciences,Agrosphere(IBG-3),Forschungszentrum Jülich,Jülich 52425(Germany)
KeyWords: ammonia-oxidizing bacteria,ammonifying bacteria,functional gene,microbial community,nitrite-oxidizing bacteria
INTRODUCTION
Soil nitrate(NO-3)leaching in farmland has been identified as a predominant contributor to nitrogen(N)contamination of groundwater (Zhuet al., 2005), and on this account NO-3is the most researched inorganic N contaminant around the world(Tsagris and Tzouvelekas,2022).In contrast,little attention has been paid to soil nitrite(NO-2)leaching due to its common presence at low concentrations relative to NO-3(Rileyet al.,2001).However,soil NO-2leaching from farmland is drawing increasing attention due to its significant toxicity to plants,animals,and humans,compared with that of NO-3(Mukherjeeet al.,2014;Castaldelliet al.,2019;Mastrociccoet al.,2019;Sintimet al.,2021).
Both NO-3and NO-2are hardly adsorbed to soil colloids and move easily with water flow.Previous studies have shown that water input is an important factor affecting NO-3and NO-2leaching in farmland.For instance, in a 7-year field study,Fraseret al.(2013)observed that when the annual rainfall ranged from 466 to 853 mm, the total amount of NO-3leaching loss increased with increasing rainfall in the presence of crops and the mean annual NO-3-N concentration in leachate was above the limit (11.3 mg N L-1) recommended by World Health Organization for drinking water.Zarabi and Jalali(2012)observed that when soil received 534—1 286 mm of rainfall,the total amount of NO-2lossvialeaching ranged from 0.1 to 10.6 kg N ha-1and the maximum concentration of NO-2-N reached 59.8 mg N L-1,which was far above the Drinking Water Directive(US Environmental Protection Agency)recommended limit(3 mg NO-2-N L-1).These studies imply that the NO-3and NO-2leaching triggered by rainfall should not be negligible,especially under heavy rainfall events.Additionally, the frequency of heavy rainfall showed an increasing trend around the world due to global warming(Guet al.,2017).Hence,it is vital for efficient groundwater management to understand the mechanism of NO-3and NO-2leaching from agricultural soils under heavy rainfall.
Other important factors influencing leaching include soil NO-3and NO-2levels.Specifically,the higher the amounts of NO-3and NO-2in soil profile are,the higher the risk of leaching is.Further,the ratio of soil organic carbon(SOC)to total N (TN),i.e., soil C:N ratio, is reportedly associated with the processes of mineralization,nitrification,and denitrification in agricultural land, consequently influencing NO-3and NO-2accumulation(Bengtssonet al.,2003;Martinet al., 2009; Zhanget al., 2013; Zhang Yet al.,2019;Baiet al.,2021),which provides a basis for building up the links between soil C:N and N leaching under heavy rainfall conditions.A high soil C:N ratio goes againsaccumulation due to the less N substrate for nitrification and the enhancement of denitrification,both of which prevent the build-up of NO-3.Conversely,a low soil C:N ratio benefits nitrification and subsequently triggers soil NO-3accumulation.For NO-2, it rarely accumulates in natural ecosystems(Robertson and Groffman,2007).Nevertheless,some studies have reported that NO-2accumulation can occur under specific soil environmental conditions,such as high pH,water saturation,and low C:N ratio(Hamilton and Lowe,1981;Gelfand and Yakir,2008;Martinet al.,2009;Castaldelliet al.,2019).Among these conditions,soillevel might be determined by soil C:N ratio,given that other characteristics(e.g.,pH and water saturation)were similar.It is possible that soil C:N ratio affects the growth of nitrifying bacteria,but the effect was different for ammonia-oxidizing bacteria (AOB) and NO-2-oxidizing bacteria (NOB), thus influencing NO-2accumulation(Okabeet al.,1996;Zhanget al., 2017).Particularly, NO-2is generated not only by nitrification,but also by denitrification.Generally,the capability of electron supply for denitrification is associated with soil C:N ratio,which may affect NO-2transformation and accumulation(Leeet al.,2019).Although some studies have documented that the NO-3and NO-2accumulation in soil were related to soil C:N ratio under various land use regimes(Thevathasanet al.,2000;Dai,2018;Baiet al.,2021),the underlying microbial mechanisms responsible for driving soil NO-3and NO-2accumulation induced by soil C:N ratio under farmland conditions remain unclear,especially along soil profiles.
The Chaobai River catchment, covering an area of 19 354 km2,is situated in the northern region of the North China Plain(NCP).The summer season in the NCP is characterized by large amounts of precipitation,accounting for 76%of total annual rainfall.The frequency of heavy rainfall events (25—50 mm d-1) in the Chaobai River catchment ranged from 11.4%to 36.1%during the period from 2004 to 2019 and showed an increasing tendency(Yanget al.,2022).The NO-3-N concentration in groundwater collected from the Chaobai River catchment exceeded the recommended maximum limit(10 mg L-1)as per the Standards for Drinking Water Quality(GB 5749—2006);moreover,the NO-2-N concentration in groundwater was above the limit(0.02 mg N L-1) prescribed in Quality Standard of Ground Water(GB/T 14848—93)(Lanet al.,2023).The main soil type in the Chaobai River catchment is a fluvo-aquic soil,which is derived from alluvial sediments and characterized by coarse texture and low water-retaining capacity.Therefore, soil NO-3and NO-2easily leach out during the rainy season.Thus, understanding the mechanisms and critical factors that drive soil NO-3and NO-2leaching is indispensable for taking effective measures to reduce environmental risks in the Chaobai River catchment.
The aims of this study were:i)to confirm the relationships between soil C:N ratio and NO-3-N and NO-2-N contents in soil samples collected in the rainy season,ii)to identify the relationships between soil C:N ratio and both NO-3-N and NO-2-N concentrations in soil solution in the field under heavy rainfall,iii)to validate the relationships between soil C:N ratio and both NO-3and NO-2leaching by a soil column experiment with simulated heavy rainfall,and iv)to explore the potential microbial mechanisms driving soil NO-3and NO-2accumulation related to soil C:N ratio.
MATERIALS AND METHODS
Description of studysite
The study area,with an area of 18.72 km2,was located at the Shunyi section of the Chaobai River catchment(40◦01′—40◦03′N,116◦40′—116◦47′E)in Beijing,China(Fig.1a).The area has a temperate semi-humid continental monsoon climate.The average annual temperature and precipitation were 11.5◦C and 625 mm,respectively.More than 75%of the annual rainfall concentrates within the period between June and September.The average height difference is 0.58 m between upstream and downstream of the Chaobai River and 0.92 m between the east and west banks in the study area(Fig.1a,Table SI,see Supplementary Material for Table SI).

Fig.1 Distributions of sampling sites in the study area(a)and diagrams of collecting soil solution in a field experiment(b)and of soil NO-3 and Nleaching in a column experiment(c).
Land uses in the study area are illustrated in Fig.1a;they include greenhouse land(1.85 km2,9.9%),open farmland(3.53 km2,18.8%),forestland(8.33 km2,44.5%),and others(2.10 km2,11.2%),which comprise pond and industrial land.The traditional cropping system in open farmland is winter wheat(Triticum aestivumL.)-summer maize(Zea maysL.)rotation within one year.The main vegetable crop grown in the greenhouse land is tomato(Lycopersicon esculentumM.).Based on the survey conducted by the Beijing Soil and Fertilizer Station (BSFS, 2016), the annual N applied to open farmland and greenhouse land were approximately 498 and 944 kg N ha-1year-1,respectively.Organic fertilizers provided about 3%and 78%of total N used in open farmland and greenhouse land,respectively.The rest of the N fertilizer applied was derived from chemical fertilizers (Duet al.,2011).Farmers often open the roof of greenhouse and spare the land as fallow in the summer season each year.According to our survey,there was no fertilization at the whole fallow period in greenhouse land.Generally, the open farmland received no base fertilizer before maize sowing in the investigated area, and only one topdressing was performed after approximately 45 d near the middle of July(Yanget al.,2007).The soil is a fluvo-aquic soil with 61%sand, 32%silt,and 7%clay for open farmland and 59%sand,34%silt,and 7%clay for greenhouse land.All samples were collected before topdressing from open farmland and in the fallow period from greenhouse land.
Soil and soil solution sampling
Twenty-two sites were selected for soil sampling in the study area, 11 located in greenhouse land and 11 in open farmland.During the rainy season(July 2021),a total of 66 soil samples were collected from depths of 0—20(topsoil),20—40(subsoil),and 40—60(third layer soil)cm at the 22 sampling sites.Latitude, longitude, and elevation of each sampling site were recorded by Global Positioning System.Soils collected were transferred to the laboratory, mixed homogeneously,and then split into two parts.One part was air-dried at room temperature and passed through a 0.149-mm sieve for the determination of SOC and TN.Another part was kept at-80◦C for DNA extraction and inorganic N analysis.
For the collection of soil solution at each sampling site,a 60-cm deep soil profile(15 cm in length,15 cm in width)was excavated with a shovel.Then,three soil solution samplers(10 cm in length)connected to vacuum Ruhr syringes were inserted in the 0—20,20—40,and 40—60 cm soil layers(Fig.1b)to collect soil solution.The soil profile was covered by a board to prevent rain from flowing directly into the excavated sampling well.After a heavy rain (approximately 80 mm rainfall on July 12, 2021), the soil solution was collected once on July 13,2021(Fig.S1,see Supplementary Material for Fig.S1).
Soil column leaching experiment
Twenty-one soil samples collected from three soil depths at 7 sampling sites were selected for soil column leaching experiment.Detailed information of these soils is summarized in Table SII(see Supplementary Material for Table SII).Plexiglass columns(2 cm in inner diameter,33 cm in length)were used to conduct the leaching experiment (Fig.1c).Firstly,a piece of 150-mm nylon filter screen was placed at the bottom of the column and a 5 mm layer of quartz sand was placed on the nylon filter.Then,a total of 80.3 g topsoil(bulk density=1.28 g cm-3),113.0 g subsoil(bulk density=1.80 g cm-3),and 111.2 g third layer soil(bulk density=1.77 g cm-3)were slowly packed into columns A,B,and C,respectively,and then the soils were slightly pressed until their height reached approximately 20 cm.Finally,another 5 mm layer of quartz sand was placed on top of the packed soil in each column.Ultrapure water was added to each column to bring the soil to maximum water-holding capacity and each column was kept for one week, after which the leachates were collected.The columns packed with topsoil,subsoil, and third layer soil were replicated nine, six, and three times,respectively.
The leaching procedure was set up according to a cascade extraction method(CEM)(Xieet al.,2019).At the leaching event, 40 mL ultrapure water, which was equivalent to 40 mm of rainfall, was slowly added to the top of soil column(A1,A2,and A3)packed with topsoil.The leachate originated from column A2 (A3) was carefully added to column B2 (B3) packed with subsoil.Subsequently, the leachate originated from column B3 was carefully added to column C3 packed with third layer soil (Fig.1c).The volumes of leachate originated from soil columns A1,B2,and C3 were recorded.Then, the leachates were filtered through a 0.45-µm polyethersulfone filter(Jin Teng,China)for analysis.
Soil,soil solution,and soil column leachate analysis
Soil pH was determined in a soil-water suspension(1:2.5 soil/water ratio) using a pH meter (Seven2Go™, Mettler Toledo, Switzerland).Soil organic carbon and TN were analyzed using the K2Cr2O7-H2SO4wet oxidation method(Nelson and Sommers, 1996) and the Kjeldahl digestion procedure(Bremner,1996),respectively.The CEM was applied to extract soil inorganic N(Xieet al.,2019).Briefly,15.0 g fresh topsoil was extracted for 1 h by shaking at 220 r min-1with 150 mL 2 mol L-1KCl solution, and then the soil extracts were filtered using filter paper.Subsequently,10.0 g fresh subsoil was extracted with 100 mL soil extracts from the topsoil and then filtered.Finally,5.0 g fresh third layer soil was extracted with 50 mL soil extracts from the subsoil and then filtered.The NH+4-N,NO-3-N,and NO-2-N concentrations in soil extracts were analyzed by the indophenol blue colorimetric method(Mulvaney,1996),the dual-wavelength spectrophotometric method(Normanet al.,1985)and the Diazo-coupling spectrophotometric method(Mulvaney,1996),respectively.
The NO-3-N and NH+4-N concentrations in soil solution and soil column leachates were determined using ion chromatography(Dionex ICS-2500,USA),and the NO-2-N concentration was determined using the Diazo-coupling spectrophotometric method(Mulvaney,1996).
Soil DNA extraction,amplification,and sequencing
A total of 18 soil samples collected from three soil depths at six sampling sites were selected to analyze soil microbial community composition associated with N transformation.Soil microbial DNA was extracted from 0.5 g soil samples using a soil FastDNA®spin kit(MP Bio,USA)following the instructions of the manufacturer.The NanoDrop One spectrophotometer(NanoDrop Technologies Inc.,USA)was used for determining total DNA concentration and purity.Later,DNA was diluted to 1 ngµL-1using sterilized ultrapure water based on the detected concentration.
The V3—V4 hypervariable regions of 16S rRNA genes were amplified using the specific primers 341Fand 806R.The polymerase chain reaction(PCR)mixture(30µL)contained 15 µL of Phusion®high-fidelity PCR master mix(New England Biolabs, USA), 2 µL of each primer (0.2µmolµL-1),10µL template DNA(1 ngµL-1),and sterilized ultrapure water up to 30µL.The primers and thermal cycling conditions used are listed in Table SIII(see Supplementary Material for Table SIII).The PCR products were purified with Qiagen gel extraction kit(Qiagen,Germany)and then sequenced on an Illumina NovaSeq platform.The soil samples used to analyze soil microbial community composition were also used to quantify the functional genes.Briefly,0.30 g of each soil sample was used to extract soil genomic DNA using a TIANamp soil DNA kit (Tiangen Biotech,China)according to the manufacturer’s protocol.ThenarG,nirK,andnirSgenes were quantified using primers as follows:1960F/2650R fornarG,nirK1F/nirK5R fornirK,and cd3aF/R3cd fornirS.The PCR reaction was performed in a 10µL reaction system,including 5µL of 2×SG Green qPCR Mix,0.2µL of each primer,1µL of template DNA,and 3.6µL of sterilized ultrapure water.Information regarding the primers used and the thermal cycling conditions are listed in Table SIII.Standard curves were obtained by a series dilution of plasmids carrying each target gene.
Statistical analysis
Exponential models were used to fit the relationships between soil C:N ratio and soil NO-3-N(NO-2-N)content,the NO-3-N(NO-2-N)concentration in soil solution,the NO-3-N(NO-2-N)concentration and accumulated NO-3-N(NO-2-N)in the soil column leachates,and the abundance of microbial functional groups and functional genes.One-way analysis of variance was applied to detect the differences in soil properties among the three soil layers under the same land use,followed by Duncan’s multiple comparisons.At the same depth,the differences in soil properties between greenhouse land and open farmland were determined using thet-test.All analyses were conducted in SPSS 19 and Origin 2021.
Partial least squares path modeling(PLS-PM)was used to investigate the possible pathways through which soil C:N ratio may influence soil NO-2and NO-3directly and indirectly.The PLS-PM analysis was conducted using Smart-PLS 3.3.3.The model’s validity was evaluated by average variance extracted (AVE, traditionally AVE> 0.5) and composite reliability(CR,traditionally CR>0.7)(Vanalleet al.,2017).In this study,the AVE value was above 0.5 and the CR value was above 0.7.
RESULTS
Distributions of soil properties with depth
Soil pH in the three soil layers ranged from 8.12 to 8.23 under open farmland and from 8.03 to 8.25 under greenhouse land(Table I).No significant difference in soil pH in each soil layer was observed between open farmland and greenhouse land.Mean SOC and TN contents in the three soil layers ranged from 3.94 to 8.52 and 0.47 to 1.07 g kg-1,respectively,under open farmland and from 4.58 to 9.49 and0.61 to 1.63 g kg-1, respectively, under greenhouse land(Table I).The differences in SOC and TN in each soil layer were not significant between open farmland and greenhouse land.The SOC and TN contents decreased with increasing soil depth regardless of land use.The average soil C:N ratio at the three depths varied from 8.19 to 8.38 under open farmland and from 6.67 to 8.12 under greenhouse land (Table I).The average C:N ratio in the topsoil(0—20 cm depth)was significantly higher(P<0.05)under open farmland than under greenhouse land,while the differences in soil C:N ratio in the other two soil layers(i.e.,subsoil,20—40 cm depth;third layer,40—60 cm depth)were not significant.Soil NO-3-N,NO-2-N, and NH+4-N contents increased with increasing soil depth under both open farmland and greenhouse land(Table I).The differences in soil NO-3-N,NO-2-N,and NH+4-N contents between open farmland and greenhouse land in each soil layer were not significant.

TABLE I Distributions of soil pH,organic C(SOC),total N(TN),C:N ratio,NO-3-N,NO-2-N,and NH+4-N with increasing soil depth under open farmland(OFL)and greenhouse land(GL)and analysis of their differences between the two land uses at each soil depth
Relationships between soil C:N ratio and soil NO-3-N and NO-2-N contents
Negative exponential relationships were observed between soil C:N ratio and NO-3-N and NO-2-N contents in each soil layer(Fig.2).A significant negative exponential relationship (P< 0.001) was observed between soil C:N ratio and both NO-3-N(r=0.897)and NO-2-N(r=0.513)contents in the topsoil.Similarly,soil C:N ratio was significantly negatively related (P< 0.001) to soil NO-3-N and NO-2-N contents extracted using CEM in both the subsoil(r=0.772 for NO-3-N and 0.829 for NO-2-N)and the third layer soil(r=0.441 for NO-3-N and 0.579 for NO-2-N).
Relationships between soil C:N ratio and NO-3-N and NO-2-N concentrations in soil solution
The NO-3-N concentration in soil solution sampled in the field from each soil layer significantly(P<0.001)and exponentially decreased with increasing soil C:N ratio in the corresponding soil layer(r=0.584,0.683,and 0.511 for topsoil,subsoil,and third layer soil,respectively)(Fig.3a—c).In each soil layer,the NO-2-N concentration in soil solution also significantly(P<0.001)and exponentially decreased with increasing soil C:N ratio(r=0.728,0.648,and 0.922 for topsoil,subsoil,and third layer soil,respectively)(Fig.3d—f).
Furthermore, the NO-3-N and NO-2-N contents in the topsoil showed significant positive linear correlations to the NO-3-N and NO-2-N concentrations in soil solution,respectively(Fig.S2,see Supplementary Material for Fig.S2).Similarly,for the subsoil and third layer soil,the NO-3-N and NO-2-N concentrations in soil solution were significantly positively correlated to soil NO-3-N and NO-2-N contents extracted using CEM.
Soil column validation of relationships between soil C:N ratio and soil NO-3-N and NO-2-N leaching

Fig.2 Relationships between soil C:N ratio and soil NO-3-N(a—c)and NO-2-N(d—f)contents at 0—20(a and d),20—40(b and e),and 40—60(c and f)cm soil depths.

Fig.3 Relationships between soil C:N ratio and the NO-3-N(a—c)and NO-2-N(d—f)concentrations in soil solution at 0—20(a and d),20—40(b and e),and 40—60(c and f)cm soil depths.
Both NO-3-N and NO-2-N concentrations in the leachates from each soil layer decreased exponentially with increasing soil C:N ratio(for topsoil,r=0.874(NO-3-N)and 0.994(NO-2-N);for subsoil,r=0.723(NO-3-N)and 0.699(NO-2-N); for third layer soil,r= 0.549 (NO-3-N) and 0.584(NO-2-N))(Fig.4a—f).Identically,the amounts of leached NO-3-N and NO-2-N from each soil layer also decreased exponentially with increasing soil C:N ratio (for topsoil,r=0.870(NO-3-N)and 0.994(NO-2-N);for subsoil,r=0.666(NO-3-N)and 0.607(NO-2-N);for third layer soil,r=0.438(NO-3-N)and 0.468(NO-2-N))(Fig.4g—l);however,the relationship between the amount of leached NO-3-N from the third layer and soil C:N ratio in the corresponding soil layer was not significant(P=0.075).

Fig.4 Relationships between soil C:N ratio and the concentrations of NO-3-N(a—c)and NO-2-N(d—f)and the amounts of leached NO-3-N(g—i)and NO-2-N(j—l)in leachates from 0—20(a,d,g,and j),20—40(b,e,h,and k),and 40—60(c,f,i,and l)cm soil depths.
The NO-3-N content in the topsoil possessed a significant positive linear correlation to the NO-3-N concentration in the leachates from the topsoil column, as well as to the amount of leached NO-3-N(Fig.S3a,b,see Supplementary Material for Fig.S3).Similarly, in both the subsoil and third layer soil, the NO-3-N concentration in the leachates markedly positively correlated with soil NO-3-N extracted by CEM,as well as the amount of leached NO-3-N.For NO-2-N,close positive relationships were found between the NO-2-N content in the topsoil and both the concentration and the amount of leached NO-2-N(Fig.S3c,d).Soil NO-2-N in the third layer extracted by CEM showed a linear correlation with the concentration and the amount of NO-2-N in leachates of the corresponding soil layer,while the relationship in the subsoil was not significant(P=0.053).
Soil bacterial community composition and functional microbial groups at genus level
Redundancy analysis(RDA)was applied to analyze the soil properties that controlled bacterial community composition at phylum level(Fig.5).The first two axes of RDA explained 52.8%of the total variance(34.2%and 18.6%for the first and second axes,respectively).The results revealed that bacterial community structure was mainly controlled by soil C:N ratio,followed by SOC,TN,and pH.
The dominant phyla across the soil samples were Proteobacteria(14.3%—43.1%),Acidobacteriota(5.8%—26.7%),Actinobacteriota(5.3%—23.6%),Gemmatimonadota(4.0%—16.1%), Chloroflexi (2.9%—13.7%), Firmicutes (1.4%—15.5%),Methylomirabilota(0.8%—6.3%),GAL15(0.4%—17.5%),Bacteroidota(0.2%—4.2%),Latescibacterota(0.4%—4.2%), Myxococcota (0.6%—2.4%), Nitrospirota (0.4%—2.6%),NB1_j(0.4%—2.3%),and Desulfobacterota(0.4%—2.9%) (Fig.6).Although the dominant phyla in each soil sample were consistent,changes in their abundances were found with varying C:N ratios (Fig.6).In general, in the soils with lower C:N ratio,the abundances of Proteobacteria and Actinobacteriota were higher,whereas the abundances of Acidobacteriota and Nitrospirota were lower.
At the genus level, some genera related to ammonification(e.g.,Flavobacterium,Bacillu,andPseudomonas),ammonia oxidation(e.g.,Nitrosospira),and NO-2oxidation(e.g.,Nitrospira) were identified and selected to analyze how they changed under the influence of soil C:N ratio(Fig.S4, see Supplementary Material for Fig.S4) (Bach and Munch,2000;Prosser and Nicol,2012;Daebeleret al.,2014; Sunet al., 2020).For the ammonification process,a negative relationship was found between soil C:N ratio andFlavobacteriumabundance across soil depths,while the relationship in the third layer soil was not significant(P=0.185)(Fig.7a—c);the abundance ofBacillusdecreased with increasing C:N ratio in the topsoil and third layer soil,while it increased with increasing C:N ratio in the subsoil(Fig.7d—f);the abundance ofPseudomonassignificantly exponentially decreased with increasing soil C:N ratio, whereas the relationship in the topsoil was not significant (P= 0.072)(Fig.7g—i).For the ammonia oxidation process,the abundance ofNitrosospirain all three soil layers exponentially decreased with increasing soil C:N ratio, whereas the relationship was significant(P=0.031)only in the topsoil(Fig.7j—l).For the NO-2oxidation process,a significantly positive exponential relationship was determined between the abundance ofNitrospiraand soil C:N ratio in all soil layers(Fig.7m—o).
Functional genes related to denitrification in soil N transformation

Fig.5 Redundancy analysis(RDA)of bacterial community composition at phylum level as influenced by soil properties at 0—20,20—40,and 40—60 cm soil depths.SOC=soil organic C;TN=total N.

Fig.6 Bacterial community composition at phylum level at 0—20,20—40,and 40—60 cm soil depths under different soil C:N ratios.
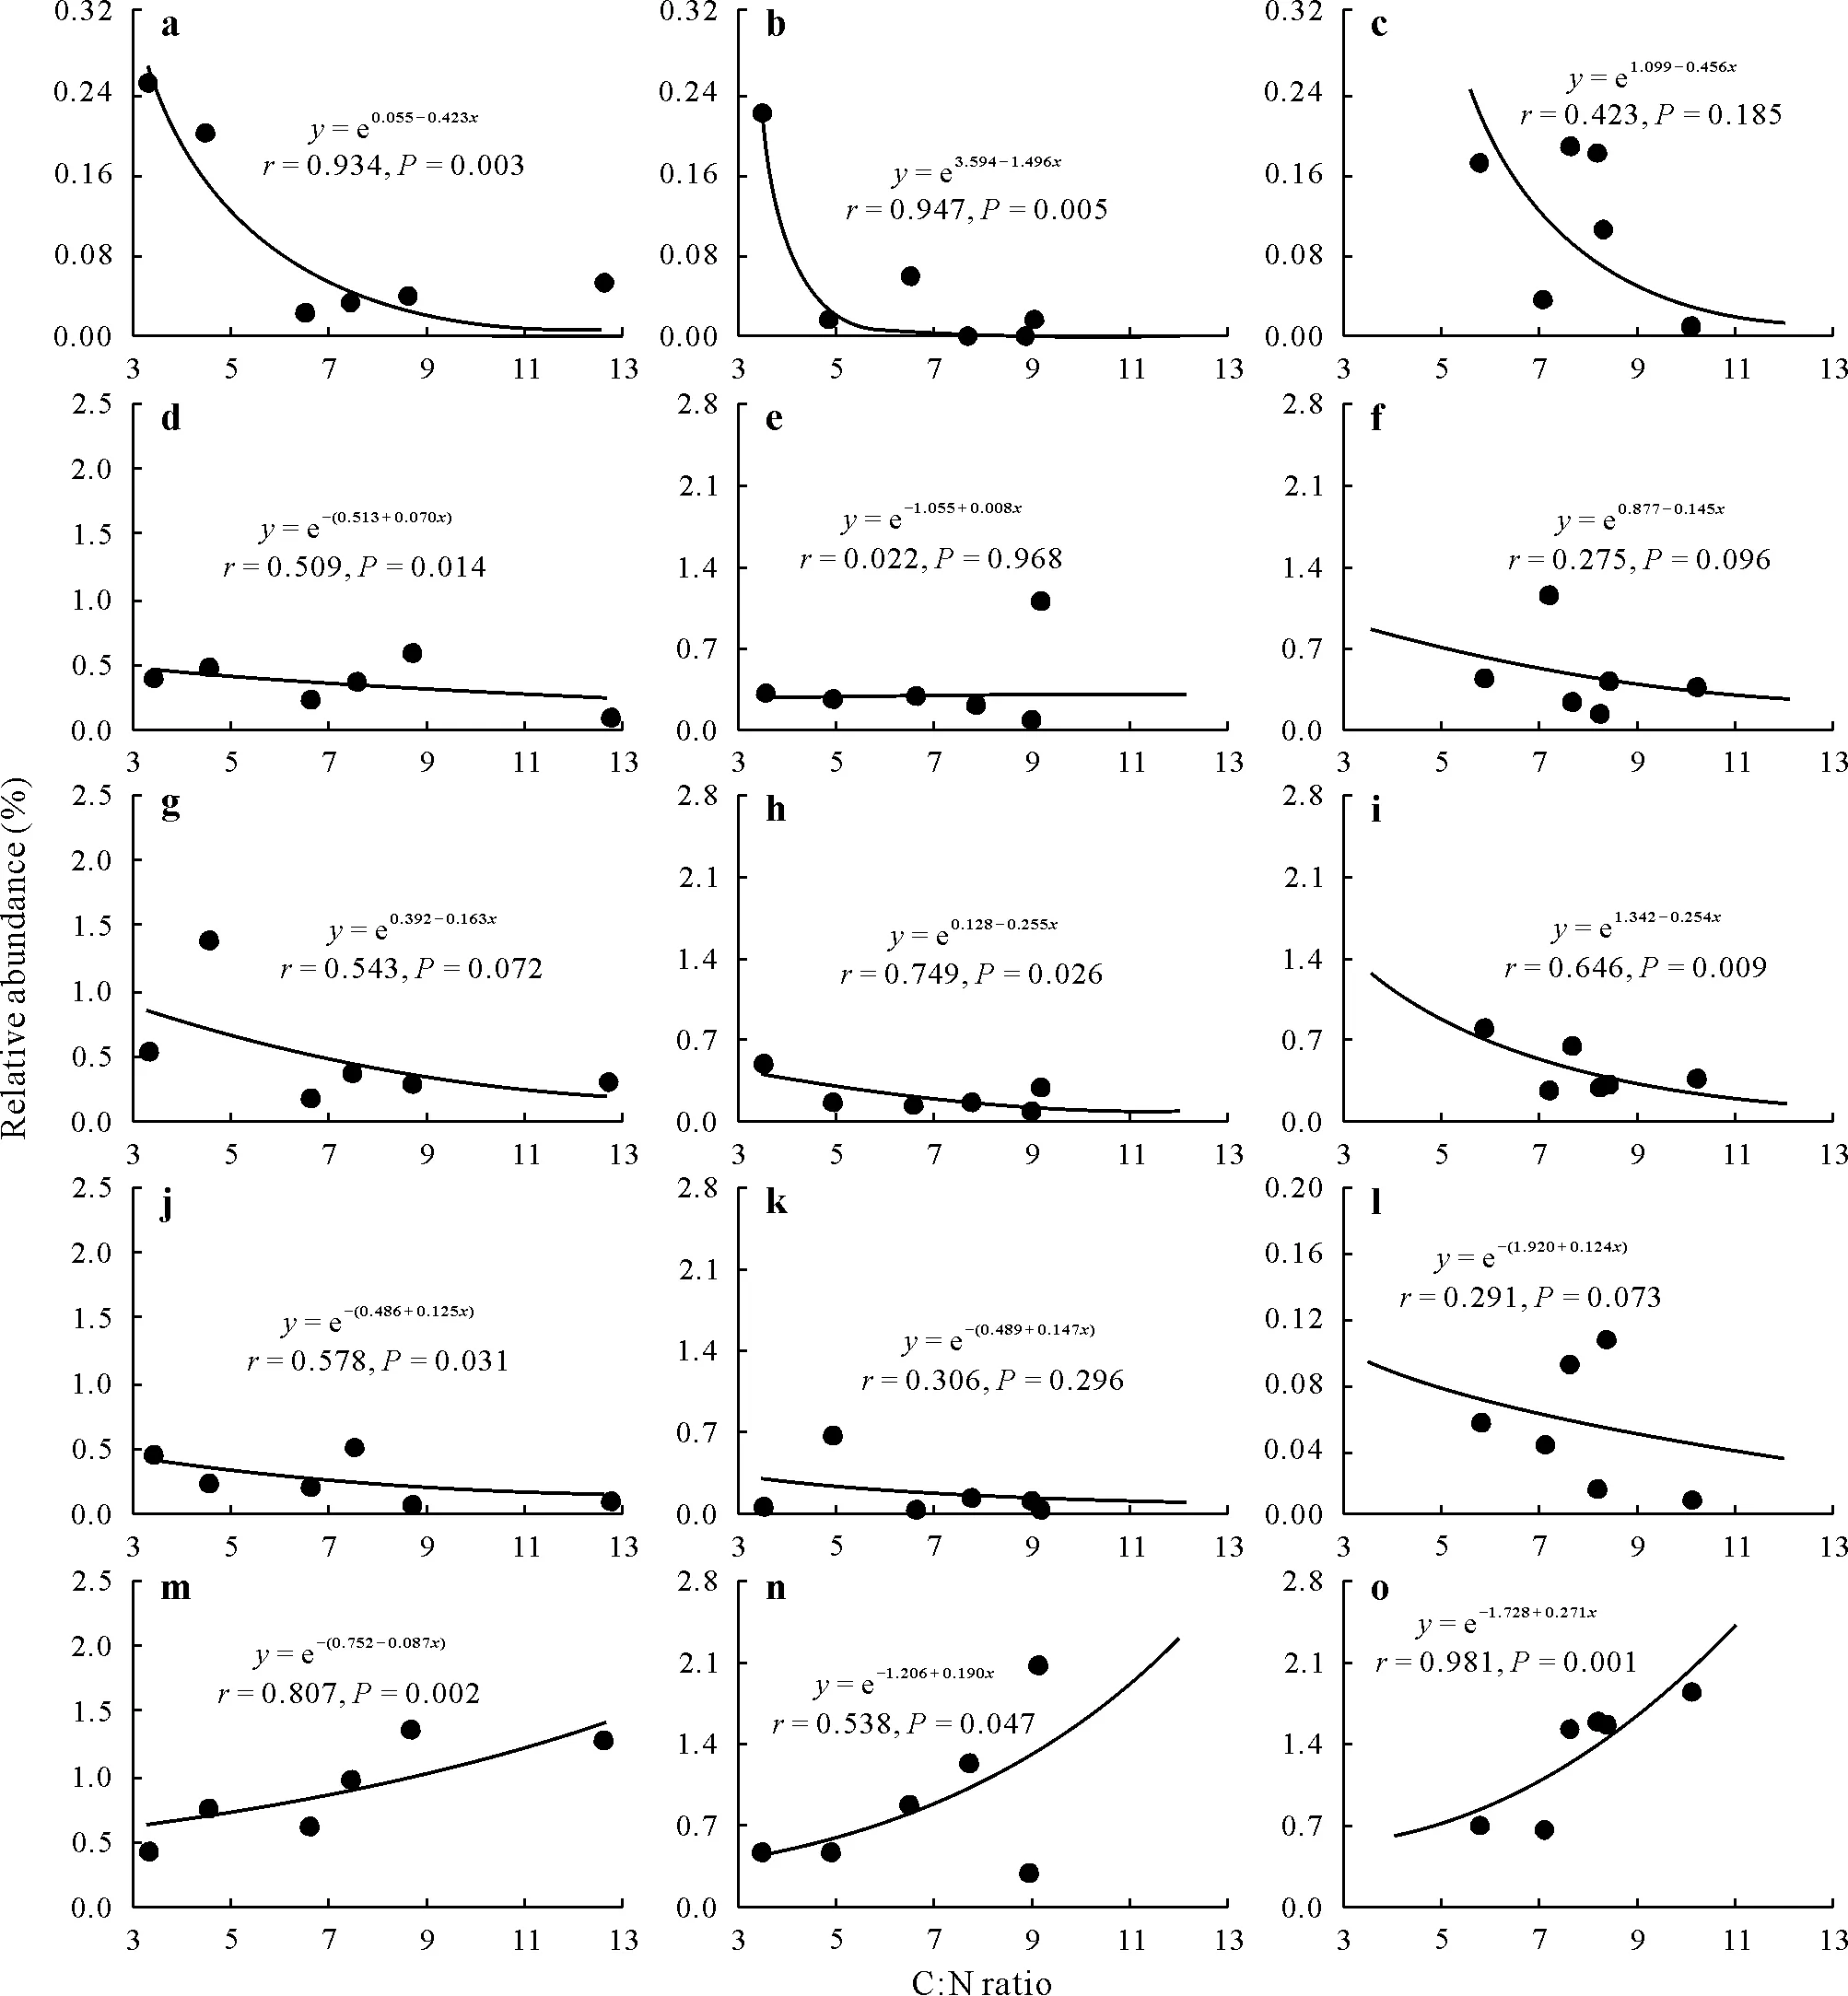
Fig.7 Exponential relationships between soil C:N ratio and the relative abundances of functional microbial groups at genus level associated with N transformation at 0—20(a,d,g,j,and m),20—40(b,e,h,k,and n),and 40—60(c,f,i,l,and o)cm soil depths.Some genera were identified and selected,including ammonifiers Flavobacterium(a—c),Bacillus(d—f),and Pseudomonas(g—i),which transform organic N to ammonium,ammonia-oxidizing bacteria Nitrosospira(j—l),which oxidize NH+4 to NO-2 ,and NO-2-oxidizing bacteria Nitrospira(m—o),which oxidize NO-2 to NO-3.
To investigate how soil C:N ratio influenced the denitrification,the abundances of functional genes includingnarGandnirS/Kgenes were estimated by PCR.The abundance ofnarGgene, encoding NO-3reductase, in all soil layers increased exponentially with increasing soil C:N ratio in the rainy season,while the relationship in the topsoil was not significant(Fig.8a—c).This suggested that the proportion of the microorganisms carryingnarGgene was lower at lower soil C:N ratio.Conversely,nirSandnirKgenes,encoding NO-2reductase, decreased with increasing soil C:N ratio across soil depths,whereas the relationship was significant only fornirSgene(Fig.8d—i).
PLS-PM analysis

Fig.8 Exponential relationships between soil C:N ratio and the abundances of functional genes associated with denitrification,including narG(a—c),nirS(d—f),and nirK(g—i)genes,at 0—20(a,d,and g),20—40(b,e,and h),and 40—60(c,f,and i)cm soil depths.narG gene is the NO-3 reductase gene,encoding reductase that converts NO-3 to NO-2 ;nirS and nirK genes are the NO-2 reductase genes,encoding reductase that converts NO-2 to NO.
The PLS-PM analysis showed that soil C:N ratio affected soil NO-3-N content indirectly by strongly affecting thenarGgene abundance(λ=0.43**,P<0.01),which had a direct negative effect on soil NO-3-N content (Fig.9).Similarly, Soil C:N ratio indirectly impacted soil NO-2-N content by strongly influencing the abundance ofNitrospira(λ=0.59***,P<0.001),which exerted a direct negative effect on soil NO-2-N(Fig.9).As for standardized effects,NO-3reduction was shown to be the predominant negative factor influencing soil NO-3-N,followed by NO-2oxidation(Fig.S5,see Supplementary Material for Fig.S5).Similarly,NO-2oxidation was the predominant negative factor affecting soil NO-2-N content(Fig.S5).
DISCUSSSION
Relationships between soil C:N ratio and soil NOand Nleaching under heavyrainfall
In this study,the topsoil NO-3-N content was negatively exponentially associated with soil C:N ratio(Fig.2,Table SIV,see Supplementary Material for Table SIV).This result is in line with the findings reported by Dannenmannet al.(2007)in forest soils in southern Germany and those by Baiet al.(2021)in vegetable soils in China.These results indicate that a high soil C:N ratio was not conducive to the formation and accumulation of NO-3, which might be explained as follows.Firstly,as Amlingeret al.(2003)observed,arable soil only showed N release and little N binding when soil C:N ratio was lower than 9 and only N binding and little N release when the ratio was greater than 11.Similarly,Zhanget al.(2013) found that NO-3immobilization was negligible in agricultural soils with C:N ratio below 12.In this study, topsoil C:N ratio was between 3.27 and 12.60 with a mean value of 8.38 for open farmland and 6.67 for greenhouse land (Fig.2, Table I).Thus, topsoil samples might have sustained highly active N mineralization and very weak immobilization.Secondly,the soils with high C:N ratio show weak mineralization and nitrification,which go against NO-3formation and accumulation(Zhanget al.,2013),as N mineralization and nitrification are positively related to soil NO-3-N content(Springob and Kirchmann,2003).
The topsoil NO-2-N content significantly exponentially decreased with increasing soil C:N ratio (Fig.2).To our knowledge,no similar results had been reported for a soil to date.However,Capodiciet al.(2019)observed that the NO-2-N in wastewater rapidly decreased with increasing C:N ratio,implying that low C:N ratio in media is beneficial for NO-2formation and accumulation.

The exponential curve has been widely used for fitting NO-3leaching as a function of soil C:N ratio(Diseet al.,2009;Gundersenet al.,2009).In the present study,an exponential function was observed to achieve a better fitting relationship between soil C:N ratios in each soil layer and the NO-3-N concentrations in soil solution from the corresponding layers as well as NO-2-N concentrations under heavy rainfall events(Fig.3).We attributed this to the fact that soil NO-3-N and NO-2-N contents extracted using CEM showed a significant exponential relationship with soil C:N ratio(Fig.2).In addition, the NO-3-N and NO-2-N contents in the three soil layers were linearly related(P<0.01)to the NO-3-N and NO-2-N concentrations in soil solution in the corresponding soil layers,respectively(Fig.S2).
In this study, a soil column leaching experiment with simulated heavy rainfall was conducted and confirmed that the relationships between soil C:N ratio in each soil layer and the NO-3-N and NO-2-N concentrations in the leachates from the corresponding soil layer followed exponential functions(Fig.4),which are in line with the patterns observed in the field under heavy rainfall events (Fig.3).Furthermore, the positive linear correlation between soil NO-3-N(NO-2-N)content and the NO-3-N(NO-2-N)concentration in the leachate from soil column(Fig.S3)further supported the feasibility of CEM for predicting soil NO-3and NO-2leaching.
Microbial mechanisms of soil Nand Naccumulation and leaching as affected bysoil C:N ratio


The soils with low C:N ratio were reported to have high activity of N release by microorganisms(Fujiiet al.,2019).In ammonification process,the abundances of three ammonifying bacteria genera (Flavobacterium,Bacillu,andPseudomonas) in soil, except forBacilluin the subsoil,showed a downward trend as soil C:N ratio increased(Fig.7a—i,Table SIV).Furthermore,a weakly negative relationship was observed between soil C:N ratio and soil NH+4-N content (Table SIV, Fig.S6a, see Supplementary Material for Fig.S6).The PLS-PM analysis also proved that soil C:N ratio had a direct negative effect on ammonifying bacteria,which positively affected soil NH+4-N content(Fig.9).These results imply that the soils with low C:N ratio have stronger ammonification, favoring the conversion of soil organic N into NH+4-N in the rainy season.However,no quantitative relationship was detected between soil C:N ratio and NH+4leaching,either in the field or in soil column(Fig.S6),which might be due to NH+4adsorption and fixation in soil(Nommik and Vahtras,1982).
Nitrification process includes two steps, namely ammonia oxidation and NO-2oxidation.In ammonia oxidation process, ammonia is converted into NO-2by ammoniaoxidizing bacteria(AOB)in alkaline soils.In NO-2oxidation process, NO-2is converted into NO-3by NO-2-oxidizing bacteria(NOB).Here,we observed that the abundance ofNitrosospira,one of AOB,across soil profile tended to decrease with increasing soil C:N ratio(Fig.7j—l,Table SIV),indicating the higher capability for transforming NH+4to NO-2in the soils with low C:N ratio.This result was in keeping with the previous studies conducted by Nugrohoet al.(2006)in coniferous forest soils and by Liuet al.(2021)in paddy soils.Nitrospirais one of main NOB in NO-2oxidation process.The present results showed that the abundance ofNitrospiraacross soil profile increased with increasing soil C:N ratio(Fig.7m—o,Table SIV),implying a lower ability for converting NO-2to NO-3at low C:N ratio.This result was supported by Xu S Yet al.(2020)and Zhang Qet al.(2019),who found that the soils with high C:N ratio usually possessed moreNitrospirain the representative agricultural(e.g.,vegetable,wheat,and rice)soils of China,whereas an opposite phenomenon was observed in the subtropical forest soils of Mount Lu in Jiangxi Province, China(Hanet al.,2020).The discrepancy under different land uses might be explained as follows.Previous studies have reported thatNitrospiragrowth will be promoted with increasing C:N ratio up to the optimal value and that it will be inhibited when soil C:N ratio is above the optimal value(Chenget al.,2017;Miaoet al.,2018).In general,soil C:N ratio in forest land is higher than that in agricultural land because of more C(e.g.,litter)and less N inputs into forest soils(Gaoet al.,2014).Therefore, soil C:N ratio in agricultural land may be below the optimal value forNitrospiragrowth, and in forest land it may be above this value.Thus,compared to the soils with high C:N ratio,the soils with low C:N ratio have relatively higher AOB(Nitrosospira)abundance and lower NOB(Nitrospira)abundance(Fig.7j—o),which might be a major reason for NO-2accumulation in the soils with low C:N ratio across soil profile in the rainy season(Fig.2d—f).


Controlling soil Nand Naccumulation and leaching based on regulation of soil C:N ratio

The low soil C:N ratio in open farmland might be attributed to the low SOC content(Table I),which coincided with the results obtained in one wheat-maize field (Yanet al.,2012).The Shunyi District,where the study area is located,has been vigorously promoting the return of maize and wheat to farmland(Liu and Li,2017).Nonetheless,the return of crop residues to supply soil with OC might not compensate for SOC loss due to decomposition caused by frequent tillage in open farmland.Halvorsonet al.(2002)confirmed that minimum tillage might increase SOC sequestration in crop rotation systems.Thus, minimum tillage combined with straw turnover might be a suitable measure to increase soil C:N ratio in open farmland for controlling NO-3and NO-2accumulation and leaching in soil profile under heavy rainfall.
High soil N level may be the main reason for low soil C:N ratio in greenhouse land(Yanet al.,2012),Thus,a N reduction strategy should be considered in this case.In the studied area,more than 70%of fertilizer N originated from manure and the amount of manure applied was nearly 38 t ha-1year-1in greenhouse land(Duet al.,2011;Heimannet al.,2015).Because the application of manure with low C:N ratio brings about more available N to soils(Degenset al.,2000;Accoeet al.,2004),long-term continuous application of manure to greenhouse land decreased soil C:N ratio,which in turn increased NO-3and NO-2accumulation and leaching when heavy rainfall events occur.Hence,the partial replacement of manure with organic materials with high C:N ratio(e.g.,straw and biochar)in greenhouse land is recommended to improve soil C:N ratio for reducing Nand NO-2accumulation and leaching in soil profile.
CONCLUSIONS
Soil NO-3-N and NO-2-N in the 0—20, 20—40, and 40—60 cm soil layers decreased exponentially with increasing soil C:N ratio.A negative exponential relationship was also found between soil C:N ratio and the NO-3-N and NO-2-N concentrations in soil solution in each soil layer under heavy rainfall.The soil column (0—20, 20—40, and 40—60 cm)experiment with simulated heavy rainfall further confirmed the negative exponential relationship between soil C:N ratio and the NO-3-N and NO-2-N concentrations in leachate.Gene sequencing combined with real-time PCR in soil samples with varying C:N ratios at six field sites in the rainy season revealed that the soils with low C:N ratio sustained high abundances of ammonifying bacteria(Flavobacterium,Bacillu, andPseudomonas), ammoniaoxidizing bacteria(Nitrosospira),andnirSandnirKgenes,while opposite results,i.e.,low abundances of NO-2-oxidizing bacteria(Nitrospira)andnarGgene,were observed at low soil C:N ratio.The PLS-PM analysis further evidenced that high NO-3-N and NO-2-N levels in the soils with low C:N ratio were mainly attributed to the inhibition of Nreduction(i.e.,lownarGgene)and NO-2oxidation(i.e.,lowNitrospira)and thus the accumulation of soil NO-3and NO-2,respectively.Therefore,more attention should be given to the risk of NO-3and NO-2leaching in the soils with low C:N ratio during the rainy season,and effective measures should be taken to reduce soil NO-3and NO-2leaching to preserve groundwater quality.
ACKNOWLEDGEMENT
This study was funded by the National Key Research and Development Project of China(No.2016YFD0800100-04).SUPPLEMENTARY MATERIAL
Supplementary material for this article can be found in the online version.
杂志排行

Pedosphere的其它文章
- Drying-rewetting cycles reduce bacterial diversity and carbon loss in soil on the Loess Plateau of China
- Pedotransfer functions for predicting bulk density of coastal soils in East China
- Free-living nematode community structure and distribution within vineyard soil aggregates under conventional and organic management practices
- Effects of rhamnolipids on bacterial communities in a dioxin-contaminated soil and the gut of earthworms added to the soil
- Biochar reduces uptake and accumulation of polycyclic aromatic hydrocarbons(PAHs)in winter wheat on a PAH-contaminated soil
- Environmental similarity is more important than distance in the community structuring processes of ammonia-oxidizing archaea in agricultural soils