Drying-rewetting cycles reduce bacterial diversity and carbon loss in soil on the Loess Plateau of China
2023-12-21PanpanJIAOHaibingXIAOZhongwuLILeiYANGandPengZHENG
Panpan JIAO,Haibing XIAO,Zhongwu LI,Lei YANG and Peng ZHENG
1State Key Laboratory of Soil Erosion and Dryland Farming on the Loess Plateau, Research Center of Soil and Water Conservation and Ecological Environment,Chinese Academy of Sciences and Ministry of Education,Yangling 712100(China)
2Institute of Soil and Water Conservation,Chinese Academy of Sciences and Ministry of Water Resources,Yangling 712100(China)
3University of Chinese Academy of Sciences,Beijing 100049(China)
4State Environmental Protection Key Laboratory of Soil Health and Green Remediation,Huazhong Agricultural University,Wuhan 430070(China)
5College of Resources and Environmental Sciences,Hunan Normal University,Changsha 410081(China)
6Key Laboratory of Soil Environment and Pollution Remediation,Institute of Soil Science,Chinese Academy of Sciences,Nanjing 210008(China)
ABSTRACT With global climate change,soil drying-rewetting(DRW)events have intensified and occurred frequently on the Loess Plateau of China.However,the extent to which the DRW cycles with different wetting intensities and cycle numbers alter microbial community and respiration is barely understood.Here,indoor DRW one and four cycles treatments were implemented on soil samples obtained from the Loess Plateau,involving increase of soil moisture from 10% water-holding capacity(WHC)to 60% and 90% WHC(i.e.,10%—60% and 10%—90% WHC,respectively).Constant soil moistures of 10%,60% ,and 90% WHC were used as the controls.The results showed that bacterial diversity and richness decreased and those of fungi remained unchanged under DRW treatments compared to the controls.Under all moisture levels,Actinobacteriota and Ascomycota were the most dominant bacterial and fungal phyla,respectively.The bacterial network was more complex than that of fungi,indicating that bacteria had a greater potential for interaction and niche sharing under DRW treatments.The pulse of respiration rate declined as the DRW cycle increased under 10%—60% WHC,but remained similar for different cycles under 10%—90%WHC.Moreover,the DRW treatments reduced the overall carbon loss,and the direct carbon release under 10%—60% WHC was larger than that under 10%—90% WHC.The cumulative CO2 emissions after four DRW cycles were significantly positively correlated with microbial biomass carbon and negatively correlated with fungal richness(Chao 1).
Key Words: bacterial network,cumulative CO2 emissions,fungal richness,microbial biomass carbon,microbial community,respiration rate,soil moisture
INTRODUCTION
The Loess Plateau of China is a typical temperate semiarid area that has experienced serious soil erosion(Zhanget al., 2016).Intensified evaporation under high temperatures and extreme rainfall in the context of global climate change would accelerate the frequency and intensity of soil drying-rewetting(DRW)cycles on the Loess Plateau(Guoet al.,2014).By affecting the transportation and availability of soil nutrients,soil moisture plays a key role in maintaining microbial community structure and carbon(C)cycle(Loganet al.,2021).Drying-rewetting cycles were found to have a considerable effect on soil microbial physiology(Treseder and Lennon,2015),respiration(Muhret al.,2008;Peregrina,2016), and community structure (Evans and Wallenstein,2012; Manzoniet al., 2012) in grassland, forestland, and cropland soils.Understanding how microbial communities and respiration respond to the DRW cycles will help us predict how arid and semiarid systems respond to changing climatic regimes.
The effects of DRW cycles on soil microorganisms are of particular importance in water-deficient systems such as drylands,where soil microbes may experience severe drought stress.Shiet al.(2019) and Zhouet al.(2010) indicated that specific microbial groups did not live in isolation,but instead jointly built up complex microbe-microbe interaction networks or modules,which could play an important role in regulating the structure of an ecological community.The complexity and high biological diversity of soils facilitate many potential feedbacks to the disturbance of DRW cycles(Bissettet al.,2013).Bacteria are commonly more responsive to water stress than fungi(Manzoniet al.,2012;Jiaoet al.,2021).However,McHugh and Schwartz(2016)revealed that watering manipulation induced variation in fungal rather than bacterial community composition in semiarid areas.This was attributed to the fact that bacteria and fungi are generally distributed in the inner and outer portions of soil aggregates,respectively.The addition of water favors fungi by expanding the available habitat for growth (McHugh and Schwartz,2016).Nevertheless,Griffithset al.(2003)observed few or no difference in the microbial community structure in both wet and dry soils.In addition,the DRW cycle with a lower frequency and a longer period of drought was reported to be correlated with the relative abundance of fungi,and the resistance of microbial community composition to repeated DRW stress was dependent on the ecosystem type(Ouyang and Li,2020).In contrast,microbial diversity,richness,and microbial biomass C(MBC)were observed to be insensitive to the frequency and drought intensity of DRW cycle(Fiereret al., 2003; Xianget al., 2008; Liet al., 2018).Sawadaet al.(2017)also revealed that the MBC of soils that have historically experienced fewer DRW cycles may be more vulnerable to DRW events with abruptly increased frequency in the context of global climate change.These controversial conclusions may be due to the different specific moisture histories in the respective studied ecosystems,as well as the differences in experimental methods(Evans and Wallenstein,2012;Kaisermannet al.,2015).Therefore,a systematic study of the effects of DRW cycles on microbial community composition and cooccurrence network is necessary.
Soil respiration,namely the flux of carbon dioxide(CO2)from soil, is the second largest C flux between terrestrial ecosystem and the atmosphere (Chenet al., 2017; Tonget al., 2020).Therefore, it is important to quantitatively investigate the response of soil respiration to DRW cycles.During drying,the respiration rate decreases with a reduction in microbial biomass and substrate diffusion(Shi and Marschner, 2015).Fungi can maintain a high respiration rate under drought condition (Canariniet al., 2017).The sudden flush of moisture and nutrients that occurs upon rewetting leads to abrupt increases of bacterial and fungal activities,resulting in increased respiration(Canariniet al.,2017).Thus,the DRW cycles are expected to considerably influence C balance.However,the variation pattern of C loss under DRW condition and whether substrate and microbial biomass are the main factors remain unclear.When multiple DRW cycles are experienced,the CO2flush following rewetting decreases or even disappears as the cycle number increases(Zhanget al.,2020).Yemadjeet al.(2017)reported that during five DRW cycles,a CO2pulse was only observed in the first cycle.In addition,the effect of drying intensity during DRW cycle on soil respiration has been widely studied(Wu and Brookes,2005;Muhret al.,2008).Muhret al.(2010) reported that C loss under constant soil moisture condition was higher than that under DRW treatment with different drying intensities.However,Jinet al.(2013)suggested that C loss under constant soil moisture condition was lower than that under DRW treatment for different drying intensities.Apart from drying intensity, wetting intensity and DRW frequency(i.e.,the number of DRW cycles)are other important moisture variations that affect C loss.Kieftet al.(1987)reported that MBC responded to the flush of respiration when dry soil was wetted,and extractable organic C(EOC)may be another reason for the flush of respiration(Xianget al.,2008).Soil microbial respiration is largely mediated by EOC,and EOC changes after rewetting are linearly correlated with soil CO2emissions(Canariniet al.,2017).The drying process of soil promoted the release of EOC,and the rewetting process induced a sharp decline in EOC content,which resulted in the flush of soil microbial respiration(Xianget al.,2008;Canariniet al.,2017).However,there is little information on the effects of wetting intensity and the number of DRW cycles on C loss.Therefore,it is crucial to conduct a deep investigation into the effects of wetting intensity and the number of DRW cycles on respiration rate and C loss in soil on the Loess Plateau.Furthermore, understanding how microbial communities, respiration, and cooccurrence are driven by different moisture variables will help us better predict how microbes and C cycling in soil will change under the changing climate conditions on the Loess Plateau.
Herein, we hypothesized that compared with fungi,bacteria were more significantly affected by high wetting intensity under DRW treatment and that the change in microbial community after one DRW cycle (i.e., 1-DRW) was significantly different from that after four DRW cycles(i.e.,4-DRW).We also hypothesized that the degree of C loss in soil was greater under higher wetting intensity during DRW cycles and that C loss was correlated with MBC.To test our hypotheses,high-throughput sequencing and cooccurrence networks were applied to i)investigate the effects of wetting intensity and the number of DRW cycles on microbial diversity, community composition, and interactions,ii)evaluate the effects of the number and wetting intensity of DRW cycles on respiration rate and C loss in soil, and iii)investigate MBC or EOC responsible for the total CO2emissions from soil on the Loess Plateau of China.
MATERIALS AND METHODS
Study site and sample collection
Soil samples were collected from an agricultural land(36◦48′53.59′′N,109◦14′37.51′′E,altitude 1 272 m above sea level)near the Ansai Soil and Water Conservation Research Station on the Loess Plateau, Shaanxi Province,northern China.The area has a temperate semiarid climate with a mean annual precipitation of 510 mm,more than 60% of which falls between June and September.The average annual temperature is 8.8◦C, with an average minimum temperature in January of-6.2◦C and an average maximum temperature in August of 37.2◦C(Zhanget al.,2016).The soil,developed on wind-deposited loess parent material,is classified as a Huangmian soil (Calcic Cambisols, FAO)with a surface pH of 8.47±0.01.It is characterized by yellow granules,an absence of bedding,and overall looseness.Owing to porous texture,poor water and fertilizer retention,imperfect development, and weak cohesion, the soil was prone to severe soil erosion without sufficient vegetation cover(Jiaoet al.,2021).To control soil erosion,this area was converted to terracing.The land has been under continuous maize rotation for over 15 years.The crops and soil properties at this site are representative of the northern region on the Loess Plateau.
Soil samples were collected in August 2020 at 0—15 cm depth and immediately transferred within ice packs to the laboratory, where they were stored at 4◦C until being combined,processed,and sieved through 2-mm meshes to remove visible roots,residues,and stones.The soil sample was divided into two parts:one part was used for incubation experiment and the other was air-dried to determine soil physicochemical characteristics(Table SI,see Supplementary Material for Table SI).
Incubation experiment
Homogeneous soil sample(40 g)was placed in a 380-mL glass bottle and wetted to 60% water-holding capacity(WHC)at 25◦C for 7 d in the dark to stabilize microbial activity(Xiaoet al.,2017;Liet al.,2018).Following preincubation,the bottles were incubated in the dark at 25◦C for 7 or 28 d.Gas samples were collected from the headspace at 2,5,6,and 7 d of each cycle for the measurement of CO2emissions.A gas chromatography system(7890B,Agilent Technologies,Santa Clara,USA)equipped with a thermal conductivity detector was used to measure CO2emissions,and three replicates of empty glass bottles were incubated in the dark at 25◦C as the controls.
To examine the influences of the intensity and number of DRW cycles,we designed treatments with DRW intensities increasing from 10% to 60% or 90% WHC, denoted as 10%—60% and 10%—90% WHC, respectively, and with DRW experiencing one or four cycles, denoted as 1- and 4-DRW,respectively.There were three replicates for each treatment and 30 glass bottles in total.Soil samples were collected at 7 d after 1-DRW and at 28 d after 4-DRW.Each DRW cycle contained three stages,comprising 3 d of drying down,2 d of drying(10%WHC),and 2 d of wetting(60% or 90%WHC).One DRW cycle was carried out as follows:after pre-incubation,a certain amount of silica gel(32 and 45 g)was packed in a reticular bag and hung over the headspace of the glass bottles to adjust soil moisture to 10%WHC within 3 d.The silica gel was then removed from the bottle to keep soil moisture constant at 10%WHC for 2 d,after which deionized water was sprayed immediately on soil surface to maintain soil moisture constant at 60% or 90%WHC for 2 d.For 4-DRW,the soil samples were treated with the same DRW procedure for 1-DRW.Three constant soil moisture levels of 60% ,90%,and 10%WHC were set as the controls for both 1-and 4-DRW,and the measurements were conducted at the same stage as the DRW treatments.Soil moisture was adjusted by measuring the gravimetric water content at each stage.The microbial experiments were conducted by collecting 5 g of soil and freezing at-70◦C for bacterial and fungal community analysis.
DNA extraction and Illumina MiSeqhigh-throughput sequencing
The microbial DNA of each soil sample was extracted from 0.5 g soil using the E.Z.N.A.®soil DNA kit(Omega Bio-Tek,Norcross,USA)following the manufacturer’s instructions.The quantity and quality of the DNA extracts were determined using a NanoDrop 2000 UV-Vis spectrophotometer(Thermo Scientific,Wilmington,USA).The primers 338F(5′-ACTCCTACGGGAGGCAGCAG-3′)and 806R(5′-GGACTACHVGGGTWTCTAAT-3′)(Xiaoet al.,2017),which targeted the bacterial 16S rRNA V3—V4 regions,and ITS1F(5′-CTTGGTCATTTAGAGGAAGTAA-3′)and ITS2R(5′-GCTGCGTTCTTCATCGATGC-3′)(Adamset al.,2013),which targeted the fungal internal transcribed spacer(ITS)1 region,were used to amplify 16S rRNA and ITS rRNA gene fragments,respectively,from each sample.Primers were tagged with unique barcodes for each sample.The polymerase chain reaction(PCR)amplification procedure was as follows:initial denaturation at 95◦C for 3 min,followed by 27 cycles(for bacteria)or 35 cycles(for fungi)of denaturing at 95◦C for 30 s,annealing at 55◦C for 30 s,and an extension at 72◦C for 45 s,and a single extension at 72◦C for 10 min before ending at 10◦C.Amplification was carried out in a mixture(20µL)containing 4µL 5×FastPfu buffer,2µL 2.5 mmol L-1dNTPs,0.8µL 5µmol L-1forward primer, 0.8 µL 5 µmol L-1reverse primer,0.4 µL FastPfu DNA polymerase, 0.2 µL Bovine Serum Albumin,10 ng template DNA,and double distilled H2O.Successful PCR amplification was verified by 2%agarose gel electrophoresis, purified using an AxyPrep DNA gel extraction kit(Axygen Biosciences,Union City,USA),and quantified using a Quantus™fluorometer (Promega, San Francisco, USA).The 16S rRNA and ITS genes were sequenced on an Illumina MiSeq PE250 platform(Illumina,San Diego,USA).
Data processing and statistical analysis
The raw FASTQ files were quality-filtered using QIIME(version 1.17),according to previous literature(Caporasoet al., 2012).Operational taxonomic units (OTUs) were clustered using UPARSE(version 7.1)with a 97%similarity cutoff.The relative abundance was assayed based on the number of OTUs affiliated with the same phylogenetic group divided by the total number of OTUs.To minimize the effect of sequencing depth on alpha and beta diversity measures,the number of reads from each sample was rarefied to 32 874 for bacteria and 65 859 for fungi(Table SII,see Supplementary Material for Table SII).In addition,the indices Shannon index,Chao 1,and ACE were calculated using the Mothur and R software package to describe the alpha diversity and species richness of the bacterial and fungal communities.Finally,the original reads were sent to the Sequence Read Archive of the National Center for Biotechnology Information(NCBI)under the accession numbers of SRP 322284 for bacteria and SRP 322287 for fungi.Microbial biomass C was measured according to the methodology of Shi and Marschner(2017)by extracting chloroform-fumigated and non-fumigated samples in ultrapure water.Extractable organic C was obtained from a TOC analyzer (TOC-VCPH,Shimadzu,Kyoto,Japan)after filtering the extracts of 15 g fresh soil in 0.5 mol L-1K2SO4solution (Xianget al.,2008).
Cumulative CO2emissions during the incubation period were calculated using a linear interpolation method(Liet al.,2018).One-way analysis of variance(ANOVA)and a least significant difference(LSD)multiple comparison were used to detect the means of microbial properties after 1- or 4-DRW or after 1- and 4-DRW at the same soil moisture.The respiration rate changes at 2,5,6,12,13,19,20,26,and 27 d of the incubation under different soil moisture conditions and direct C release under the 10%—90% and 10%—60% WHC treatments were also analyzed using oneway ANOVA with the LSD test.Microbial cooccurrence networks were explored and visualized using the interactive platform Gephi(https://gephi.github.io/).A coefficient cutoffof|0.60|was used in the network.Node-level topological properties were calculated using Gephi.The dissimilarity in microbial community composition among different soil moisture conditions was calculated in the R package‘vegan’using principal coordinate analysis(PCoA)with Bray-Curtis distance.All statistical analyses were performed using SPSS version 25,and significant differences for statistical analyses were identified atP<0.05.
RESULTS
Different responses of soil microbial diversity and richness

Fig.1 Boxplots of bacterial (a and c) and fungal (b and d) Shannon index and Chao 1 under different soil moisture conditions after one and four drying-rewetting(DRW)cycles(1-and 4-DRW,respectively).Bars with the same letter(s)for 1-or 4-DRW indicate significant differences at P <0.05.Asterisks(*)indicate significant differences between 1-and 4-DRW under the same soil moisture levels at P <0.05.WHC=water-holding capacity.10%—60% and 10%—90%WHC indicate DRW intensities increasing from 10%to 60% and 90%WHC,respectively.
As shown in Fig.1a,the bacterial Shannon index values after 1-and 4-DRW under 10%—60% WHC were significantly lower(P<0.05)than those under constant 60% and 10%WHC.Under 10%—90%WHC after 1-and 4-DRW,the bacterial Shannon index values were significantly lower(P<0.05)than those under constant 10%WHC.The bacterial Shannon index values under constant 10%and 60% WHC were higher (P< 0.05) than those under constant 90%WHC after 1-and 4-DRW.As shown in Fig.1c,the bacterial Chao 1 values under 10%—60% and 10%—90%WHC after 1-DRW were significantly lower (P< 0.05) than those under constant 10%, 60% , and 90% WHC.The bacterial Chao 1 showed an obvious declining trend(P<0.05)from constant 10%to 90%WHC.Comparatively,after 4-DRW,the bacterial Chao 1 values under constant 10%,60% ,and 90%WHC were significantly higher(P<0.05)than those under 10%—60% and 10%—90%WHC.In addition,the Chao 1 value after 4-DRW was significantly higher(P<0.05)than that after 1-DRW under constant 90%WHC.As shown in Fig.1b, the fungal Shannon index under constant 10%WHC after 4-DRW was higher(P<0.05)than that under constant 90%WHC.As shown in Fig.1d,the fungal Chao 1 value under 10%—60% WHC after 1-DRW was significantly lower(P<0.05)than that under constant 10%WHC.In addition,the fungal Chao 1 value was the highest(P<0.05)under constant 10%WHC after 4-DRW.
Different responses of soil microbial community
The PCoA results showed that the bacterial communities under constant soil moistures after 1-or 4-DRW were more significantly distinguished compared with the fungal communities(Fig.2).As shown in Figs.3 and S1(see Supplementary Material for Fig.S1),the phyla Actinobacteriota,Proteobacteria, Chloroflexi, Acidobacteriota, Firmicutes,Gemmatimonadota, Bacteroidota, and Myxococcota accounted for over 94% of the total bacterial relative abundance under different soil moisture conditions.The relative abundances of Actinobacteriota and Proteobacteria were the highest under constant 90%WHC after 1-DRW,and were significantly higher(P<0.05)than those under 10%—90%and 10%—60% WHC, respectively, which had the second highest corresponding relative abundance(Fig.3).Proteobacteria and Actinobacteriota were the least abundant(P<0.05)under constant 60% and 10%WHC conditions.However,after 4-DRW,the relative abundance of Actinobacteriota was higher under constant 90%and 10%WHC,while that of Proteobacteria was higher(P<0.05)under constant 90%,10%—60% ,and 10%—90%WHC than under other soil moistures.The relative abundance of Chloroflexi was the lowest under constant 90%WHC after 1-and 4-DRW.In contrast,the relative abundances of Acidobacteriota under constant 90% and 10%—90% WHC were significantly lower (P<0.05)than those under other soil moistures after 1-DRW.As shown in Fig.S2(see Supplementary Material for Fig.S2),the variations in Actinobacteriota and Proteobacteria at the family level were specifically linked to Geodermatophilaceae and Beijerinckiaceae.
The top three fungal phyla contributed to more than 99%of the total abundance,including Ascomycota,Mortierellomycota,and Basidiomycota(Figs.3 and S1).As shown in Fig.3,Ascomycota was abundant under constant soil moisture conditions and Mortierellomycota was abundant(P<0.05)after 4-DRW.As shown in Fig.S3(see Supplementary Material for Fig.S3), the variation in Ascomycota after 1-DRW at the family level was linked to Ascodesmidaceae,Microascaceae,Clavicipitaceae,and Nectriaceae.
Cooccurrence networks

Fig.2 Principal coordinate(PCo)analysis of bacteria(a)and fungi(b)under different soil moisture conditions after one and four drying-rewetting(DRW)cycles(1-and 4-DRW,respectively).WHC=water-holding capacity.10%—60% and 10%—90%WHC indicate DRW intensities increasing from 10%to 60% and 90%WHC,respectively.
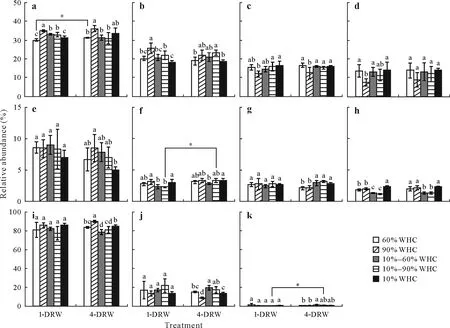
Fig.3 Relative abundances of dominant bacterial(a—h)and fungal(i—k)phyla under different soil moisture conditions after one and four drying-rewetting(DRW) cycles (1- and 4-DRW, respectively).The dominant bacteria are Actinobacteriota (a), Proteobacteria (b), Chloroflexi (c), Acidobacteriota (d),Firmicutes (e), Gemmatimonadota (f), Bacteroidota (g), and Myxococcota (h) and the dominant fungi are Ascomycota (i), Mortierellomycota (j), and Basidiomycota(k).The vertical bars represent the standard deviations of the means(n=3).Bars with the same letter(s)for 1-or 4-DRW indicate significant differences at P <0.05.Asterisks(∗)indicate significant differences between 1-and 4-DRW under the same soil moistures at P <0.05.WHC=waterholding capacity.10%—60% and 10%—90%WHC indicate DRW intensities increasing from 10%to 60% and 90%WHC,respectively.
As shown in Fig.4 and Table SIII(see Supplementary Material for Table SIII),the cooccurrence network of bacteria had 89.88%more nodes than that of fungi.The total edges of the network for bacteria and fungi were 971 and 133,respectively,with positive edges accounting for 64.88%and 93.23%,respectively.The average degree,average weighted degree,density,and average clustering coefficient were higher for bacteria,whereas the diameter,average path length,and modularity were higher for fungi.Furthermore, the modularity of the microbial network(top four modules)is also shown in Fig.4b, d, revealing the population prosperity or demise of highly interconnected clusters within each module and the underlying distinct characteristics of interactions among bacterial or fungal taxa under DRW treatment.Modules were highly interconnected network regions with fewer node connections outside the module than inside.Microbial taxa exhibited strong interactions with each other and shared common ecological functions in the same module.For instance,the bacterial taxa belonging to Module VI were predominant by Actinobacteriota(44.68%),Chloroflexi(27.66%), and Proteobacteria(14.89%), most of which were classified as copiotrophs.The fungal taxa belonging to Module I were predominant by Ascomycota(75.00%)and Mortierellomycota(14.29%).
Different responses of soil microbial respiration,MBC,and EOC
As shown in Figs.5 and S4(see Supplementary Material for Fig.S4),soil respiration rate under constant 10%WHC was limited,with CO2emission rate of about 0.09 mg CO2-C kg-1soil d-1.An overall declining trend was observed for the respiration rates under constant 60% and 90% WHC conditions across the whole incubation time.Specifically,under constant 60% WHC, the respiration rate increased from 1.89 to 2.08 mg CO2-C kg-1soil d-1after 5 d,with no obvious significance (P> 0.05), and then decreased significantly (P< 0.05) over the first 20 d.In contrast,the respiration rate under constant 90% WHC increased significantly from 1.07 to 1.38 mg CO2-C kg-1soil d-1after 5 d and then declined significantly(P<0.05)to about 0.40 mg CO2-C kg-1soil d-1over the first 20 d.A relatively flat respiration rate appeared between 20 and 28 d under constant 60% and 90% WHC.Upon rewetting from 10%to 60% WHC,the respiration rate immediately enhanced to 3.07,1.91,1.31,and 1.36 mg CO2-C kg-1soil d-1after 7,14,21,and 28 d,respectively,of 4-DRW.Moreover,the first rewetting pulse was the largest,with the size of the rewetting pulses declining with the increase in cycle numbers under 10%—60% WHC.In contrast,the respiration rate increased and peaked to approximately 1.40 mg CO2-C kg-1soil d-1upon rewetting from 10%to 90%WHC.

Fig.5 Respiration rates and cumulative CO2 emissions under different soil moistures after four drying-rewetting cycles.Vertical bars represent the standard deviations of the means(n=3).WHC=water-holding capacity.10%—60% and 10%—90%WHC indicate DRW intensities increasing from 10%to 60% and 90%WHC,respectively.
The cumulative CO2emissions decreased in the order of 60% WHC>10%—60% WHC>90%WHC>10%—90%WHC>10%WHC after 4-DRW(Fig.5).Cumulative CO2emissions increased steadily under constant moisture conditions.In the DRW treatments, the cumulative CO2emissions increased with each rewetting.As shown in Fig.S5(see Supplementary Material for Fig.S5),the direct C release under 10%—60% WHC was 6.52 mg CO2-C kg-1soil,which was significantly larger (P< 0.05) than 1.38 mg CO2-C kg-1soil under 10%—90%WHC.
As shown in Fig.S6(see Supplementary Material for Fig.S6),the amounts of MBC under 10%—60% and 10%—90% WHC after 4-DRW were significantly lower (P<0.05)than those under constant 60% and 90%WHC,but higher than that under constant 10%WHC.In addition,the amounts of EOC under 10%—60% and 10%—90% WHC were lower(P<0.05)than that under constant 90%WHC.As shown in Table I,the cumulative CO2emissions after 4-DRW were significantly positively correlated with MBC and significantly negatively correlated with fungal Chao 1.

TABLE I Pearson correlation coefficients between soil properties and cumulative CO2 emissions after four drying-rewetting cycles
DISCUSSION
Effect of DRW on microbial communities
Microorganisms must acclimate to DRW cycles during the drying period by altering their allocation of resources from active to survival pathways(Schimelet al.,2007).The first hypothesis that bacteria were significantly affected by a high wetting intensity was not supported.The bacterial diversity and richness under 10%—90%and 10%—60% WHC were similar and lower than those under the corresponding constant 10%,90%,and 60% WHC,suggesting that DRW history imposed a similar negative effect on bacterial richness and diversity.This has also been indicated in a previous study that bacteria are more rapidly affected by the physiological stress imposed from drought through favoring the typical microbial communities with a strong adaptive capability to the physiological stress(Preeceet al., 2019).The highest bacterial richness and diversity were observed under constant 10% WHC, which may be due to the presence of more disconnected niches under dry conditions (Li H Qet al.,2021).Moreover,the bacterial richness showed no difference among constant 10%,60% ,and 90%WHC after 4-DRW.This may be attributed to bacteria being sensitive to moisture and slowly adapting to wetting or drying conditions under multiple cycles (Preeceet al., 2019; Jiaoet al., 2021).In addition, the diversity and richness were higher under constant 60% WHC than under constant 90%WHC after 1-DRW,proving that the over-moisture conditions did not contribute to or even inhibited a further increase in bacterial richness and diversity(McHugh and Schwartz,2016).
No obvious differences were observed between the microbial communities after 1-and 4-DRW.The first hypothesis that the change in microbial communities after 1-DRW was significantly different from that after 4-DRW was not supported.For microbial adaption to water stress after 1-DRW,different patterns were exhibited for different phyla.The phylum Actinobacteriota was the most dominant bacteria under different moisture conditions and responded quickly to the increase in moisture.This is because Actinobacteriota are Gram-positive bacteria with the ability to form spores;they tend to remain active under dry conditions and cease their activity under prolonged dryness to enable resistance to drought conditions(Manzoniet al.,2012;Nguyenet al.,2018).Similarly,Chloroflexi and Acidobacteriota were also resistant to dry conditions,which is in line with earlier findings(Leeet al.,2018).It must be noted that Acidobacteriota are well adaptable to different physiological and ecological environments (Singhet al., 2007; Jiaoet al., 2021).Additionally, Proteobacteria exhibited low abundance under constant 10% WHC and high abundance under constant 90%and 10%—90%WHC.Being Gram-negative bacteria,Proteobacteria with fast-growing copiotrophs are considered to respond positively to moisture and be susceptible to water limitation(Placellaet al.,2012;Banerjeeet al.,2016).Similar to Proteobacteria, Firmicutes are also prevalent under wet conditions,which has been verified in related research(Jiaoet al.,2021).High abundance was mainly driven by the abundance of Sphingomonadaceae,Beijerinckiaceae,and Clostridiaceae at the family level.Myxococcota abundance was high under constant 10% WHC, which may be due to their predatory behavior and survival ability under dry conditions(Waiteet al.,2020).
Conversely,DRW treatments exhibited no obvious effect on fungal richness,diversity,and communities,which may be related to the fact that fungi prefer hyphae for nutrition (Kaisermannet al., 2013).The PCoA results also indicated that bacterial communities were separated under different DRW treatments, but fungal communities clustered under different soil moisture levels.Thus, our first hypothesis that fungi were more resistant than bacteria was supported.Previous studies have revealed that fungi can adapt better to nutrient-limited and drying stress conditions(McHughet al., 2014).After 1-DRW, the highest fungal richness was observed under constant 10% WHC.After 4-DRW, fungal richness was even higher than that after 1-DRW,suggesting that some fungi continued to grow under low moisture conditions(Guenetet al.,2012).Fungal communities are generally considered to be more tolerant to soil water stress than bacterial communities because of their ability to accumulate osmoregulatory solutes that do not impair metabolism and their filamentous structure(Manzoniet al.,2012;Canariniet al.,2017).Furthermore,fungi may use C sources more efficiently to respire and adapt better under low moisture conditions(Guenetet al.,2012).
Alternatively,the bacterial cooccurrence network was much more complex than that of fungi for a higher average degree,suggesting that bacteria had a greater potential for interactions and niche-sharing (Shiet al., 2016; Xiongetal.,2021).Considering the number of edges,we found predominantly positive edges in bacteria and fungi,indicating that both bacteria and fungi exhibited cooperative rather than competitive relationships(Oliveiraet al.,2014).Moreover,the diameter and average path length were lower in bacteria than in fungi, indicating that bacteria were more easily affected by DRW(Zhouet al.,2010).A high cooccurrence network density was also observed for bacteria, revealing that bacteria can undergo rapid recolonization following DRW disturbance (Bissettet al., 2013).Modularity may act to retain the effect of disturbances within compartments(Kokkoriset al.,2002)and is also favored as an adaptation to short-rather than long-term disturbances(Bissettet al.,2013).
Effect of DRW on microbial respiration
Our results showed that the microbial respiration rate declined across the entire incubation period, which was largely due to the decrease in labile substrates in the later time(Orchard and Cook,1983).The finding that the respiration rate decreased in the order of 60% WHC>90%WHC>10%WHC was supported by the fact that the increase in moisture would elevate the diffusion of substrates and stimulate the activity of microbes;however,excessive moisture may inhibit oxygen availability in soil organic C mineralization(Zhanget al.,2020;Li Y Het al.,2021).Under constant 10%WHC,the lower moisture condition prevented the movement of organic C,leading to lower microbial activity and respiration rate(Liet al.,2018;Jiaoet al.,2021).Additionally,DRW induced pulsed CO2emissions under both 10%—60% and 10%—90%WHC;similar results have been widely observed in laboratory incubation experiments and field observations(Wu and Brookes,2005;Muhret al.,2008,2010;Peregrina,2016).Such a sudden increase in respiration rate could be explained by the increased availability of substrates and the recovery of microbial community(Liet al.,2018).Positive correlations were observed between MBC and CO2release(Kieftet al.,1987;Casalset al.,2011;Warren,2014),supporting our second hypothesis.Previous studies have also shown that DRW treatment may lead to the death of some microbial species and cell bursting under low water content condition, which results in cell lysis and the release of substrates for future microbial mineralization(Borken and Matzner,2009).
In particular,the peak of the respiration rate pulse decreased as the number of DRW cycles increased under 10%—60% WHC,while the respiration rate pulses were similar in different numbers of cycles under 10%—90%WHC.Upon rewetting to 60% WHC,the rapid growth and enhanced activity of the surviving microbes,especially bacteria,resulted in rapid consumption of the soluble C source that accumulated during the drying period and a consequent increase in CO2emissions(Birch,1959;Fierer and Schimel,2003).Comparatively, the peak record under 10%—90%WHC was lower than that under 10%—60% WHC, which may also be due to the negligible contribution to or even inhibition of microbial activity by excessive moisture(McHugh and Schwartz,2016).However,the respiration rate was similar after each DRW cycle under 10%—90%WHC,which may also be related to the remaining labile substrates after the early cycle(Orchard and Cook,1983).
The difference in soil cumulative CO2emissions between constant 60% and 10%—60% WHC was larger than that between constant 90%and 10%—90%WHC.This result was consistent with the results reported by Singhet al.(2021),but did not support our second hypothesis that the degree of C loss was greater under higher wetting intensity in DRW treatment.This inhibitory effect on soil respiration under over-moisture conditions was probably ascribed to the sandy texture of the soil samples.Sandy soil was found to be characterized by a generally high proportion of macropores, resulting in a weak moisture retention ability,limited accessible water for microbial growth,and the consequent lower respiration under over-moisture conditions(Singhet al.,2021).In addition,the rapid collapse of soil block and clogging of soil cracks formed during the previous drying phase occurred as the soils were rewetted,which would limit the oxygen content and inhibit the activity of microorganisms for respiration(Donget al., 2021).This may be another reason for the lower cumulative CO2emissions under 10%—90%WHC compared to that under 10%—60% WHC.In addition, the respiration rate was very low during the drying period(e.g.,under 10%WHC),and the rewetting of dry soil(e.g.,10%—60% and 10%—90%WHC)led to an abrupt increase in soil respiration rate, of which the peak value was even higher than that under the corresponding constant target moistures(e.g.,60% and 90%WHC).Despite this,the cumulative CO2emissions under 10%—60% and 10%—90%WHC were still lower than those under the respective constant 60% and 90%WHC.This was also correlated with the low organic C levels on the Loess Plateau and decreased bacterial diversity in our study(Canariniet al.,2017;Donet al.,2017).Therefore,this phenomenon revealed that the DRW with different wetting intensities promoted a short-term increase in respiration rate but induced an overall decrease in soil CO2emissions(Muhret al.,2010;Liet al.,2018).
CONCLUSIONS
The number and intensity of DRW cycles are a growing threat to C cycling on the Loess Plateau,and we have demonstrated the complex effects of the number and intensity of DRW cycles on microbial communities and respiration.The DRW treatments decreased bacterial diversity and influenced bacterial communities more than those of fungi;the bacterial network was more complex than that of fungi.No obvious difference was observed in the effect of the number of DRW cycles on the microbial diversity and communities.Moreover, DRW cycles could reduce the overall C loss,and the reduction in C loss was greater under DRW with a lower wetting intensity.Microbial biomass C was positively correlated with cumulative CO2loss.Our results provided essential information to estimate how microbial communities and respiration were driven by different soil moisture levels,which will help us better predict how microbes and C cycling change in soil on the Loess Plateau under changing climate conditions.
ACKNOWLEDGEMENT
This work was supported by the Provincial Natural Science Foundation of Hunan, China (No.2020JJ4429),the Open Fund of the State Key Laboratory of Soil Erosion and Dryland Farming on the Loess Plateau of China(No.A314021402-202101),and the Hundred-Talent Project of Chinese Academy of Sciences(No.A315021407).
SUPPLEMENTARY MATERIAL
Supplementary material for this article can be found in the online version.
CONTRIBUTION OFAUTHORS
Panpan JIAO and Haibing XIAO contributed equally to this study and share the co-first authorship.
杂志排行
Pedosphere的其它文章
- Pedotransfer functions for predicting bulk density of coastal soils in East China
- Low soil C:N ratio results in accumulation and leaching of nitrite and nitrate in agricultural soils under heavy rainfall
- Free-living nematode community structure and distribution within vineyard soil aggregates under conventional and organic management practices
- Effects of rhamnolipids on bacterial communities in a dioxin-contaminated soil and the gut of earthworms added to the soil
- Biochar reduces uptake and accumulation of polycyclic aromatic hydrocarbons(PAHs)in winter wheat on a PAH-contaminated soil
- Environmental similarity is more important than distance in the community structuring processes of ammonia-oxidizing archaea in agricultural soils