Pedotransfer functions for predicting bulk density of coastal soils in East China
2023-12-21GuanghuiZHENGCaixiaJIAOXianliXIEXuefengCUIGangSHANGChengyiZHAOandRongZENG
Guanghui ZHENG,Caixia JIAOXianli XIE,Xuefeng CUI,Gang SHANG,Chengyi ZHAO and Rong ZENG
1School of Geographic Sciences,Nanjing Universityof Information Science&Technology,Nanjing 210044(China)
2Meteorologyand Climate Centre,School of Mathematics and Statistics,UniversityCollege Dublin,Belfield,Dublin 4(Ireland)
3Institute of Soil Science,Chinese Academyof Science,Nanjing 210008(China)
4School of Systems Science,Beijing Normal University,Beijing 100875(China)
ABSTRACT Soil bulk density(BD)is an important physical property and an essential factor for weight-to-volume conversion.However,BD is often missing from soil databases because its direct measurement is labor-intensive,time-consuming,and sometimes impractical,particularly on a large scale.Therefore,pedotransfer functions(PTFs)have been developed over several decades to predict BD.Here,six previously revised PTFs(including five basic functions and stepwise multiple linear regression(SMLR))and two new PTFs,partial least squares regression(PLSR)and support vector machine regression(SVMR),were used to develop BD-predicting PTFs for coastal soils in East China.Predictor variables included soil organic carbon(SOC)and particle size distribution(PSD).To compare the robustness and reliability of the PTFs used,the calibration and prediction processes were performed 1 000 times using the calibration and validation sets divided by a random sampling algorithm.The results showed that SOC was the most important predictor,and the revised PTFs performed reasonably although only SOC was included.The PSD data were useful for a better prediction of BD,and sand and clay fractions were the second and third most important properties for predicting BD.Compared to the other PTFs,the PLSR was shown to be slightly better for the study area(the average adjusted coefficient of determination for prediction was 0.581).These results suggest that PLSR with SOC and PSD data can be used to fill in the missing BD data in coastal soil databases and provide important information to estimate coastal carbon storage,which will further improve our understanding of sea-land interactions under the conditions of ongoing global warming.
Key Words: partial least squares regression,particle size distribution,soil organic carbon,stepwise multiple linear regression,support vector machine regression
INTRODUCTION
Soil carbon is of great importance to global climate change and food security(Lal,2004).Therefore,many studies have estimated and monitored soil carbon stocks in recent years(Taoet al.,2019;Yanget al.,2022).Soil bulk density(BD),defined as the mass of an oven-dry undisturbed soil sample divided by the bulk volume, is an important factor for assessing soil carbon stocks(Holmeset al.,2011).In addition,BD is an indicator of soil compaction,porosity,quality, and productivity (Reichertet al., 2009; Sequeiraet al.,2014)and an input parameter for modeling soil processes(Heuscheret al.,2005).
However,BD is often absent in soil databases,mainly because direct measurement is time-consuming,laborious,and often impractical,especially on a large scale.Therefore,pedotransfer functions(PTFs)were used to estimate BD,as conceptualized by Bouma(1989).The PTFs are defined as predictive functions for certain soil properties,using other readily or inexpensively measured properties as predictor variables (McBratneyet al., 2002).Previous studies have shown that common soil properties, such as soil organic carbon(SOC)and particle size distribution(PSD),are very important properties for development of PTFs(Hanet al.,2012;Nankoet al.,2014;Ramcharanet al.,2017;Chenet al.,2018).Recent studies have revealed that better functions were obtained when soil PSD parameters were added as predictors(Sevastaset al.,2018).
The methods developed for determining PTFs have varied from basic linear/nonlinear regression methods to powerful data mining models potentialized by the development of computers and machine learning algorithms.Simple/multiple linear regression models have been used frequently(Heuscheret al.,2005;Beniteset al.,2007;Holliset al.,2012)and are now commonly used for comparison with the newer mining methods(Martínet al.,2017;Bondiet al.,2018;Qiaoet al.,2019).Some data mining methods,including artificial neural networks(ANNs)(Minasnyet al.,1999;Tranteret al.,2007;Yiet al.,2016),boosted regression tree(Ghehiet al.,2012),random forests(Ramcharanet al.,2017;Shiriet al.,2017;Katuwalet al., 2020),k-nearest neighbor (Nemeset al.,2010;Ghehiet al.,2012;Botulaet al.,2015),and support vector machine(Shiriet al.,2017),have been widely used to calibrate PTFs in recent years.Most studies suggest that novel statistical methods can accurately estimate BD(Al-Qinna and Jaber,2013;Yiet al.,2016).Therefore,it is important to search for data mining models by improving the accuracy and reliability of PTFs(Wöstenet al.,2001;Martinet al.,2009).However,some studies have indicated that complex calibration methods do not enhance model accuracy relative to simple regression methods(Minasnyet al.,1999;Tranteret al.,2007;Ghehiet al.,2012;Wanget al.,2014;Qiaoet al.,2019).Furthermore,PTFs are site-specific and difficult to use in other geomorphic regions or soil types(McBratneyet al.,2002;De Voset al.,2005).Therefore,it is worthwhile to investigate efficient modeling methods and region-specific PTFs(Nastaet al.,2020;Palladinoet al.,2022).
The effectiveness and performance of regression relies heavily on the calibration set,regardless of the calibration method used(Lucàet al.,2017).Therefore,some data division methods,such as the conditioned Latin hypercube and Kennard-Stone(KS)algorithms, have been used to select representative datasets(Gogéet al.,2014;Ramirez-Lopezet al.,2014).Unlike these algorithms,random sampling can reveal the sensitivity of modeling performance to data division by using randomly repeated data splitting,calibration,and validation.Therefore,the robustness and reliability of certain methods can be compared.
Coastal soils in Jiangsu Province,China were developed during shoreline promotion for nearly a thousand years and have some unique characteristics.Therefore,our objectives were:1)to develop PTFs for predicting BD using SOC and PSD data based on six previously revised PTFs(including five basic functions and stepwise multiple linear regression(SMLR))and two new PTFs,partial least squares regression(PLSR) and support vector machine regression (SVMR),1 000 times using randomly sampled datasets,2)to investigate the importance of four predictor variables,SOC,clay,silt,and sand,and 3)to evaluate the predictive performance of these PTFs and select the best modeling methods for the study area.The results of this study will lay the foundation for estimating and monitoring SOC stocks to achieve carbon neutrality targets.
MATERIALS AND METHODS
Soil sampling and determining
The coastal soils in northern Jiangsu Province, China have derived from fluvial sediments transported by the Yangtze River and Yellow River over the past 1 000 years(Fig.1a).The region has a mean annual temperature and precipitation of 14.6◦C and 1 042.3 mm, respectively.Thirty-two soil pits were located on the coastal plain(Fig.1b).Ten soil samples were collected at the following specific depth intervals from each profile:0—5,5—10,10—15,15—20,20—30,30—40, 40—50, 50—60, 60—80, and 80—100 cm (Fig.1c).A total of 320 soil samples were collected for laboratory analysis.Samples for SOC and PSD measurements were collected from the entire specific soil layers,while those for BD determination were collected at the center of each layer using a steel cylinder(100 cm3in volume).
Soil samples for BD measurement were oven-dried at 105◦C for 48 h and then weighed(ISO,2017).These profiles contain few rock fragments because the parent material is basically river sediment.Therefore,the following equation was used to calculate the BD:

Fig.1 Location of the study area in northern Jiangsu Province,China(a),distributions of sampled soil profiles(b),and sampling intervals within each profile(c).
wheremt(g) is the total mass of the cylinder and soil sample,ms(g) is the mass of the empty cylinder, andV(cm3) is the volume of the sample holder.Particle size distribution was measured using a laser diffraction method(LS 13320)(Beckman Coulter,2011),and texture classes were determined according to the United States Department of Agriculture Classification System(Fig.2).Soil organic carbon was determined using the potassium dichromate external heating method(Lu,2000).

Fig.2 Texture classes of soil samples from the study area according to the United States Department of Agriculture Classification System.1=clay;2=silty clay;3=sandy clay;4=clay loam;5=silty clay loam;6=sandy clay loam;7=loam;8=silty loam;9=sandy loam;10=silt;11=loamy sand;12=sand.
Model establishment and evaluation
In this study,six empirical functions defined in previous researches were calibrated and validated using our data(Table I).Common variables from previous PTFs,including SOC, silt, sand, and clay, were included in the modeling assays.
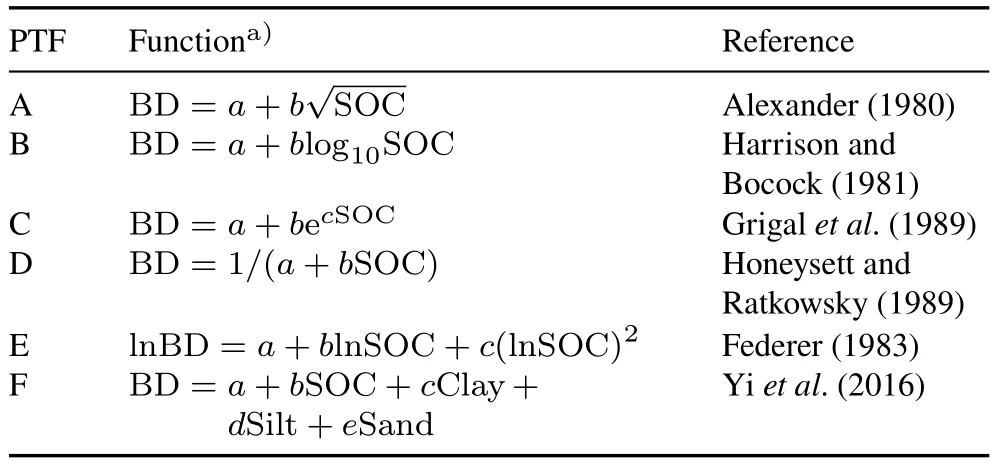
TABLE I Summary of six revised pedotransfer functions(PTFs)defined in previous researches for predicting soil bulk density(BD)
Two additional calibration models,PLSR and SVMR,were used in this study.The PLSR model,developed by Woldet al.(1983), is used to construct predictive models with highly collinear predictive variables(Rossel and Behrens,2010); it effectively excludes unexplainable information and extracts latent variables(LVs),thus ensuring that LVs explain the response variables optimally.The LV number retained in this study was determined based on the least mean squared error produced by cross-validation.Support vector machine is a machine-learning method that has been widely used for regression analysis and classification.This data mining method can solve linear and nonlinear problems due to its strong capability for generalization and its capacity to deal with sparse data(Rao and Gopalakrishna,2009).The calibration and prediction of SVMR were performed using LIBSVM v3.21(Chang and Lin,2011).The epsilon-SVMR algorithm and radial basis function were used for calibration.The cost andγparameters,ranging from 2-10to 210in 20.5increments,were optimized through a systematic grid search method with 5-fold cross-validation by a predefined function(Faruto and Li,2009).
In this study,all predictors(SOC,clay,silt,and sand)and responses (BD) were standardized using thez-score function to avoid the impacts of predictor unit and magnitude.Soil samples(n=320)were randomly split into two sets 1 000 times.The calibration set, containing 70% of the samples(n=224),was used to calibrate the BD-predicting models, meanwhile the prediction set, containing 30% of the samples (n= 96), was used to validate the models.The six revised PTFs,PLSR,and SVMR were conducted 1 000 times using the splitting results.All calibration and validation processes were performed in MATLAB 2013a(MathWorks Inc.,Natick,USA).The results with adjusted coefficients of determination(Adj.R2)for calibration(Adj.R2c) or prediction (Adj.R2p)< 0 were deleted.Statistical analysis was performed on the results with Adj.R2c>0 and Adj.R2p>0.The number of model results with Adj.R2c>0 and Adj.R2p>0 is called the effective number.Subsequently,the frequencies of Adj.R2cand Adj.R2pfor every empirical function and calibration method were computed to compare their robustness and reliability.
The PTFs were evaluated using three performance indicators:root mean square error(RMSE),Adj.R2,and ratio of performance to interquartile distance(RPIQ).These were calculated as follows:
where ˆyiandyiare the predicted and measured BD values for theith observation,respectively, ¯yis the average measured BD of the dataset,nis the total number of observations,R2is the coefficient of determination,kis the total number of independent regressors,Q3andQ1are the third and first quartiles, respectively, and RMSEP is the RMSE for prediction.For an accurate prediction,the RMSE value should be as small as possible and Adj.R2should be near 1.The indicator RPIQ is a better index than the ratio of performance to deviation,as the former overcomes the bias limitation of non-normal population spread by considering the interquartile difference(Bellon-Maurelet al.,2010;McBratney and Minasny,2013;Roudieret al.,2015).
RESULTS
Basic statistics of soil properties
Table II lists the statistics of soil properties determined in this study.The BD values varied from 0.98 to 1.76 g cm-3with a mean of 1.47 g cm-3and a standard deviation(SD)of 0.13 g cm-3.The SOC values ranged between 1.0 and 24.4 g kg-1,with a mean of 4.9 g kg-1,indicating a low SOC content in the soil samples.Mean values of clay,silt,and sand contents were 18.78%,61.91%,and 19.31%,respectively.Soil organic carbon had the largest coefficient of variation (CV = 82.25%) among the determined soil properties,followed by sand content(CV=45.70%).All the kurtosis values were positive.Both BD and silt were negatively skewed,whereas other properties were positively skewed.
Correlation analysis showed a strong negative correlation between SOC content and BD (Table III).Sand content showed a moderate negative correlation with BD,whereas clay and silt contents were positively correlated with BD.There were significant correlations between SOC,sand,andclay contents,suggesting multicollinearity among these soil properties.Therefore, it is better to extract the principal components or LVs for BD calibration.

TABLE II Descriptive statisticsa) of soil propertiesb) determined in this study

TABLE III Correlation coefficients between soil bulk density(BD)and other properties
Performance of previous revised PTFs
The means of calibration and prediction results for the six revised PTFs are shown in Table IV,and the frequencies for Adj.R2cand Adj.R2pare shown in Fig.3.Average Adj.R2cand Adj.R2pvalues for PTFs A—F ranged from 0.080 to 0.607 and from 0.112 to 0.570,respectively(Table IV).Pedotransfer function F gave the best average Adj.R2cand Adj.R2pvalues,with 0.607 and 0.570, respectively.The effective number for PTFs E and F was 1 000.The frequencies of Adj.R2showed that most Adj.R2cand Adj.R2pwere greater than 0.55 for PTF F(i.e.,SMLR)and less than 0.55 for PTFs A—E(Fig.3).These results suggested that soil PSD contained certain information on BD,and a better model performance was obtained when PSD data were considered together with SOC data.

TABLE IV Means of soil bulk density prediction and calibration resultsa) of the six revised pedotransfer functions (PTFs)b) in previous researches and two new PTFs,i.e.,partial least squares regression(PLSR)and support vector machine regression(SVMR)
The regression coefficients of each calibration for SMLR are shown in Fig.S1(see Supplementary Material for Fig.S1)and Table V shows the descriptive statistics for regression coefficients,which underline the importance of the predictor variables in the models.The regression coefficients of SOC were higher than those of the other soil variables studied,indicating that SOC was more important than the other variables for predicting BD.The regression coefficients of SOC were negative, indicating a negative correlation between SOC and BD.The second most important variable was sand content,followed by clay content,while silt content was the least important.The CVs of regression coefficients for silt and clay contents were higher because the means of regression coefficients for silt and clay contents were smaller.In many cases,the regression coefficients of silt and clay contents were zero,and only SOC and sand contents were included in SMLR(Table V,Fig.S1),indicating the importance of SOC and sand contents for BD prediction.
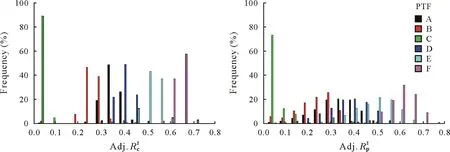
Fig.3 Frequencies for adjusted coefficients of determination for calibration(Adj.R2c)and prediction(Adj.R2p)for six revised pedotransfer functions(PTFs)used for soil bulk density prediction in previous researches.See Table I for the detailed descriptions of the six revised PTFs A—F.

TABLE V Descriptive statisticsa) for regression coefficients of stepwise multiple linear regression(SMLR)and partial least squares regression(PLSR)used for soil bulk density prediction with soil organic C(SOC)and particle size distribution as predictor variables
Performance of PLSR and SVMR for new PTFs
The average Adj.R2cvalues were 0.610 and 0.686 for PLSR and SVMR,respectively,and were greater than those of the previously revised PTFs(Table IV,Figs.3 and 4).The calibration result of SVMR(average Adj.R2c=0.686)was the best among PLSR,SVMR,and SMLR(Table VI).The prediction results of PLSR and SVMR were similar(same average Adj.R2pand similar RPIQ)and slightly better than those of SMLR (Table VI).However, the CV for average Adj.R2pof SMLR was the smallest, which suggests that the prediction results of SMLR were relatively more stable within the set of 1 000 predictions performed.These results showed that similar results were obtained with the three methods tested;furthermore,they suggested that complex calibration methods,such as PLSR and SVMR,did not significantly improve model performance relative to simpler techniques.
The descriptive statistics of regression coefficients for SOC and PSD data in PLSR are shown in Table V and Fig.S2(see Supplementary Material for Fig.S2).Soil organic carbon was the most important property for BD prediction,and the regression coefficients were negative, as were the results of SMLR.Clay and sand contents were the second most important properties for BD prediction,and silt content was the least important.This order of importance was similar to the correlations between BD and PSD(Table III).
DISCUSSION
Comparison of modeling methods

Fig.4 Frequencies for adjusted coefficients of determination for calibration(Adj.R2c)and prediction(Adj.R2p)of partial least squares regression(PLSR)and support vector machine regression(SVMR)used for soil bulk density prediction.

TABLE VI Descriptive statisticsa)for adjusted coefficients of determination for calibration(Adj.R2c)and prediction(Adj.R2p)of partial least squares regression(PLSR),support vector machine regression(SVMR),and stepwise multiple linear regression(SMLR)used for soil bulk density prediction
Our results indicated that modeling performance increased as the number of predictors increased,and the three modeling methods,PLSR,SVMR,and SMLR,performed similarly, suggesting that the machine algorithm did not significantly enhance prediction performance in this study.Artificial neural network has been the most widely used machine algorithm in PTF studies.Schillaciet al.(2021)showed that ANN outperformed SMLR.However,the results of ANN have not always been more accurate than those obtained using other methods(Minasnyet al.,1999;Tranteret al.,2007),and their interpretations have often been difficult and subjective(Yiet al.,2016).For these reasons,an ANN was not used in this study.The machine algorithm SVMR did not generate more accurate prediction results than PLSR or SMLR in this study.Particularly,PLSR extracts LVs from the predictors,thus,most information in SOC and PSD related to BD can be saved in these new variables, which should be promising for good performance.Indeed,PLSR showed slightly better results than SMLR(Table VI).Compared with SVMR,PLSR can provide a specific model and regression coefficients,which can be used for importance analysis of predictors.To the best of our knowledge,few studies have compared PLSR with other methods(Al-Qinna and Jaber,2013;Sevastaset al.,2018),and their results showed that PLSR did not compete well with SMLR,an observation that markedly differs from the results of this study.This can be attributed to two factors.The first is the difference between the datasets.A great difference between soil properties,such as BD, SOC, and PSD, may result in different optimum calibration methods for different areas.Secondly,the data should be standardized before PLSR calibration.The units and orders of magnitude were not the same between SOC and PSD,which may affect the regression coefficients.
Importance of predictor variables
According to the regression coefficients(Figs.S1 and S2),SOC was the most important variable for predicting BD,which is in line with the results of previous studies(Heuscheret al.,2005;Suusteret al.,2011;Ramcharanet al.,2017;Shiriet al.,2017;Chenet al.,2018).The regression(Figs.S1 and S2)and correlation coefficients(Table III)indicated a strong negative correlation between SOC and BD,most likely because the increase in SOC content at low density enhanced soil total porosity, leading to a decrease in BD(De Voset al., 2005; Tranteret al., 2007; Al-Qinna and Jaber,2013).Therefore,as stated by Ghehiet al.(2012)and Chenet al.(2018), PTFs that use SOC as a predictor are appropriate and may be an auxiliary method for incomplete databases.Thus,in this study,model E generated reasonable prediction results using SOC as a predictor(Table IV).
The importance of clay,silt,and sand contents varied in previous studies.Chenet al.(2018) stated that, except for SOC,clay content was the most important soil property,followed by sand content.Katuwalet al.(2020)also showed that SOC and clay contents were the most important variables in SMLR.In contrast,Ramcharanet al.(2017)found that sand content was more important than clay content in their model.Al-Qinna and Jaber (2013) showed that sand and SOC contents were important,whereas the effects of clay and silt contents on BD were almost negligible.In our study,sand content was more important than clay content in SMLR(Table V,Fig.S1)and PLSR(Table V,Fig.S2).Furthermore,the regression coefficients of sand content were negative and those of clay content were positive for both SMLR and PLSR(Table V),which were in agreement with the relationships of sand and clay contents with BD(Table III).
Data splitting methods
The significant variation in Adj.R2for calibration and prediction(Figs.3 and 4)indicated a strong influence of data splitting on model performance,as reported by some recent studies (Ramirez-Lopezet al., 2014; Lucàet al., 2017).Accordingly,it is necessary to select optimal data splitting methods.Otherwise,erroneous conclusions can be drawn using one or more random partitions.Numerous data splitting methods exist for systematically partitioning available data into statistically representative subsets, including the KS algorithm andk-means clustering(Daszykowskiet al.,2002;Nget al., 2018).However, systematic sampling methods,such as the KS algorithm, do not always provide a better estimation(Xu and Goodacre,2018).Lucàet al.(2017)emphasized that representative datasets should be selected based on either the dependent or the independent variable,or both.Therefore,Xu and Goodacre(2018)concluded that the method to split data and the parameters to be used could not be decideda prioriand would depend on the data.Chenet al.(2022)recommended repeated random sampling ork-fold cross-validation for a robust validation of modeling results,particularly for a small dataset.In our study,the method of random data splitting multiple times provided results under different datasets and was useful for comparing the stability of modeling methods.However,the order of importance of predictors did not clearly change with the change in model performance after 1 000 calibration runs(Figs.S1 and S2).Further studies are required to investigate the characteristics of the sample sets with better modeling performance.
CONCLUSIONS
In this study,six previously revised PTFs and two new PTFs,PLSR and SVMR,were developed for soil BD prediction using 1 000 random data splitting sets.The descriptive statistics and frequencies of Adj.R2were used to evaluate model accuracy and stability.The results revealed that SOC was the most important predictor of BD, and reasonable performance was obtained when only SOC was considered in the PTFs.The second and third most important predictors were sand and clay contents,respectively.Moreover, more predictors and advanced calibration methods resulted in a better performance for BD PTFs.Compared to the other PTFs,PLSR produced slightly stronger predictions for BD in the soils of coastal areas.Our study provides important information to facilitate coastal carbon storage estimation, which will further improve our understanding of sea-land interactions under the conditions of the ongoing global climate change.
ACKNOWLEDGEMENTS
This study was supported by the National Natural Science Foundation of China(Nos.41877004 and 42130405)and the China Scholarship Council (Nos.201809040007 and 201808320124).We are grateful to Mr.Dongfeng Chen from the Institute of Soil Science, Chinese Academy of Sciences and Mr.Qingjie Zhang from Nanjing University of Information Science&Technology,China for their assistance during the field sampling work.We are equally grateful to Mr.Yu Guo,Mr.Yuanfang Li,Mr.Xiaoyue Fu,Mr.Jiapeng Zhang, and Mr.Jichen Wei from Nanjing University of Information Science & Technology, China for their help during soil bulk density determination.
SUPPLEMENTARY MATERIAL
Supplementary material for this article can be found in the online version.
杂志排行

Pedosphere的其它文章
- Drying-rewetting cycles reduce bacterial diversity and carbon loss in soil on the Loess Plateau of China
- Low soil C:N ratio results in accumulation and leaching of nitrite and nitrate in agricultural soils under heavy rainfall
- Free-living nematode community structure and distribution within vineyard soil aggregates under conventional and organic management practices
- Effects of rhamnolipids on bacterial communities in a dioxin-contaminated soil and the gut of earthworms added to the soil
- Biochar reduces uptake and accumulation of polycyclic aromatic hydrocarbons(PAHs)in winter wheat on a PAH-contaminated soil
- Environmental similarity is more important than distance in the community structuring processes of ammonia-oxidizing archaea in agricultural soils