Effective algorithmic operational framework for fish texture evaluation in industry: Achieving maturity
2023-10-19DimoginopoulosGrigorkis
D.Dimoginopoulos, K.Grigorkis
a University of West Attica, Department of Industrial Design and Production Engineering, Athens, 12244, Greece
b Hellenic Center for Marine Research, Institute of Marine Biology, Biotechnology & Aquaculture, Anavyssos, Attica, 19013, Greece
Keywords:Texture assessment Freshness evaluation Sea bass Physics-based model Closed-form analytical solution
ABSTRACT Reliable, nondestructive fish freshness evaluation applicable during fish commercialization has been continuously pursued by scientists and industry.Taking into account that fish texture is primarily affected even at early stages of post-mortem storage, a relevant nondestructive testing framework for rapid textural assessment of fish freshness was developed in the past.Herein, an algorithm operating within the aforementioned framework and optimized for use in industrial environments is proposed.Sea bass (Dicentrarchus labrax) both freshly killed and stored on ice for 6 days have been used for comparative testing.The fish is part of a system, which is vibrationtested via a new testing protocol designed for easy implementation and robustness to noise.At the same time, a new closed-form analytical expression for the system response to the specific testing is computed and used along with experimental data, for obtaining specific mechanical (thus muscle-structural) characteristics of fish flesh.This computation is designed to only require readily available routines found in most relevant software.The algorithmic operational framework has been used in two different test setups (a custom-built test rig and a prototype device), with results following remarkably similar trends, clearly discriminating different textural(thus freshness) characteristics, and consequently validating the proposed approach.
1.Introduction
Regardless of the perspective under which the term “fish quality” is defined, freshness is always one of its capital components.Whether quality is defined under the form of the four terms of security, healthiness, satisfaction and serviceability (Listrat et al., 2016), or by the four pillars of freshness, safety, traceability and authentication (Freitas et al.,2020), or even under the narrower scope of a combination of nutritional,microbiological, biochemical, and physicochemical characteristics(Hassoun & Karoui, 2017), freshness is always a major quality determinant; this is due to the highly perishable nature of this food item.
Therefore, besides traditional sensory, microbiological and physicochemical analyses used for describing freshness reduction or spoilage of fish, a large effort has been undertaken in order to develop methods evaluating fish freshness in a rapid way and ideally without destruction of the samples under examination (Cheng et al., 2015; Hassoun; Karoui,2017).These include refractive index techniques, colorimetric or other sensor technologies, such as the electronic nose, gas sensors,semi-conducting metaloxide sensors, or spetroscopy methods, namely infrared - IR or near infrared reflectance - NIR, visible spectroscopy,electrochemical impedance spectroscopy -EIS and fluorescence spectroscopy.These techniques have been comprehensively reviewed in recent literature (Cheng et al., 2015; Hassoun; Karroui, 2017).
Fish texture is one of the first features undergoing post-mortem changes in fish due to the evolution of rigor-mortis even within hours after slaughtering (Huss, 1988, p.134).This makes texture a valuable feature for determining early post-mortem changes even at stages when other feature changes remain unnoticed.However, textural assessments of freshness are mostly exhausted in Texture Profile Analysis-TPA and therefore involve scientific instrumentology and various tests of increased complexity (Hassoun; Karroui, 2017).Some indirect approaches, evaluating texture by means of combination of dynamometric measurements of hardness (Zwick 1.0 Universal Testing Machine,Zwick/Roell Testing System, Kennesaw, GA, USA) with spectrophotometric image analysis have also obtained reliable results in discriminating textural differences based on freshness and origin of fish (Costa et al., 2011).
Along such guidelines, the authors have proposed a nondestructive testing framework for rapid textural assessment of fish freshness, and pursued its development over several years (Grigorakis &Dimogianopoulos, 2010) (Dimogianopoulos & Grigorakis, 2011, 2014,2017).The initial effort (Grigorakis & Dimogianopoulos, 2010) consisted in assessing specific fish mechanical properties related to key physical characteristics (viscoelastisity, springiness and so on) via fault diagnosis principles traditionally applied to mechanical systems.The fish was considered as part of a system including mechanical and electrical components, which was subjected to a step-like externally imposed load.The system response was analyzed for evaluating specific attributes, which were intimately related to fish textural changes.Over the years, effort has been invested in fine-tuning the system’s definition and modelling, initially by using a stochastic modelling framework for accurately evaluating the system response in presence of noise (Dimogianopoulos & Grigorakis, 2011) or for alleviating the influence of fish mass variation on system response (Dimogianopoulos & Grigorakis,2014).Both approaches functioned well in the context of lab experiment practice.In view of the framework’s promising results, effort was subsequently invested in simplifying the experimental and modelling procedure by proposing semi-static (instead of vibration-like) experimental excitation along with delivering a complete closed-form mathematical expression of the system response for this excitation (Dimogianopoulos& Grigorakis, 2017).The aim was to analytically compute both stiffness and viscoelastic textural attributes of the fish and thereby achieve quantitative monitoring of alterations attributable to freshness changes.Again, the approach yielded successful results in lab environment,where measurement noise could be successfully dealt with.Nonetheless,owing to the authors’ participation in EU-funded FutureEUAqua research project, emphasis had shifted towards applying this nondestructive textural assessment framework for use principally within an industrial environment.To this end, further work had to be carried out along two main directions.First, for simplifying the testing protocol and the algorithmic operation of the framework (thus facilitating its implementation), while minimizing the effects of noise in measurements used for fish texture evaluation.Then for developing a prototype device capable of applyingvariousnondestructive methodologies and evaluating the fish texture and freshness.An indicative but not exclusive example are the aforementioned methodologies postulated over the last years.
The aim of the current study is to propose a less restrictive testing protocol along with a simplified algorithmic operation of the nondestructive texture evaluation framework, for achieving robust operation under noisy measurements and delivering results with only basic user intervention in data processing.In other words, the aim is to achieve maturity as far as the framework’s implementation in industrial environments is concerned.The fish is still integrated in a mechanical structure (referred to as system), but most limitations of the testing procedure have now been removed, so that favorable signal-to-noise values for the experimental data may be recordable.At the same time,the development of a new physics-based system model provides an accurate closed-form analytical expression for the system response.Using the latter along with experimental data, one may easily compute specific characteristics of fish flesh related to viscoelasticity, springiness and so on.Doing so, no longer requires specific skills (in stochastic identification, for instance) from the user.The use of conventional curve-fitting routines, found in most relevant software such as MATLAB®, is the main requirement.Lastly, given that a custom-built test rig (developed over the years) was available and that the aforementioned prototype device for texture evaluation is being developed, the validation of the framework in both setups is presented.The paper is organized as follows: In the Introduction, a quick overview of relevant literature along with the current study’s contribution is presented.The section entitled“Materials and Methods” provides details on the tested fish, and a comprehensive analysis of the framework algorithmic operation,namely the testing protocol, the physics-based system model and the closed-form expression of its response to testing.In section “Results and Discussion” results of the application of the framework on six fish of different freshness state are shown and commented upon.
2.Materials and methods
2.1. Fish
Common sea bass (Dicentrarchus labrax) of commercial size was used for the freshness evaluation experiments.Fish originated from the experimental facilities of HCMR (Ag.Kosmas, Attika), reared in a closed recirculated system with cement tanks of 1 m3and fed with a commercial diet.Fish rearing complied with the respective European Union(EU) Council Directive 98/58/EC, concerning the protection of animals kept for farming purposes and the European Commission (EC) recommendation on the welfare of farmed fish.Fish were slaughtered by custom industrial slaughter method of ice-water immersion, thus complying with the recommendations of the Opinion of the Scientific Panel on Animal Health and Welfare (AHAW), on a request from the Commission related to Species-specific welfare aspects of the main systems of stunning and killing of farmed seabass and seabream (European Food Safety Authority, 2009).Fish were slaughtered in two time-intervals within 6 days in order to allow simultaneous availability of freshly killed individuals and individuals stored on ice (0OC) for 6 days.The individual characteristics of the studied fish appear in Table 1.
2.2. Design of the testing protocol
The design of the testing protocol is quite similar to that in previous efforts (Grigorakis & Dimogianopoulos, 2010), (Dimogianopoulos &Grigorakis, 2011, 2014 and 2017), but significant changes have been undertaken in the algorithmic framework used for processing the experimental data and performing the diagnostic task.In essence, the fish is placed onto a tray suspended by a spring with constantKb, and free to oscillate vertically under external excitation, as shown in Fig.1.A block of specific mass is.
Released at a specific height above the fish surface, so that it drops freely and hits the fish on the tray, thus exercising a vertical loading forcef(t), as also shown in Fig.1.Following the excitation, the system consisting of tray, fish and the block, oscillates under the loadf(t) until it stops a few seconds later.Care is taken to place the fish at the same position on the tray and to ensure that the block hits the fish at roughly the same dorsal area of fish at each test.
In this study, two distinctive setups have been used for experimental testing.The first one has been developed over the last few years and is an evolution of that used in (Dimogianopoulos & Grigorakis, 2014).It involves a custom-built rig with a free vertically moving, spring-suspended wooden tray upon which the fish is placed.The spring is connected to an electronic force gauge for measuring the responsefg(t) =Kg∙xw(t)exercised by the ground when the system is under loadf(t).A small plastic hammer acts as the block exercising the loading forcef(t).The second one is the outcome of joint efforts of partners in FutureEUAqua project, funded by the European Union (see Acknowledgements).Development of a Texture Evaluation (TE) device, is currently being finalized, meaning that technical details are confidential and, as such,cannot be disclosed.Since the current study is concerned with the definition and validation of the algorithmic operational framework(rather than the device for its implementation) for evaluating fish texture, it may only be stated that the TE is purposely designed to workunder a variety of loading protocols including (but not limited to) that presented herein.As such, it has been used to check results for relevance with respect to those obtained from the custom-built rig.

Table 1 The fish tested, their characteristics and the setup used for testing.

Fig.1.The principle of operation of the experimental testing (left) and its representation by means of the Kelvin-Voigt fish model (involving fish mass m, damping element Bf and spring element Kf) and a spring Kg (right).
2.3. Algorithmic framework for fish texture evaluation
According to the Kelvin-Voigt model, the fish massmis considered as a point mass suspended by a set of one damping and one spring elements in parallel, with constantsBfandKf, respectively.The damping element is used for modelling viscoelasticity of fish flesh, namely its opposing force to a deformation imposed at steady speed.The spring element is used for modelling the flesh elasticity and springiness, namely its opposing force to an external load and its capacity of readmitting its initial form when the load is removed.During loading from an external forcef(t) the fish flesh reacts by opposing a force by the spring element equal toΚf⋅(x(t)-xw(t)) and another by the damping element equal toBf⋅d/dt[x(t)-xw(t)], with the operatord/dtdenoting first order derivative with respect to time.The ground also reacts by opposing a forceFg(t)equal toKg∙xw(t).From Newton’s law one may write for the fish and the tray, respectively:
Finally, the ground responds to fish loading by a forceFg(t) as follows:
withd2/dt2[x(t)] the second order time derivative ofx(t) and the displacementsx(t) andxw(t) measured from the equilibrium point.Following some standard methodology as found in System Theory (see Dorf & Bishop, 2010), by applying Laplace transform on (1), (2) and (3)and rearranging terms, one has:
withsthe Laplace domain argument, andR(s) denoting the transformed quantityr(t) in the Laplace domain.Combining (4), (5) and (6) and performing some standard calculus one may obtain the transfer functionFg(s)/F(s):
Equation (7) is a function relating the ground response (effect) to fish loading (cause) in the Laplace domain.The denominator features a maximum order ofsequal to 4 and the numerator has a maximum order ofsequal to 1.Setting the denominator polynomial equal to zero and solving forsyields four solutions referred to as thesystem poles, whereas applying the same procedure to the numerator yields one solution referred to as thesystem zero.
In general, if quantitiesBf,Kf, Kg,m,mware treated as variables,obtaining an analytical closed-form expression forFg(s) (in view of ultimately computing the functionfg(t) in the time domain via the application of the inverse Laplace transform) is a very complex task.In relevant textbooks (Dorf & Bishop, 2010) such analytical solutions are only available for systems of up to 2nd order under specific loading functionsf(t).Nonetheless, one may considerably simplify the task off(t)calculation by proceeding as follows.If the tray massmwis very small and in any case considerably lower thanm, then (7) may be simplified as follows:
This assumption is not unreasonable sincemdesignates the oscillating mass followingf(t) application.The latter is normally carried out by means of a block dropping onto the fish from a specific height,meaning that the total oscillating massmincludes that of the fish plus the block.Then,mis, by all means, quite larger thanmw.Adding and subtracting [Bf∙m]∙s3+[(Kf+Kg)∙m]∙s2in the numerator of (8) yields:
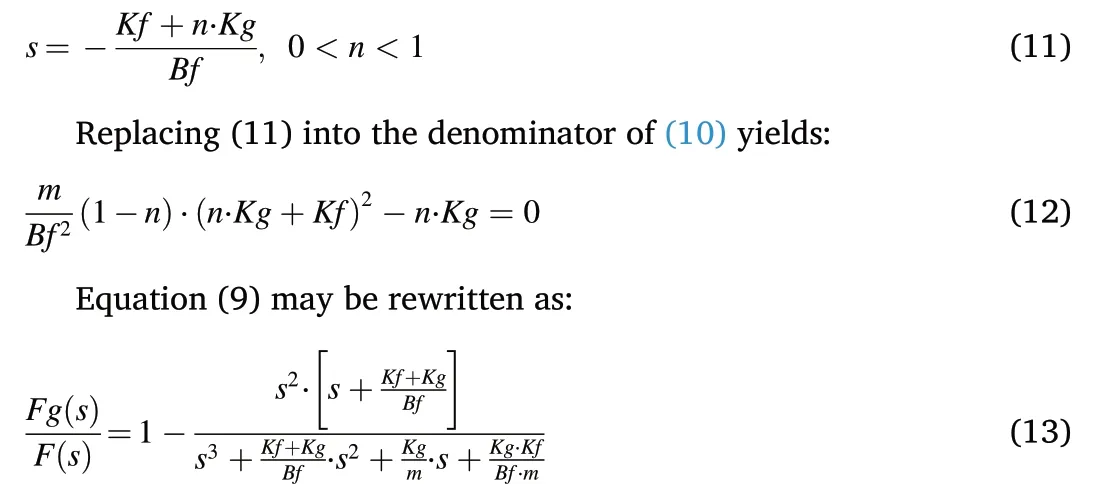
Equation (9) states that the ground responseFg(s) is equal to the loadF(s) minus the response toF(s) of the 3rd order subsystem
The subsystem P(s) has three poles, one real and two complex ones.Settings= -Kf/Bfin the denominator of (10) yieldsm⋅Kg⋅Kf2/Bf2>0,whereas settings=-(Kf+Kg)/Bf[which is equal to the system zero in(10)] yields -Kg2<0.Hence, one of the three poles of (10) admits value between -(Kf+Kg)/Bfand -Kf/Bf, or in other terms:
Knowing that the denominator in (13) has the pole defined in (11),one may write (13):

Fig.2.The loading profile f(t) involving a peak force A+ during the brief interval Δt of the block hitting the fish, followed by the constant weight A from the group of fish and block getting to oscillate.
since the expression ofεin (14) is a slightly different version of (12).Furthermore, another realistic remark is thatKf»Kg, meaning that the fish is considerably stiffer than the spring used to support the tray.In that case, (14) becomes approximately equal to:
since the term [s+(Kf+Kg)/Bf] in the numerator is approximately cancelled by [s+(Kf+n∙Kg)/Bf] in the denominator of (14).From (15)one may write:

whereζandωnare the damping factor and natural frequency of the 2nd order subsystem in (15) (see Dorf & Bishop, 2010).
If the loading function has a step form, meaning thatf(t) =Afort>0,thenF(s) =A/s, as shown in any table of Laplace transforms of standard functions.Thens∙F(s) in (16) corresponds to the impulse function multiplied byA, and in (16) the term
is essentially the impulse response of the 2nd order systemG(s), as defined in (18), multiplied byA.In other words, (16) essentially states that the response functionFg(s) is obtained if one subtracts the impulse response (multiplied byA) ofG(s) defined in (18) from the load functionF(s) =A/s.The same is valid in the time domain, namely:
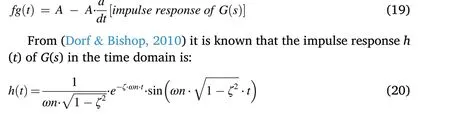
withζandωnas in (17).Thus, using (20) to perform standard calculus in(19) one obtains:
This is a closed-form analytical solution for the responsefg(t) to a step loadf(t) =A,exercised to the system modelled as in (8).

Fig.3.Typical response signal fg(t) from test run (in black) with the custom-built rig (left) and the TE (right) and curves fitted (in red) showing almost perfect match except for the last (settling) signal part.(For interpretation of the references to color in this figure legend, the reader is referred to the Web version of this article.)
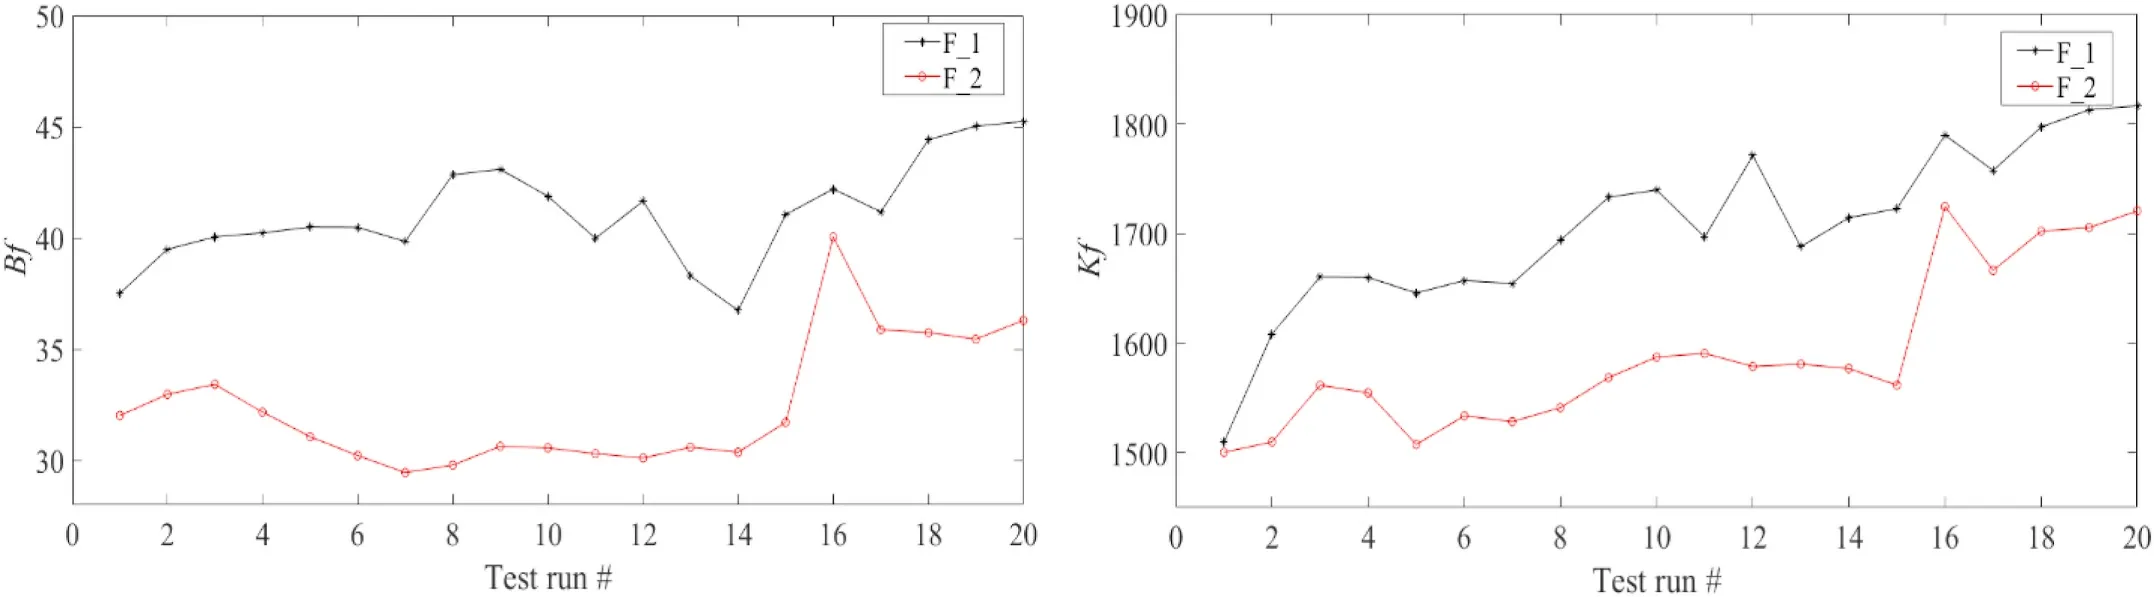
Fig.4.Values of Bf (left) and Kf (right) for fish F_1 and F_2 computed using data from 20 test runs per fish with the custom-built test rig.
However, the real profile of the loadf(t) may be far from matching a step function.In fact, released from a specific height, the block hits the fish surface, thus transmitting its kinetic energy to the fish during the(obviously very brief) time interval of the shock.Following this instant energy transmission, the mass of fish and block on the tray starts oscillating until it stops a few seconds later.Hence, there is a high peak force during the short shock interval, followed by a constant force equal to the weight of the added mass of the block and the fish getting to oscillate, as in Fig.2.The higher the initial height of release of the block, the more significant the force peak during the short time interval that the collision takes place.In previous work of the authors (in 2010, 2011, 2012 and 2014), care has been taken to drop the block from as low above the fish surface as possible in order to avoid a significant force peak during the collision, as this would result in anf(t) profile significantly different to a step function.The immediate result of this was that, unless the lab equipment had been carefully optimized, the recorded response signalfg(t) could suffer from noise in the measured values making their exploitation quite challenging.This was particularly true in (Grigorakis &Dimogianopoulos, 2010), where only specific values (those corresponding to the overshoot and settling time) of the response data recorded had to be used for diagnostic purposes.
Careful frequency analysis and filtering of the response data signal could provide relatively accurate measurement of the required values,but this requires signal processing expertise and is often not applicable in an industrial environment.In subsequent work (Dimogianopoulos &Grigorakis, 2011, 2014, 2017) a stochastic framework was used to accommodate the potentially significant noise in measurements.Even though the increased complexity in the algorithmic design (mainly related to identifying a suitable system model) was acceptable in the context of a lab environment and yielded good performance, it could also prove problematic in an industrial environment, where simplicity is the prerequisite to robustness.In view of this, effort was invested in a subsequent work (Dimogianopoulos & Grigorakis, 2017) to apply a different testing protocol, where the excitation was applied following a ramp-like function.The gradually increasing load of the fish alleviated the problem of the initial collision force peak, but introduced again problems with low signal-to-noise ratio over the initial instants of load application.Again, this problem could be mastered by means of careful handling of the load feed, but this solution required a specifically trained user for carrying out the experiments.This could not always be the case in an industrial environment.Thus, the optimal solution would be to retain and amplify the initial loading application of a block released above the fish by removing restrictions on the release height, as this would allow for obtaining satisfactory signal-to-noise ratios for the recorded response data.If one wished to avoid working within a stochastic framework, an effective solution was to develop a sufficiently accurate closed-form analytical formula of the response data and use it for fitting curves (in a least-squares context) on data recorded during the experiment [as in (Dimogianopoulos & Grigorakis, 2017)], instead of just using specific data values [as in (Grigorakis & Dimogianopoulos,2010)].
Hence, lett= 0 be time of the block meeting the fish surface, thus creating the forceA+.The shock has a very brief duration ofΔtseconds,with the group of fish and block starting to oscillate thereafter.At timet=0 +Δtthe force value has settled toA, which is known and equal to the weight of the fish and block.The valueA+is obviously unknown and should probably be considered as quite variable, hadΔtbeen significant.In the current case ofΔtbeing very short, one may as well consider thatA+admits a constant value, which could very well be the mean value of the real collision force overΔt.Then, the (short width) pulse with magnitudeA+over a time intervalΔtin Fig.2 may be modelled as a step function admitting a valueA+att= 0 and another admitting a value equal to -A+at t =0 +Δt.At t >0 +Δt,f(t) =A.Then, ifu(t) is the unit step function, meaning thatu(t) =1 for allt≥0, the functionf(t) has the following form:
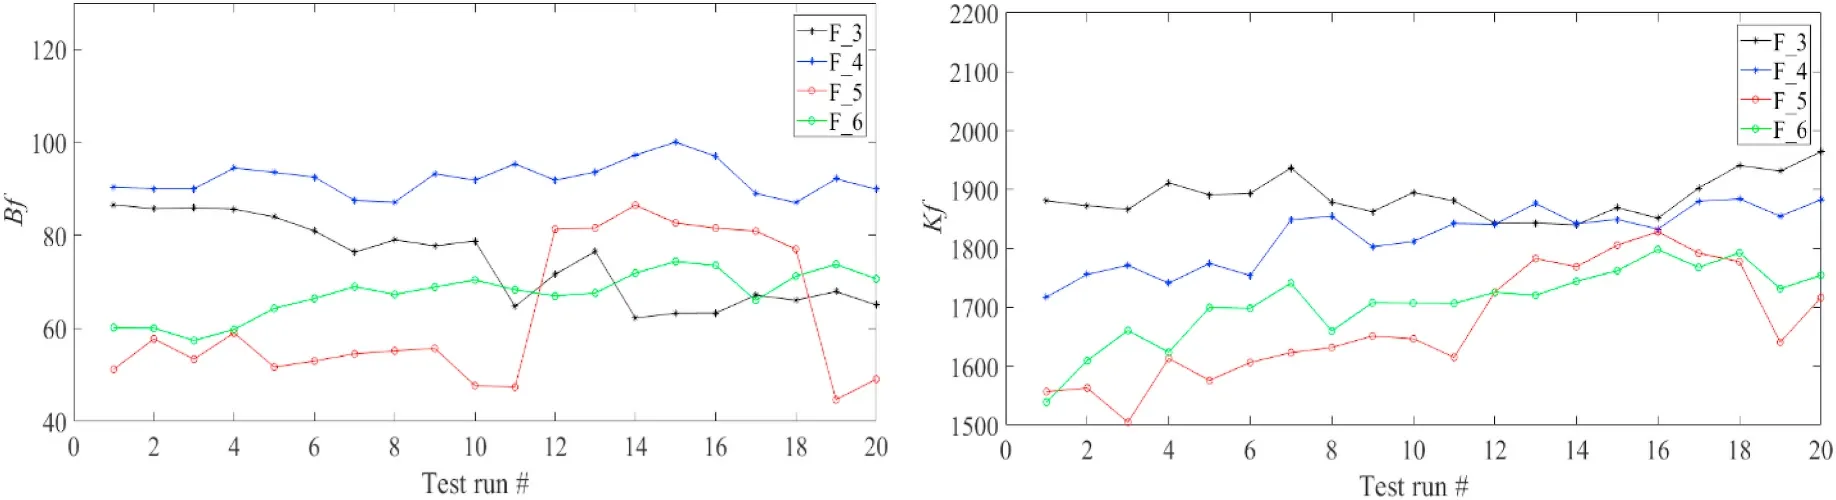
Fig.5.Values of Bf (left) and Kf (right) for fish F_3 – F_6 computed using data from 20 test runs per fish with the TE.

Table 2 Mean and standard deviation for Bf and Kf computed with tests from the custom-built rig.

Table 3 Mean and standard deviation for Bf and Kf computed with test data from the TE.
Since the system is linear with a transfer function given by (15),according to the superposition principle of linear systems (Dorf &Bishop, 2010), the system responsefg(t) to the inputf(t), comprising of the three constituents in (22), will be equal to the sum (superposition) of the system responses to each constituent, namely:
with quantities in (23) corresponding to the system responses to step inputsA+∙u(t), -A+∙u(t-Δt) andA∙u(t-Δt), computed by repeatedly using (21):
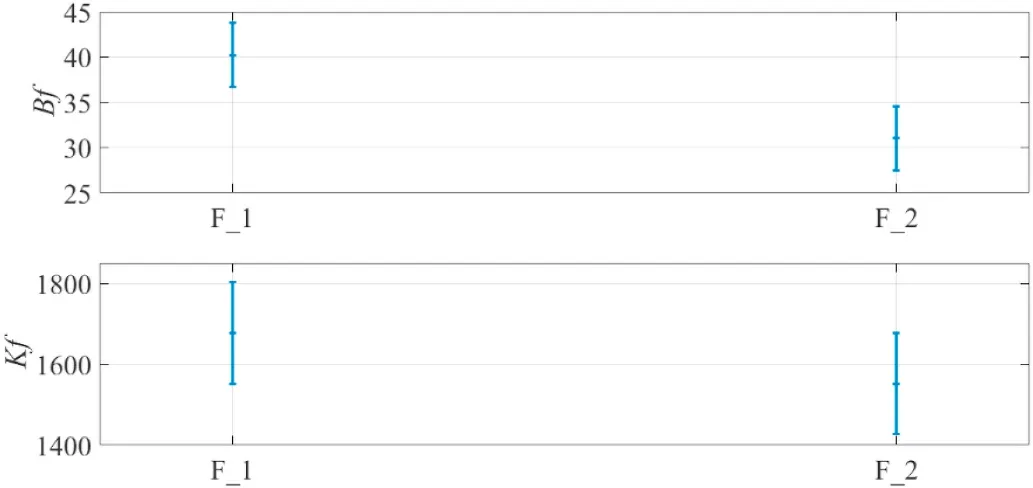
Fig.6.Error-bars for Bf (top) and Kf (bottom) for fish F_1, F_2 computed using data from test runs #1 - #15 with the custom-built rig.
Equations (23–26) describe the complete system responsefg(t) to the input forcef(t) in (22), as shown in Fig.2.For instance, if 0
Hence, if measured test values forfg(t) are available, then:
• One may use Equations (23–26) along with least-squares curvefitting algorithms (readily available in dedicated software) to estimate values forζandωn.
• Using (12) and (17), one may easily compute constantsn,BfandKffor the tested fish, by solving the set of these three equations, again using any relevant routine in dedicated software.
Note that the data fitting process means that noise in measurement is not as significant a problem as in (Grigorakis & Dimogianopoulos, 2010)where only specificfg(t) values were used and had to be precisely known.At the same time, no stochastic system modelling and identification (and the associated expertise from the user) are needed for tolerating noise, as in (Dimogianopoulos & Grigorakis, 2011, 2014,2017).
3.Results and discussion
As previously stated (subsection 2.3), tests have been conducted with two setups, namely the custom-built rig and the TE whose development is currently being finalized.Therefore, even though the algorithmic frameworkcanbe shared, there are key parameters (the block mass and the spring constantKb, to name but a few) which could never admit the same values in the two test setups for technical reasons.Then, obviously results from testing with the custom-built rig should be qualitatively comparable to those from the TE, meaning that trends inBfandKfshould be the same between fresh and 6-day-old fish irrespectively of the test setup.The testing procedure involved 20 runs for each fish, with both setups.Initial block release height was set to 3 cm in the custombuilt rig, which was the maximum allowable height due to technical.
Limitations.In the TE case, no such limitations were present, hence a more substantial initial block release height of 4 cm was selected.Recording offg(t) data was carried out at 50 Hz.
Tests were conducted on two separate occasions.First, fish F_1 and F_2 were tested with the custom-built rig.Some days later, fish F_3-F_6 were tested by means of the TE (Table 1).Testing on different dates was opted for practical reasons.Sequentially testing the same fish with both setups (hence, at the same date) would be impossible, since this would violate the requirement for having a fish of comparable initial condition before each set of 20 test runs.
Fig.3 presents the recordedfg(t) response for the custom-built rig(left) and the TE (right).The recorded data are presented in black,whereas the red lines show the simulated curve using Equations(23–26), after performing the least-squares curve-fitting process and the estimation ofζandωnvalues (see subsection 2.3).It is obvious that the representation in (23)-(26) produces curves which essentially match those from experimental data with both setups, with slight differences only notable at the part of the curve settling down.The associated values forBfandKf(computed using (17 using the estimatedζandωnvaluessee subsection 2.3) are presented in Fig.4 and Fig.5, for the custombuild rig and the TE, respectively.
One obvious observation is that 6-day-old fish F_2 and F_5 seem to be affected by repeated hits during the testing procedure, since the values computed forBfandKfexhibit abrupt changes from the 16th (custombuilt rig), or the 11th (TE) test run onward.By the end of the 20th run,the fish muscular structure has seemingly been affected by repeated hitting, meaning that even if the fish is edible in aspects of retaining its sensory quality, its muscular internal structure has been compromised.The advantage of the currently proposed testing procedure is that the relevant values forBfandKfare indeed easy to be monitored throughout testing, making it possible to define the number of runs for which no such damage to the fish has occurred.It is also reasonable that when a higher block release height (as in the TE case) is used, damage occurs earlier (at the 11th with TE instead of the 16th run with the custom-built rig).Abrupt changes inBfandKfvalues are easily noted when their mean and standard deviation are computed, as in Tables 2 and 3.The grey shaded cells in both tables indicate that standard deviation ofBfandKfvalues is considerably lower when computed on data from up to the 15th (custom-built rig) or the 10th (TE) run.
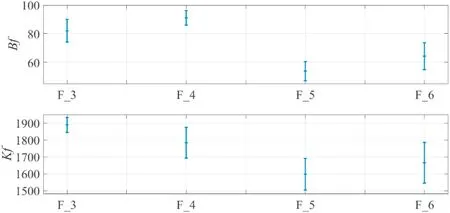
Fig.7.Error-bars for Bf (top) and Kf (bottom) for F_3 - F_6 computed with data from test runs #1 - #10 in TE.
Another remark is related to whether the differences inBfand/orKfvalues between fresh and 6-day-old fish are statistically significant.Fig.6 presents the error-bars (mean±2std) forBf(top) andKf(bottom)values computed on test data by the custom-built rig.
Whereas Fig.7 shows similar information for Bf (top) and Kf (bottom) values computed on test data by the TE.The computed values for either Bf or Kf are not normally distributed.Hence, the error-bars showing two standard deviations do not correspond to 95% confidence level, but are purely indicative.
Nonetheless, it seems that 6-day-old fish exhibit significantly lower values forBfthan their fresh counterparts, since the relevant error-bars do not overlap in Fig.6 (top) and Fig.7 (top).On the other hand, it seems that 6-day-old fish exhibit values forKflower than those from fresh fish,even though this is more of a trend than a significant difference due to the overlapping in error-bars in Fig.6 (bottom) and 7 (bottom).It is important that these results are similar to (and thus validate) those in the study (Dimogianopoulos & Grigorakis, 2017), which were established by using a different ramp-like testing protocol.
Finally, it is important to mention that the validation of rapid freshness evaluation methods usually requires correlation of results with those deriving from classic sensory, microbiological and biochemical freshness evaluation.Indeed, this analysis has been previously conducted with relevant results established in (Grigorakis & Dimogianopoulos, 2010; Dimogianopoulos & Grigorakis, 2011; 2014).Therein, a remarkably good correlation between our herein described methodology and the freshness stage of the fish as evaluated by sensory and chemical freshness has been demonstrated.Since this part of the work has already been done for the texture evaluation method in (Grigorakis& Dimogianopoulos, 2010; Dimogianopoulos & Grigorakis, 2011;2014), the current study focused on the accomplishment of the testing protocol and algorithmic analysis of test data.
The herein-proposed fish texture evaluation method has shown successful description of the mechanical properties of the fish and their alterations.This can be effectively used for evaluating freshness in fish.The fact of recording early post-mortem changes in fish texture relating to onset and resolution of rigor mortis offers a significant advantage to our approach, over other rapid freshness evaluation methods that record changes, in conductivity or chemical status of the fish, since these become profound in later post-mortem times and relate to bacterial spoilage.Another advantage is that operation of the system is simple and can be applied in industrial environment The limitation of the currently proposed method has mainly to do with the size/weight of the examined sample.The Texture Evaluation (TE) device developed to support our framework is such, in order to effectively operate with fish sizes between 300 g and 800 g-1 Kg, i.e.usual marketable sizes of common species of Mediterranean farmed fish (gilthead sea bream, sea bass).If evaluation of fish sizes other than those is required, perhaps the current system is inefficient in giving reliable measurements and respective modifications would be necessary to match different sizes.
4.Conclusion
The current work proposed an algorithm for operating within a nondestructive texture evaluation framework which may be advantageously used in an industrial environment.The fish is part of a system which is dynamically loaded following a testing protocol designed to achieve favorable signal-to-noise values.At the same time, a new accurate closed-form analytical expression for the system response to the specific testing is comprehensively derived, and used along with experimental data, for computing specific mechanical properties of fish flesh, thus attributed to its freshness (viscoelasticity, springiness and so on).This only requires the use of conventional curve-fitting routines operating in the least-squares sense, found in most relevant software,such as MATLAB ®.The algorithmic operational framework has been used for testing in a custom-built test rig and a prototype device, with results following remarkably similar trends, achieving clear distinction of differences in separate textural characteristics related to freshness,and consequently validating the proposed scheme.
CRediT authorship contribution statement
D.Dimogianopoulos:Fish testing, Formal analysis, Investigation,Writing - original draft, Funding acquisition.K.Grigorakis:Fish supply,testing, Data curation, writing, Funding acquisition.
Declaration of competing interest
The authors declare that there is no conflicts of interest.
Acknowledgements
This work was supported in part by FutureEUAqua project (Future growth in sustainable, resilient and climate friendly organic and conventional European aquaculture) funded by European Union’s Horizon 2020 research and innovation program under grant agreement No 817737.The authors are particularly grateful to associates Mr.Emmanuel Tzevelekakis MSc who has been in charge for designing and building the Texture Evaluation device used for part of testing in this work and Dr.Panagiotis Christofilogiannis (AQUARK) for coordinating and providing the means for the Texture Evaluation device development.
杂志排行

Aquaculture and Fisheries的其它文章
- A framework for risk analysis of the shellfish aquaculture: The case of the Mediterranean mussel farming in Greece
- Slurry ice as an alternative cooling medium for fish harvesting and transportation: Study of the effect on seabass flesh quality and shelf life
- Application of hurdle technology for the shelf life extension of European eel(Anguilla anguilla) fillets
- Physicochemical properties of silver carp (Hypophthalmichthys molitrix)mince sausages as influenced by washing and frozen storage
- Bacterial community in response to packaging conditions in farmed gilthead seabream
- Seasonal variation in the biochemical composition, condition index, and meat yield of the non-indigenous pearl oyster Pinctada imbricata radiata(Leach, 1814) from the West of the Aegean Sea, Greece