Debris cloud structure and hazardous fragments distribution under hypervelocity yaw impact
2023-10-09ChenyangWuQiGuangHeXiaoweiChenChunboZhangZebinShen
Chenyang Wu ,Qi-Guang He ,Xiaowei Chen ,Chunbo Zhang ,Zebin Shen
a State Key Laboratory of Explosion Science and Technology,Beijing Institute of Technology,Haidian District,Beijing,100081,China
b School of Mechatronical Engineering,Beijing Institute of Technology,Haidian District,Beijing,100081,China
c Institute of Systems Engineering,China Academy of Engineering Physics,Mianyang,Sichuan,621999,China
Keywords:Debris cloud Hypervelocity yaw impact FE-SPH adaptive method Velocity space Hazardous fragments distribution
ABSTRACT This study investigates how the debris cloud structure and hazardous fragment distribution vary with attack angle by simulating a circular cylinder projectile hypervelocity impinging on a thin plate using the finite element-smoothed particle hydrodynamics (FE-SPH) adaptive method.Based on the comparison and analysis of the experimental and simulation results,the FE-SPH adaptive method was applied to address the hypervelocity yaw impact problem,and the variation law of the debris cloud structure with the attack angle was obtained.The screening criterion of the hazardous fragment at yaw impact is given by analyzing the debris formation obtained by the FE-SPH adaptive method,and the distribution characteristics of hazardous fragments and their relationship with the attack angle are given.Moreover,the velocity space was used to evaluate the distribution range and damage capability of asymmetric hazardous fragments.The maximum velocity angle was extended from fully symmetrical working conditions to asymmetrical cases to describe the asymmetrical debris cloud distribution range.In this range,the energy density was calculated to quantitatively analyze how much damage hazardous fragments inflict on the rear plate.The results showed that the number of hazardous fragments generated by the case near the 35° attack angle was the largest,the distribution range was the smallest,and the energy density was the largest.These results suggest that in this case,debris cloud generated by the impact had the strongest damage to the rear plate.
1.Introduction
Since a spacecraft was first launched,the protection of spacecraft from impacts such as space debris and micrometeoroids has been increasingly pursued by researchers worldwide.Generally,space debris and other impacts occur at extremely high speeds.Present ground control methods are primarily used to actively avoid debris greater than 10 cm,whereas passive protection is used for debris sized 1 cm or smaller[1].As the main method of passive protection,Whipple dual-layer protection structures (Whipple Shields) are widely used in spacecraft owing to their simple structure and high reliability.
Generally,the Whipple Shield comprises a front plate(bumper)and a rear plate(spacecraft bulkhead)located at a certain distance behind the front plate.The main function of the front plate is to cause the impactor to break,melt,or evaporate,in which a smaller and lower-speed debris cloud between the two plates is formed to achieve the purpose of disperse the remaining impact energy to a larger area of the rear target[2].
It is difficult for space debris (hereinafter referred to as projectiles) to ensure that the axial direction is consistent with the flight direction during flight,and it is easy to form a specific angle of attack.Numerous experiments have been conducted under hypervelocity yaw impact [3-6].Piekutowski [4] conducted a series of experiments on cylindrical aluminum projectiles impacting aluminum plates and systematically studied how the attack angle influences the structure and damage ability of the debris cloud.These experiments [4] showed three parts of the structure: the front cone,the inner cone,and the spherical main debris cloud.As the attack angle gradually increases,the structure will change significantly,which gradually increases damage to the rear plate,even penetrating the second target plate.Beissel et al.[7]simulated the aforementioned experimental cases [4] based on the generalized particle algorithm (GPA) and found that a large number of fragments gathered on the sharp edge side after the yaw impact,which seriously damaged the rear plate.Furthermore,Beissel et al.[8] simulated the cases of different projectile shapes hitting the target plate at attack angles of 0°,45°,and 90°at the same speed using the same method,and analyzed the change in mass and kinetic energy distribution of fragments with the angle of attack.However,there was no systematic description of the influence of the change in the projectile's attack angle on the structure of the debris cloud,and no in-depth differentiation or discussion of the information of these fragments.Zhang et al.[9] adopted the smoothed particle hydrodynamics (SPH) method to simulate a cylindrical projectile impacting a target plate at two angles of attack[4].Simultaneously,the damage of the debris cloud to the rear plate was analyzed using the linear mapping method,and it was alleged that the debris cloud penetrating the rear plate was based on the principle of cumulative damage.However,the work did not provide a specific definition of the‘dangerous fragments’,nor did it provide the size and morphology information of the‘dangerous fragments’obtained.The above experiments demonstrated that the sharp edges of the projectile cause a large amount of debris to gather on one side during yaw impact,thereby posing a serious threat to the rear plate.Therefore,it is very interesting to study the influence of the change in the projectile attack angle on the structural characteristics of the debris cloud and its penetration performance.
Hazardous fragments are the primary cause of damage to the rear plate in the debris cloud.At present,there is still no clear method for identifying hazardous fragments generated by hypervelocity yaw impact.Previous studies on debris clouds generated by the hypervelocity normal impact of a spherical projectile,the study of hazardous fragments primarily focuses on the large central debris distributed in the internal structure(central structure)of the debris cloud [10,11] with a larger mass and higher speed.This can cause severe damage to the rear plate.These fragments were easily observed and analyzed in experiments or numerical simulations.However,there is no effective criterion for many small fragments at high speeds.
Meaningful research has been conducted on the distribution of hazardous fragments.Akahoshi et al.[12] adopted cylindrical polyethylene projectiles to impact aluminum plates and collected the generated fragments through polystyrene target plants.In this manner,the authors obtained the distributed information of the mass and spray angles of the fragments.Liang et al.[13]and Huang et al.[14] obtained the distribution of fragments in a debris cloud based on the SPH particle attribution algorithm and fragment identification method.Moreover,Huang et al.[14] proposed an engineering model of a debris cloud based on the Monte Carlo method.Wen et al.[15] discussed the distribution of large central fragments and annular secondary fragments experimentally and numerically.Based on the centrosymmetric distribution of the debris cloud,the authors calculated the radial distribution of the number and size of the perforations on the rear plate.Owing to the limitations of the experimental conditions and numerical simulation methods,the studies mentioned above has not fully considered small-size hazardous fragments.
Indeed,experiments are the most effective method for studying hypervelocity impacts.However,owing to the limitations of experimental equipment,the speed,mass,and shape of the projectile can hardly realize the real situation of space debris.Besides,the diagnostic equipment cannot observe the failing process of the material and phenomena during impact.Specifically,experimental test can only record the overall morphology and structure of a debris cloud and provide preliminary tracking of large debris [16].Additionally,the requirements for equipment and experimental levels are high owing to high cost,longer cycles,and the experiment cannot be performed in large quantities.Numerical simulations are widely used owing to their efficiency,intuitive,and repeatability.In addition to compensating for the deficiencies of the experiment,numerical simulations also provide guidance for the experiment and establish an understanding of the impact process and the internal mechanism of the impact phenomenon.
Some scholars have conducted numerical experiments on hypervelocity impact (HVI) based on the traditional grid method[17-19].The principle of simulating material fragmentation in the grid method involves deleting failed elements.Due to the extreme deformation in the hypervelocity impact,this method causes a sudden change in the interface and excessive loss of system energy and kinetic energy.The remaining elements were insufficient to describe the phenomenon after the impact.However,during the HVI of space debris,there are many problems,such as large deformation,penetration,and rupture of materials,which are difficult to accurately simulate with this method.
At present,the meshless algorithm is the most widely used numerical method for solving HVI problems.Moreover,smoothed particle hydrodynamics (SPH),the material point method (MPM),and optimal transportation meshfree (OTM) [20] have also achieved remarkable results.The principle of the meshless algorithm involves using discrete particles to represent a continuum,and the particles are independent of each other.During the calculation process,there are no distorted elements,and the criterion for material fragmentation is to determine whether the distance between two particles exceeds the threshold.The process does not require the removal of particles to ensure energy conservation of the system.The meshless method is widely used in hypervelocity impact,of which the SPH method is the most commonly used.However,the SPH method still has several limitations,such as tensile instability,unclear material boundaries,and difficulty defining boundaries.Moreover,the SPH method cannot directly obtain the distribution information of the fragments in the debris cloud.More specifically,the SPH method uses an attribution algorithm and fragment boundary recognition algorithms,and identifies the fragment based on the distance between two particles[13,14].Zhang et al.[21]adopted the finite element method(FEM)for modeling,followed by the SPH method for calculation,and finally converted the generated particles to FEM for fragment identification.However,the core of their calculations was based on the SPH method.The above fragment identification technology has a high threshold and still has room for improvement.
Apparently,integrating the advantage of FEM and SPH can better identify fragments in debris clouds.Johnson et al.[22] proposed the GPA algorithm: the element is converted into particles when it reaches the threshold of equivalent strain,which fully combines the advantages of FEM and SPH.Moreover,coupling the modeling of elements and particles can greatly improve the calculation efficiency in HVI simulations [23,24].Furthermore,Johnson et al.[25,26]conducted a series of exploratory work on the grid and meshless methods and the conversion between them.He et al.[27] proposed a finite element-smooth particle adaptive method based on the GPA algorithm.The method includes selecting the appropriate failure criterion,the coupling method of SPH particles and elements,and the contact mode between elements and other control parameters.Accordingly,He et al.[28]experimentally selected the appropriate criteria according to the damage and size information of the rear plate [15] to screen out hazardous fragments.For the hypervelocity normal impact,the velocity space was introduced to obtain the maximum velocity angle of the hazardous fragments in a stable state,which was used to simultaneously describe the distribution range of the hazardous fragments and analyze the law of energy distribution within the distribution range.
There have been several studies on the influence of the change in the angle of attack of the projectile on the structure of a debris cloud.However,these studies do not present regular knowledge.Although the analysis of hazardous fragment distributions has made considerable progress with the advancement of numerical simulation technology,it is mostly used in the analysis of debris clouds with symmetric structures.It is insufficient to describe the distribution characteristics of hazardous fragments in asymmetric debris cloud structures.
This study takes a cylindrical projectile hypervelocity yaw impacting plate as an example and research uses the FE-SPH adaptive method.First,the reliability of this method was verified by comparing it with the results of the same case.Accordingly,additional yaw impact cases were designed to conduct a detailed analysis on the influence of the attack angle over a large range on the debris cloud.Subsequently,the hazardous fragments were screened,and the relationship between the distribution characteristics of the hazardous fragments and the attack angle was analyzed.Moreover,the concept of velocity space is promoted by expanding the maximum velocity angle from a single variable in a center-symmetric case to two variables to describe the distribution range of hazardous fragments under asymmetrical conditions.This is widely used for the HVI problem.In this distribution range,the kinetic energy density was calculated to quantify the damage ability of the hazardous fragments to the rear plate.
2.Numerical method
2.1.FE-SPH adaptive method
The FE-SPH adaptive method is suitable for numerical experiments on hypervelocity impact.The process is as follows:First,we used the FEM to model,divide the element,define the boundary condition,and set the material parameters and failure criterion.Subsequently,we used the coupling algorithm in the adaptive method to couple the SPH particles with the element to be calculated.During the calculation process,the element that reached the failure threshold was deleted and replaced by SPH particles.The elements remaining after calculation represent materials that have not completely failed,and multiple connected elements represent the fragments after impact.When SPH particles are used to replace the deleted failed elements,the particles are regarded as tiny fragments after the material is broken,which inherit information about the element,such as mass,material,speed,etc.Noticeably,the SPH algorithm can calculate various force scenarios of materials,such as compressive stress,tensile stress and shear.However,in the adaptive method,the SPH particles correspond to the failed material,which has no residual strength and cannot withstand tensile stress and shear stress;it can only withstand compressive stress[27].It should be note that the SPH particles are independent of each other.In the initial impact,the particles between projectiles and plate can transmit the pressure.With the development of impact,the distance between particles is much larger than the radius of the smooth kernel,and thus the particles have no influence on the neighbors.So,the SPH particles are only used to represent the distribution of tiny fragments and the shape of debris clouds.The interaction between particles need not to be considered.
LS-DYNA is mature in solving HVI problems and supports the keywords of the FE-SPH adaptive method.Version R11.0.0 is used to calculate in this study.The parameter settings and specific implementation methods of the adaptive method were introduced in detail by He et al.[27].Where the main keyword DEFINE_ADAPTIVE_SOLID_TO_SPH can be used to implement the FE-SPH adaptive method.The parameters that the ID of the solid part or part set,the number of SPH particles generated by each element,the coupling type of particles to other elements,and particle attributes need to be defined.After setting this keyword,the program can generate SPH particles with the same parameters for the corresponding elements before calculation.Here,one element corresponding to one particle.The particles are constrained on and move with the corresponding elements.In the key word of DEFINE_ADAPTIVE_SOLID_TO_SPH,the key parameter ICPL that controls the switch of the coupling algorithm between particles and elements is set as 1 to enable the coupling algorithm;the other key parameter IOPT that controls the particle activated time and the time when the coupling algorithm starts to work is set as 1,which means the particles are activated when the corresponding elements fail.This coupling algorithm contains the contact relationship between particles and elements,so the key word CONTACT_ERODING_SURFACE_TO_SURFACE that controls the contact condition for the elements of the projectile and the plate needs to be defined.Moreover,the key word CONTACT_INTERIOR is set to calculate the contact between elements inside one entity [27].
The principle of the adaptive method is the same as that of the GPA algorithm;the element is transformed into particles once it meets the setting failure condition.The main difference is that the GPA algorithm uses the equivalent plastic strain as the element failure criterion,whereas the FE-SPH adaptive method uses the Johnson-Cook failure model (JC) and the maximum tensile stress failure criterion.The JC failure model simulates the squeezing failure of the material,which avoids defects in which the fragment size is smaller than the real fragment because of the premature conversion of the elements into SPH particles.
This method combines the advantages of the FEM with clear boundaries and the SPH particle method,which does not cause element distortion through material deformation and does not cause excessive energy and momentum loss due to the deletion of invalid materials.It can be efficiently applied to solve HVI problems,and the remaining elements can be used to collect information on the morphology and size of fragments[27],which is convenient for further statistical analysis.However,this method is greatly limited by the computer memory,and the parallel computing efficiency is low.Element size and model size need to be controlled during the modeling process.
2.2.Angle relationship between orthogonal views and reference view
In a real-space environment,space debris hitting spacecraft can have any shape.In this study,a cylindrical projectile,which is a typical representative of non-spherical projectiles,is selected as the research object to comprehensively study the influence of the attack angle on the debris clouds and the distribution of hazardous fragments.The model refers to the experiments in Ref.[4] and simulation model in Ref.[9].It should be mentioned that Zhang et al.[9] introduced the ‘view angle’ during the analysis of experimental results [4],and gave the angle conversion relationship between the orthogonal views in the experiment and the reference view,which simplifies the modeling process and provides convenience for realizing the unification of the asymmetric experimental model and the theoretical model.
The attack angle is defined as the angle between the velocity direction and axis of the projectile [29].The reference view is where the symmetry plane of the projectile is located.In the experiment,the orthogonal photography technique was used to obtain three-dimensional structural information of the debris cloud.The velocity direction of the projectile was consistent with the z-axis direction;however,the projected direction of the projectile axis was different in orthogonal views.Zhang et al.[9]defined the pitch angle and yaw angle as the angle between the velocity direction and axis of the projectile projected in the side and the top views,respectively.The attack angle corresponds to the angle between the speed direction and the axis of the projectile in the reference view.The relationships between the pitch angle,yaw angle,and attack angle are formulated in Ref.[30].
where θ denotes the attack angle,and θ1and θ2denote the pitch and yaw angles,respectively.To obtain the conversion relationship between the reference view and the orthogonal views,the view angle in the reference view is considered as α=0°,and the angles of view between the reference view and the angles of view between the reference view and the two orthogonal views(side view and top view) are α1and α2,respectively.The two orthogonal views are mutually perpendicular and naturally satisfy
α2is calculated as following [9].
2.3.Numerical test model
Here,we selected two sets of experimental cases in Ref.[4] for the calculation and analysis.In case 1:the velocity of the projectile is 6.48 km/s,the pitch angle θ1is 3°,and the yaw angle θ2is 6°.In case 2,the velocity of the projectile is 6.39 km/s,the pitch angle θ1is 15°,and the yaw angle θ2is 20°.From Eq.(1),the attack angles of the projectile in the two cases were determined as 6.7°and 24.3°,respectively.Based on Eq.(2) and Eq.(3),the view angles of the orthogonal views (side view and top view) in the two cases were determined as α1=-63.5°[9] and α2=26.5°;α1=126.4°and α2=36.4°,respectively.Thus,the model can be established,as shown in Fig.1.
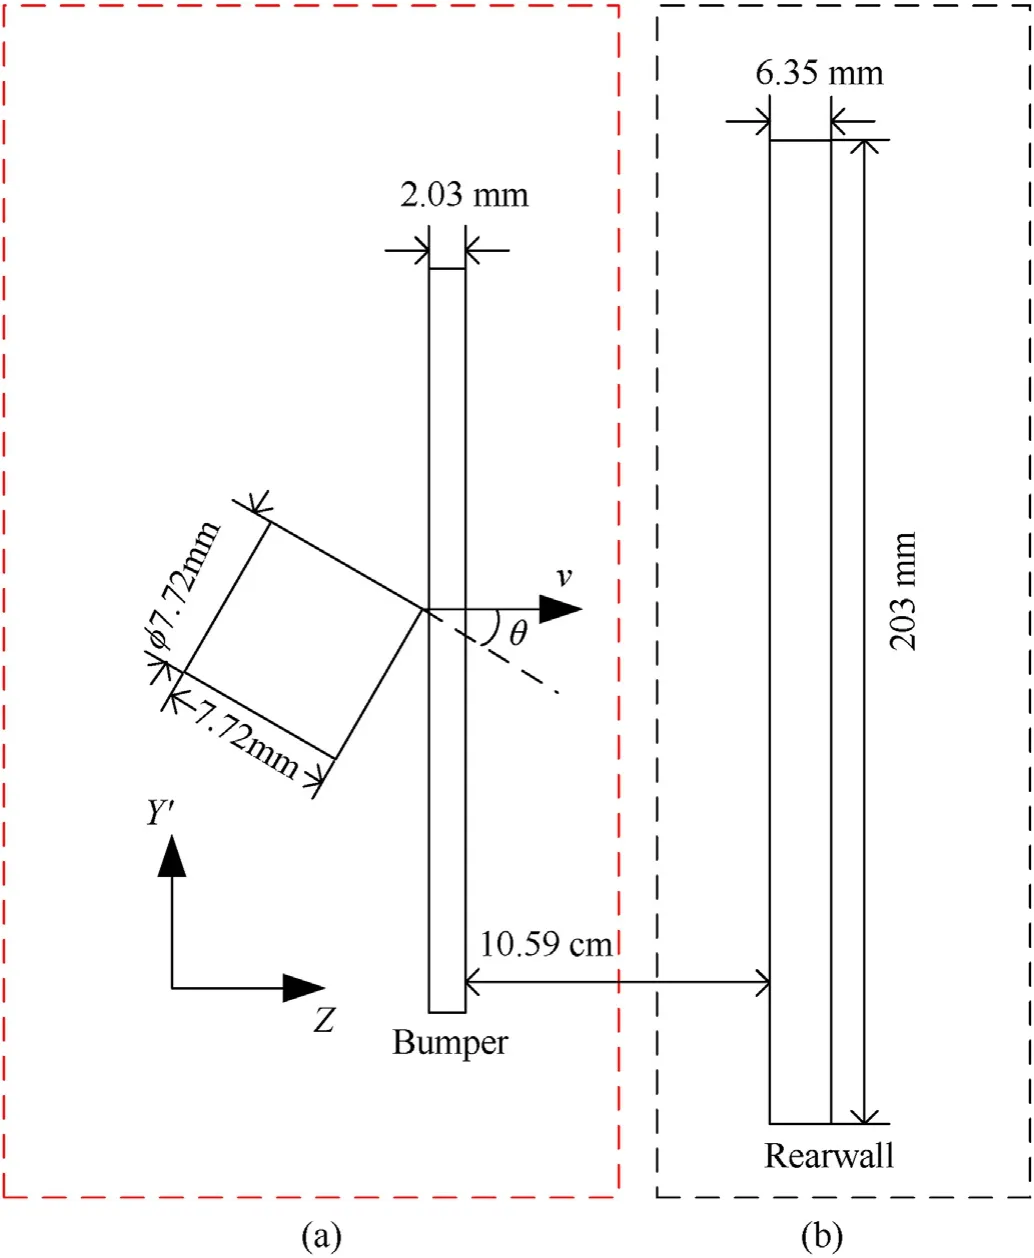
Fig.1.Schematic of a cylindrical projectile impacting thin plate at angle of attack.
Fig.1(a)shows the calculation model of the projectile impacting the front plate,where θ indicates the angle between the axis of the cylindrical projectile and the velocity of the projectile under the reference view,that is,the attack angle.The model shown in Fig.1(b) has not been established,it is a virtual rear target that is only used for the qualitative analysis of the distribution of debris generated by the impact on the rear plate.The parameters of the projectile and bumper in Fig.1(a) are listed in Table 1.

Table 1 Experimental parameters in Fig.1(a).
Since it is difficult to determine the material parameters of Al2024-T4,the projectile in this numerical experiment was replaced with Al2024-T3 materials with similar properties.The edge of the target board used a fixed restraint method with complete degrees of freedom.
Given the threat of millimeter-level debris to the spacecraft bulkhead,to obtain accurate information on the shape and size of the debris when modeling with FEM,the element size of the projectile and front plate was set to 0.1 mm.The Johnson-Cook strength model and Mie-Gruneisen equation of state were used in the adaptive method to describe the material behavior.The specific parameters of the strength model and the equation of state are listed in Table 2 of Ref.[27].Simultaneously,the failure criteria were chosen with the maximum tensile stress failure (set as 2.6 GPa)and JC failure model.

Table 2 The head axial velocity of the debris cloud in two cases.
It should be noted that the basic version of JC model is effective for strain rates lower than 103s-1.In the cases of hypervelocity penetration,using the basic version of the JC model may underestimate the material strength and thus overestimate the penetration depth.Therein the Johnson-Cook (JC) strength model had been improved by many scholars to meet the coherence that the equivalent plastic strain rates are higher than 103s-1[31-33].However,the equation of state dominates the hypervelocity impact because of the high stress generated by the impact,and the strength model has a little effect on the formation of the debris cloud [34].Moreover,a lot of numerical simulations of HVI problems with the basic JC model have good agreement with the experiment results [8,27,28,35].
It is necessary to recalculate the cases in the experiment and numerical simulation.In this way,we compared these results to verify the reliability and feasibility of the adaptive method.Then,we analyzed the numerical experiment preliminarily to obtain critical information that cannot be extracted from previous results.Accordingly,existing cases are promoted by simulating the impact condition with great attack angles to analyze the debris cloud structure and hazardous fragment distribution under different conditions.
3.Verification of FE-SPH adaptive method
The most direct and effective method to verify the reliability of numerical results is to compare and analyze critical information,such as the distribution of the target and projectile materials,contour of the debris cloud,and head velocity of the debris cloud simultaneously based on the experimental results under different view angles.
3.1.Comparing the result of adaptive method with experiment
Calculation results of the adaptive method at 5 μs in case 1 and 6.5 μs in case 2 in the reference view were selected for comparison.Simultaneously,based on the angular relationship between the reference view and the two orthogonal views,the reference view is rotated around thez-axis to the views consistent with the experiment,which is illustrated in Fig.2.In Fig.2,the left side shows the experimental result [4],the middle represents the SPH calculation result [9],and the right side presents the calculation result of the adaptive method.In the results of adaptive method,the red part represents the projectile material that has not failed after impact,and the blue part represents the target material.The SPH particles represent the deleted failed elements,i.e.,the yellow particles correspond to the projectile material,and the green particles correspond to the target material.Three main structures can be clearly observed: front cone,inner cone,and outer bubble.The front and inner cones of the debris cloud constitute the main structure of the debris cloud.
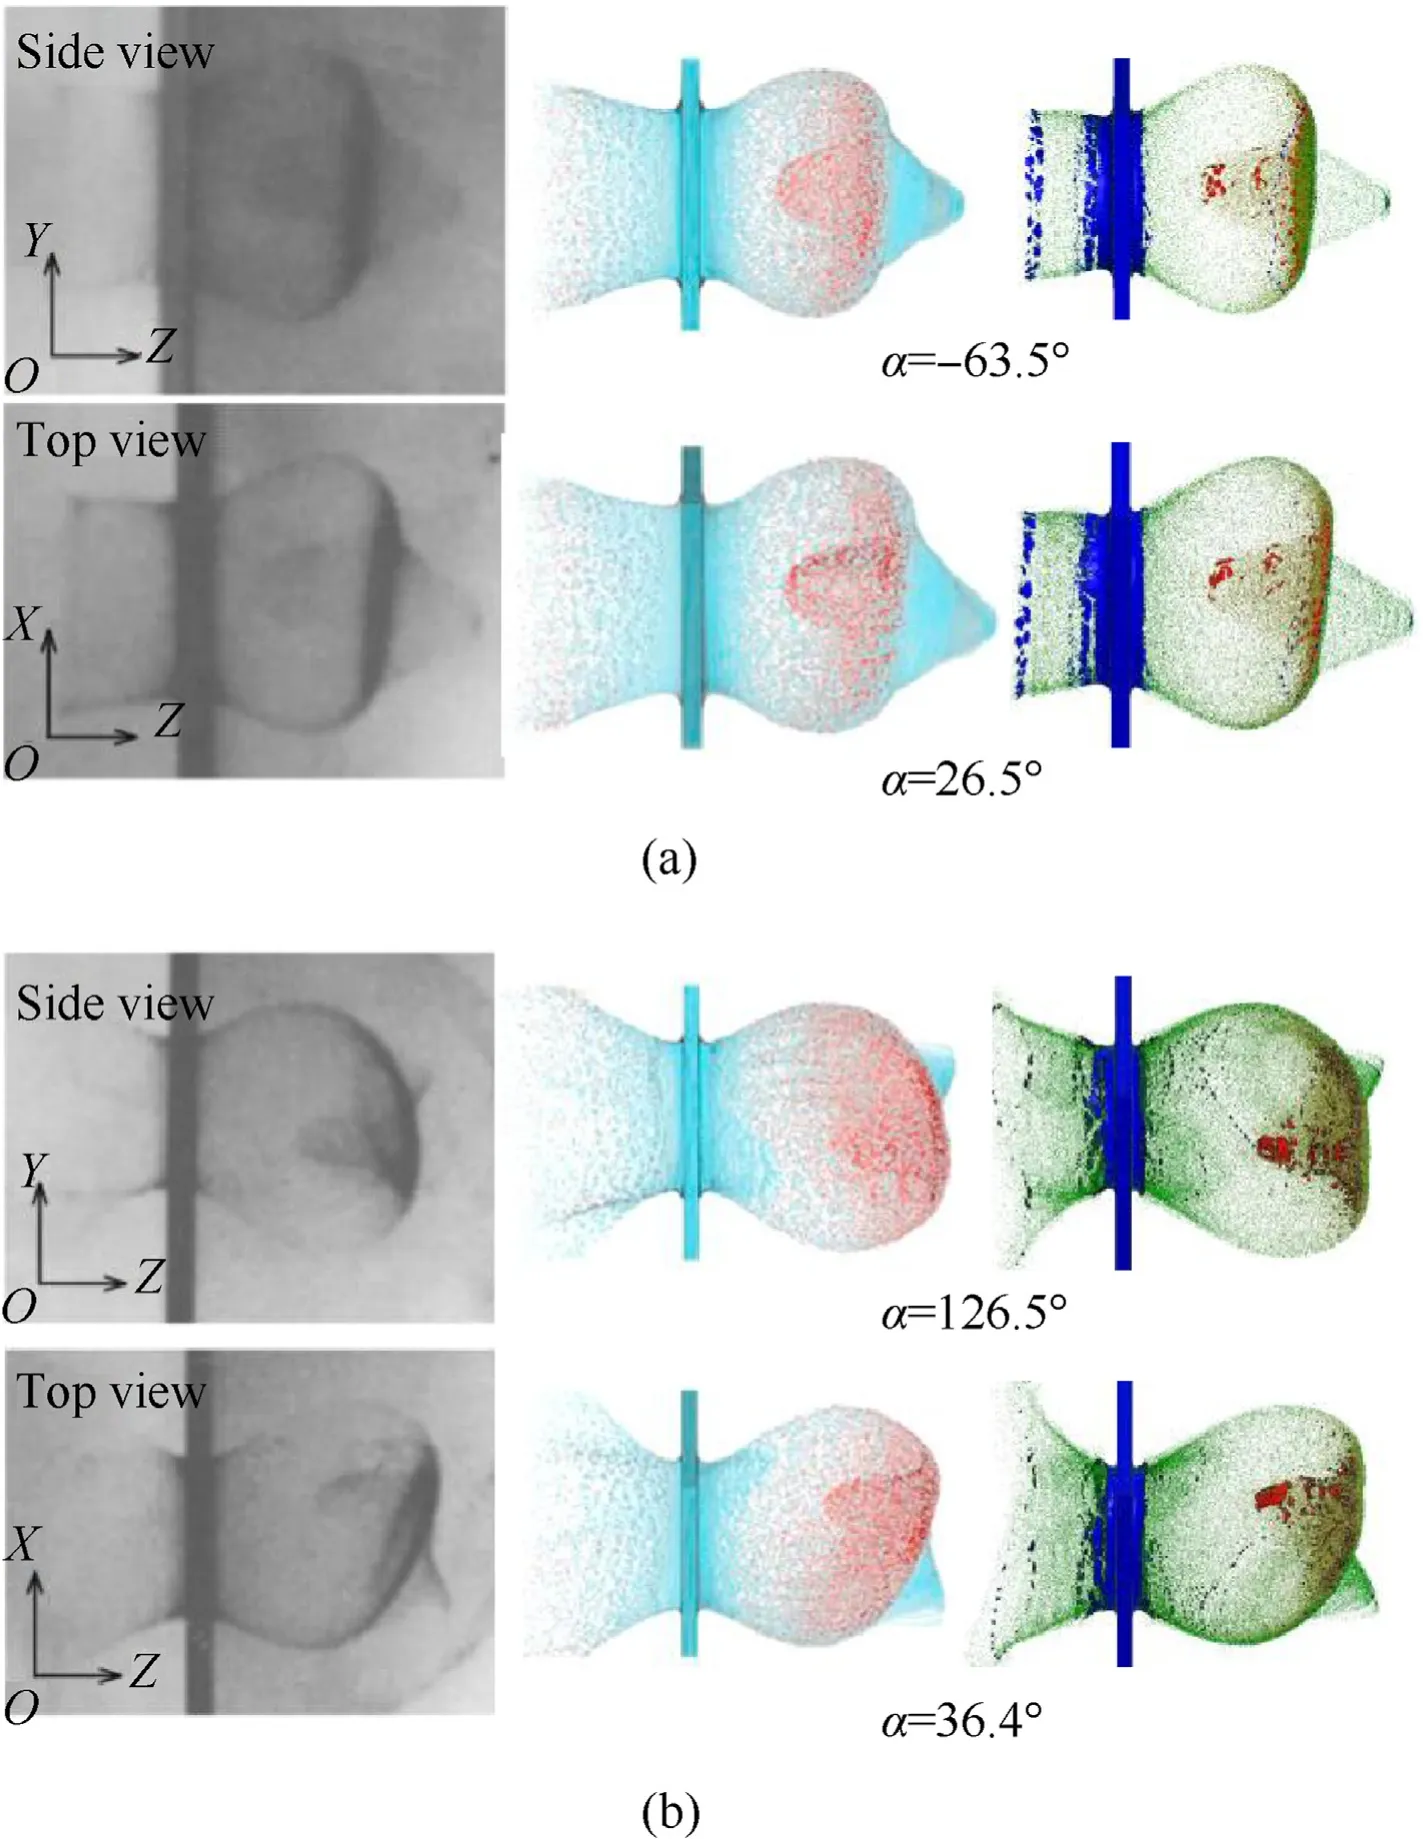
Fig.2.Results of experiment(left)[4],SPH method(middle)[9],and adaptive method(right)under reference view:(a)Experimental results and two simulation results of impact at 6.7° attack angle;(b) Experimental results and two simulation results of impact at 24.3° attack angle.
The outline of the debris cloud in the adaptive method results conforms to the experimental results.In the experimental and SPH calculation results,the location with deep color and high particle density is almost identical to the location of the elements representing the fragments in the adaptive method.Importantly,the adaptive method can intuitively obtain the morphological and location information of fragments.
During the impact,the head of the debris cloud consists of the front fragments formed by the isentropic unloading and stretching of the front plate.The head axial velocity of the debris cloud in the two simulation conditions and the results measured by the experiments are listed in Table 2.
The head velocity of the debris cloud obtained from the simulation is consistent with the experimental value.The FE-SPH adaptive method can recalculate the condition of hypervelocity yaw impact based on a comparison of the aforementioned debris cloud structure and the head velocity of the debris cloud.
3.2.Comparing the result of adaptive method with SPH method
The experimental results accurately reflect the structural characteristics of the debris cloud and the damaging effect of the debris cloud on the rear plate.However,owing to the extremely short duration,poor repeatability,and limitations in the diagnostic equipment,the HVI experiment cannot observe the formation process of the debris cloud and the distribution of fragments inside the debris cloud.It is difficult to conduct experiments under specific attack angle conditions due to limited launch conditions.Although the simulation results obtained by the SPH method [9]conform with the experimental results,only the material composition of each structure in the debris cloud and coarse distribution of debris density can be obtained initially.However,based on the accurate information of debris cloud structure that obtained by present model,the adaptive method can also obtain specific information,such as the shape,size,and location of the fragments more intuitively.Notably,the results obtained by the adaptive method below select the calculation results in the reference view,and the particles of the projectile and the target plate are set to the same color to highlight the distribution and size information of fragments in debris cloud.
Fig.3 is a comparison diagram of the calculation results of the adaptive method and the SPH method for different impacting conditions simultaneously.Fig.3(a)and Fig.3(b)correspond to 6.7°and 24.3°angles of attack respectively,where the upper and lower figures correspond to the simulation results of adaptive method and SPH method,respectively.It is evident that the debris cloud of the projectile accounts for the main part of the debris cloud structure,and it is the primary factor causing damage to the rear plate.The debris cloud presents the characteristics of annular distribution in the calculation results of the adaptive method.The main structure area (I),the cross-wing structure area (II),and the outer bubble structure area (III) [9] of the debris cloud can be clearly distinguished in different circles,including the density distribution of fragments in each area.Moreover,the size and shape information of fragments can also be obtained intuitively.
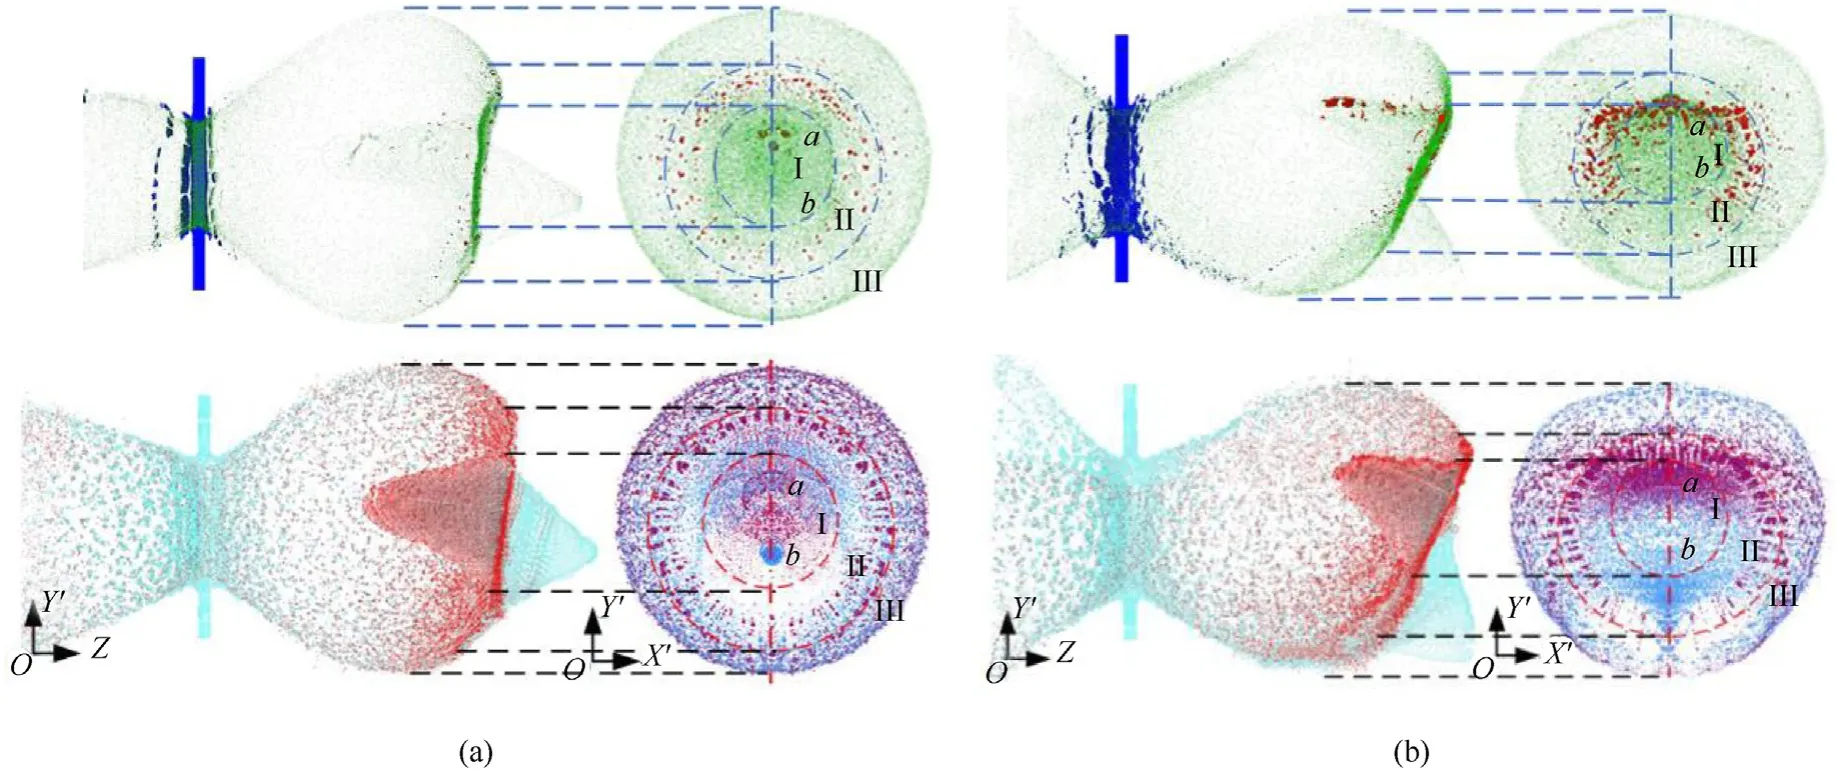
Fig.3.Comparison of debris cloud structure and fragments distribution simulated by adaptive method and SPH method [9] at 10 μs: (a) Result of adaptive method (up) and SPH method (down) in case 1;(b) Result of adaptive method (up) and SPH method (down) in case 2.
Under the impact condition of a 6.7°angle of attack,there was a strong shock wave in the direction of velocity,and the projectile was completely broken under the action of shock wave unloading and stretching,effectively dispersing the energy and mass of the fragments.Therefore,it does not significantly damage the rear plate.Under the impact condition of a 24.3°angle of attack,the sharp edge on one side of the projectile first contacted the front plate during the impact,which caused a strong shearing effect.Concurrently,larger fragments were concentrated on the initial impact surface,which weakened the shock wave effect,making the projectile unable to break completely.The concentrated distribution of fragment mass and energy poses a greater threat to the rear plate.
Combining the two cases: in the impact condition of a small attack angle,the front face of the projectile has a greater influence on the debris cloud structure,and the distribution of the fragment is relatively uniform.In the front cone of the debris cloud,the target material is completely broken and there are no large-sized fragments.In the inner cone,there are a small number of fragments of projectile,which are primarily distributed in the cross-wing.In the impact conditions of a large attack angle,the sharp edge of the projectile has a more significant influence on the structure of the debris cloud,the front cone and the inner cone are obviously misaligned,and the density and number of debris in the inner cone and cross-wing increase significantly.Moreover,a fracture elongation zone exists in the lower side of the cross-wing structure[4],a large number of fragments gather on the side that first contacts the target,and the density and size of fragments on the side of the last contact the target is much lower than the other side that first contacts the target.
Therefore,the calculation results of the adaptive method are in good agreement with previous results for the distribution law of the debris cloud under hypervelocity yaw impact.In addition,additional important information on fragment size and morphology can be obtained from these results.The FE-SPH adaptive method can be applied to conduct a detailed study on the influence of changing the attack angle on the structure of a debris cloud and the distribution characteristics of hazardous fragments.
4.Structure characteristics of debris cloud and distribution of hazardous fragments at different attack angles
To comprehensively investigate the influence of the attack angle on the debris cloud structure while maintaining the other conditions unchanged,the added cases within the range of 0°-90°angle of attack are listed in Table 3,where Case 1 and Case 3 are the reproduced experimental conditions.The results for the same time(10 μs)are shown in Fig.4.In Fig.4,typical views that can reflect the structural characteristics of the debris cloud are selected for analysis,which are all three-dimensional foldover images.The first column illustrates a cross-sectional view of theY'OZplane under the reference view,the second column depicts a view of the remaining debris after concealing SPH particles and debris near the target plate on theY'OX’ plane,and the third column shows the hazardous fragments on theY'OX’plane,which are screened out by a specific criterion.This criterion is explained in detail below.It should be noted that the following analysis is based on the parameters of the attack angles in this simulation experiment.

Table 3 Simulation experiments under different angles of attack.
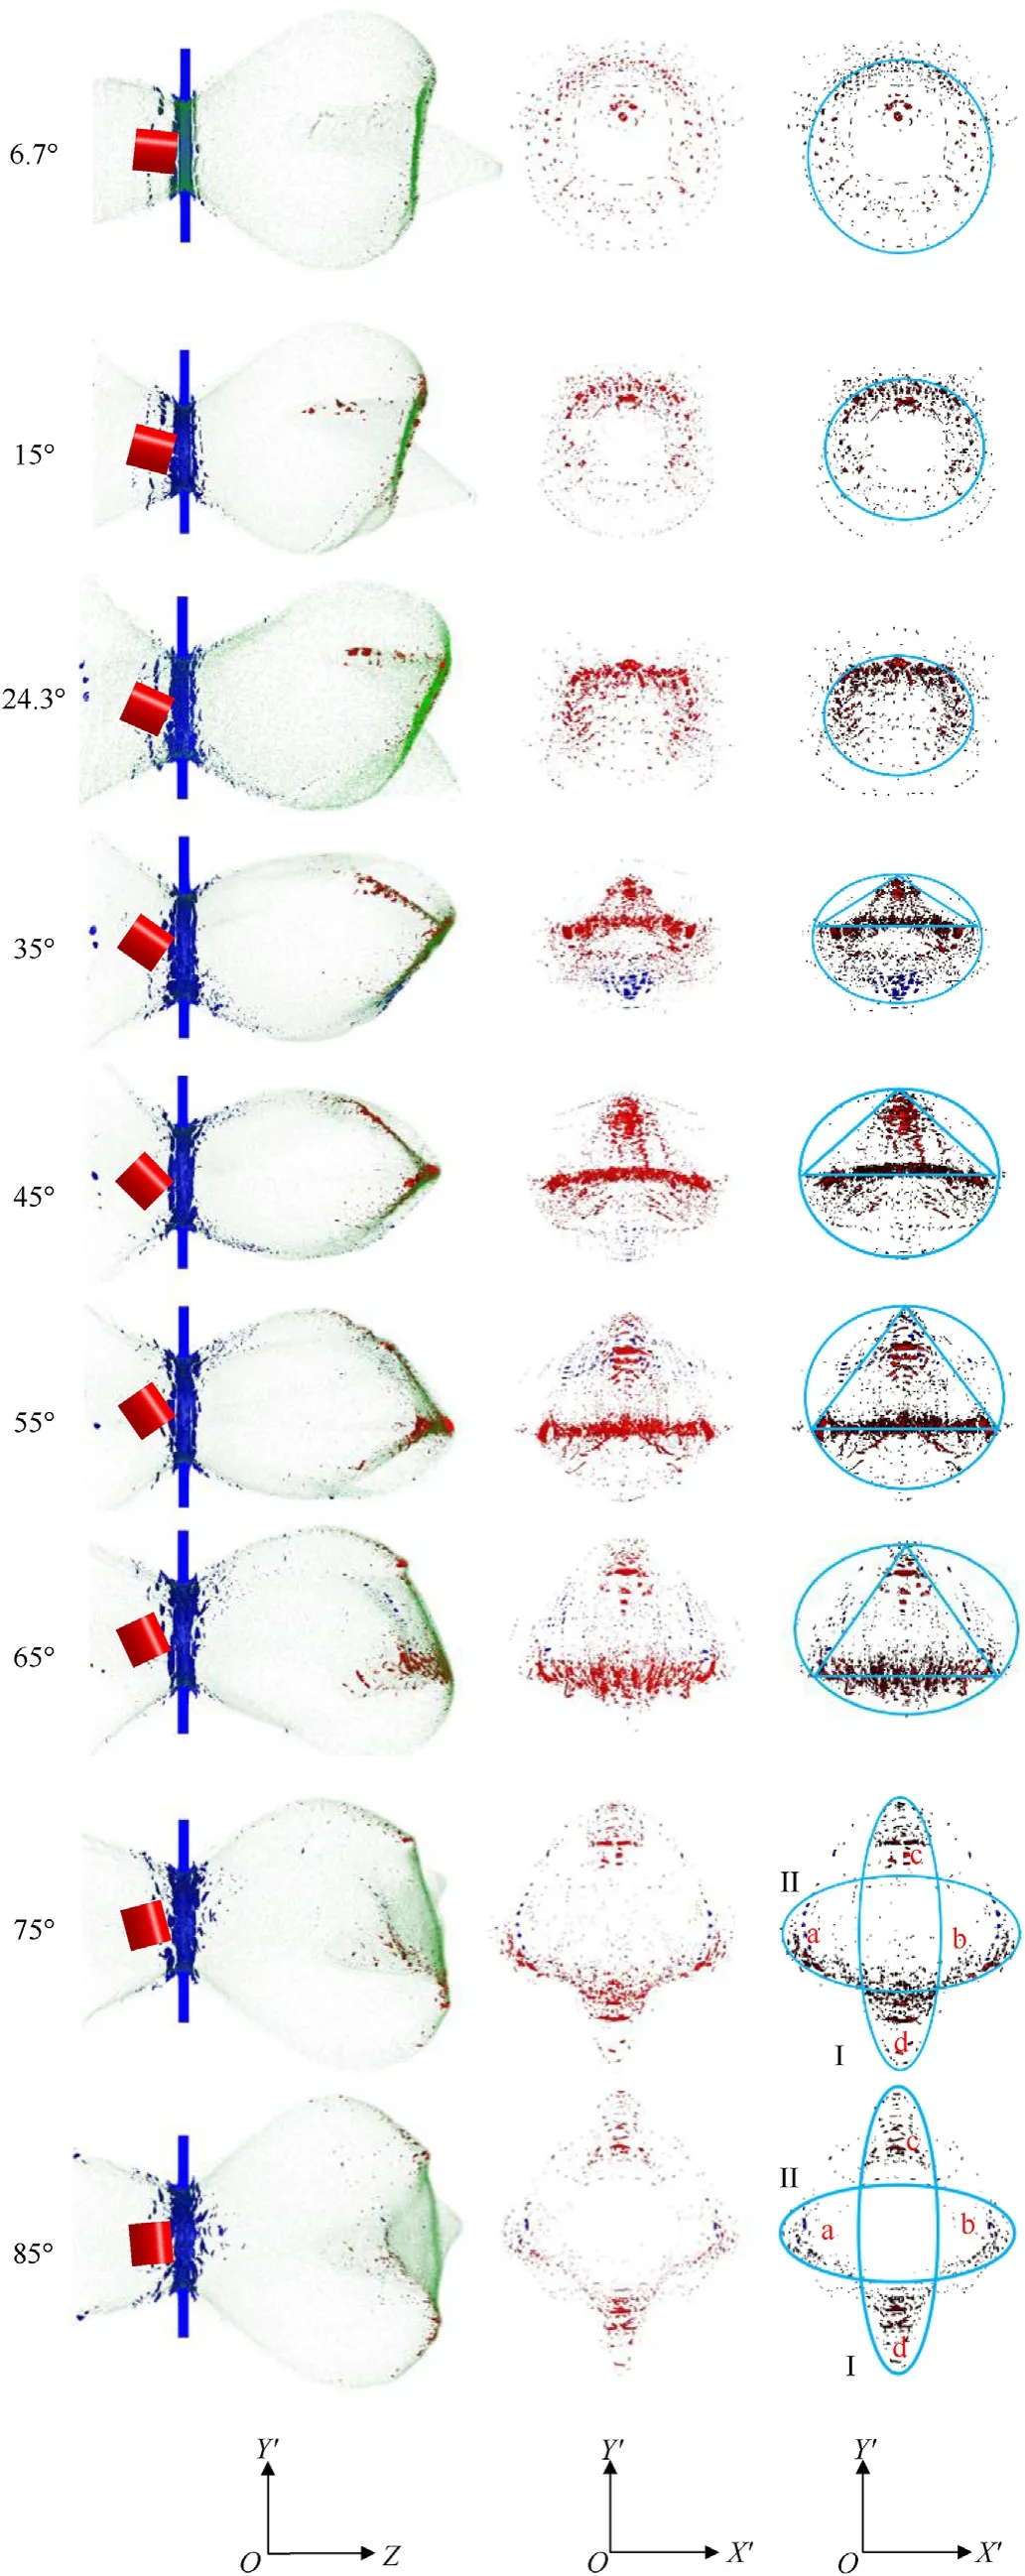
Fig.4.Results of debris cloud and fragments distribution at 10 μs (The left is a crosssectional view on the Y'OZ plane;the middle is the remaining debris after concealing SPH particles and debris near the target plate on the Y'OX’ plane;the right is the distribution of hazardous fragments).
4.1.Structure characteristics of debris cloud under different attack angle
Ignoring the slight influence of the different initial velocity in Case1,then combining the first and second columns of Fig.4,it was found that when the angle of attack was between 6.7°and 24.3°,the debris cloud structure was primarily composed of the front cone,inner cone,and outer bubble.The fragments are largely distributed in the inner cone and cross-wing structures,which indicates the characteristics of the annular distribution.As the attack angle increases,the front cone and inner cone structures become misaligned,and the position of the front cone moves down.The number of fragments in the inner cone and cross-wings increases,the fragment density on the side where the projectile first contacts the target is greater than that on the other side,and the accumulative effect becomes increasingly obvious.The variation in the debris cloud structure with the angle of attack within this range is consistent with the analysis results of Zhang et al.[9].
Furthermore,when the angle of attack is between 35°and 55°, the front cone and inner cone structure disappear,and the overall structure of the debris cloud shrinks significantly in the radial direction,which is perpendicular to the impact direction.The fragments were mostly distributed on two planes that formed a certain angle with theX’OZplane.The density and quantity of the fragments reached a maximum at the intersection of the two planes,to be precise,near the edge of the projectile.As the angle of attack increases,the fragment distribution area on the side where the projectile first contacts the target gradually increases,the fragments near the sharp edge gradually move downward,and the fragments distribution area and the number of fragments on the side where the projectile last contacts the target gradually decreases.Within this range of attack angles,the size and number of target plate fragments at the 35°attack angle were significantly greater than those of the other cases.
The angles between the two planes where the fragments were located are shown in Fig.5.More specifically,Fig.5(a) shows a schematic of the initial condition,where θ is the angle of attack.Fig.5(b) shows the foldover image of the remaining debris after concealing SPH particles and debris near the target plate on theY'OZplane,where θ1denotes the angle between the two planes and θ2is the angle between the under plane and theY′axis.As the attack angle increases,θ1gradually increases and approaches the vertica relationship;θ2is closer to the angle between the front face of the projectile and the target at the initial moment,that is,the attack angle.It should be noted that the measured angles θ1and θ2in Fig.5(b) are roughly evaluated just according to the fragment attribution of the debris cloud,in which only the hazardous fragments (i.e.,FE elements) are considered after concealing SPH particles.It qualitatively reflects the approximate relation between the fragment attribution of the debris cloud and the attack angles.In general,the measured values of the angles perhaps change a little somehow if we improve the mesh resolution or change the mesh element type,but we think the corresponding physical trend is stable .
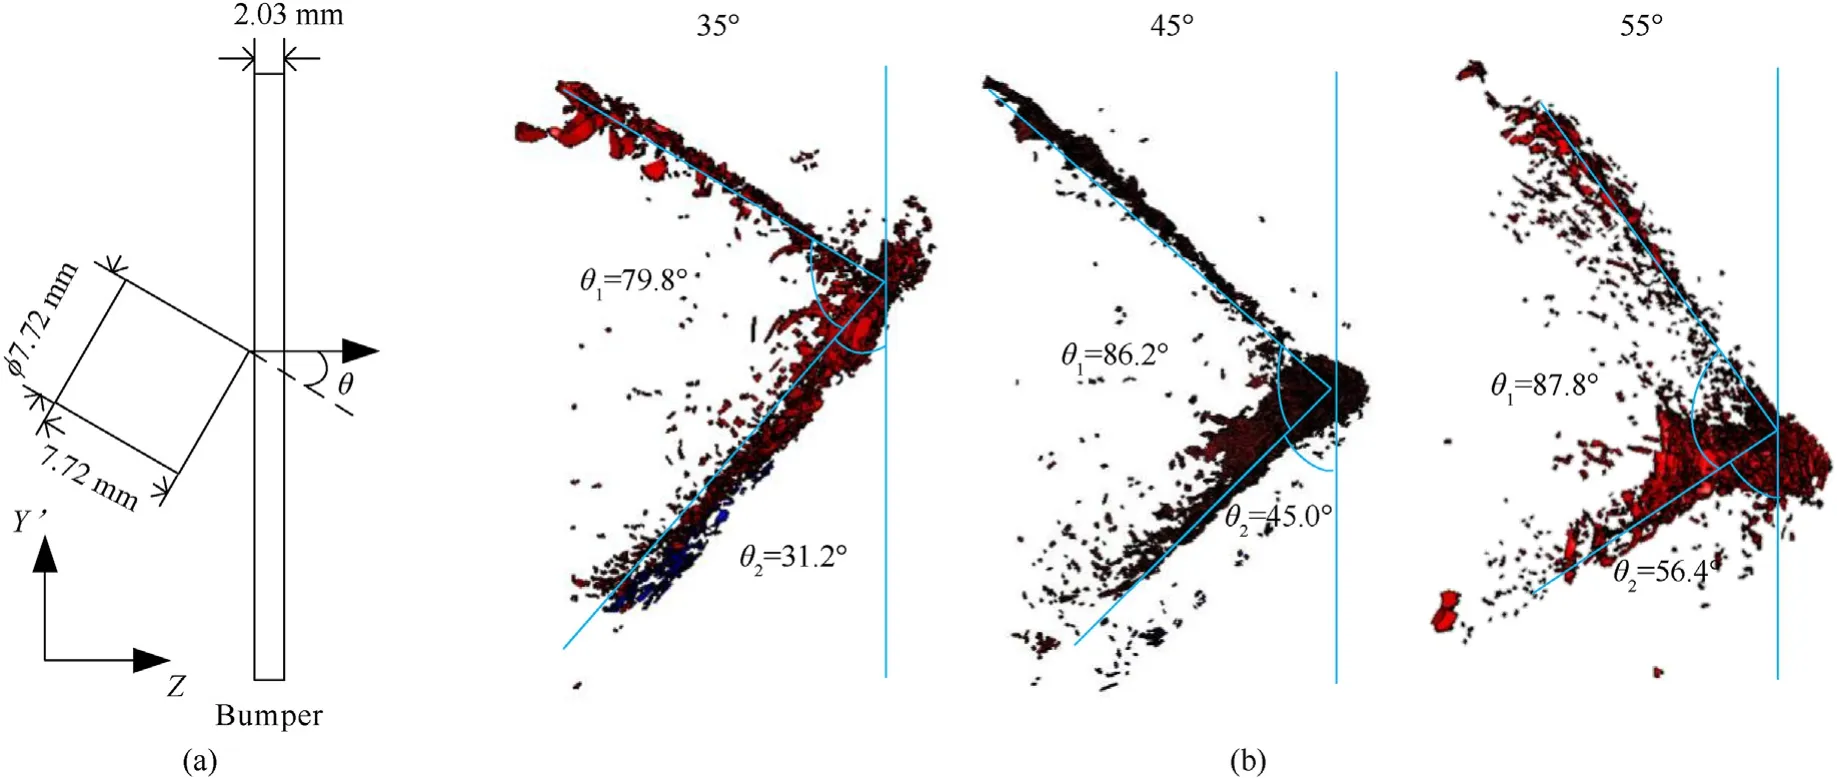
Fig.5.The angle between two planes where the fragments are located at 35°-55° cases: (a) Sketch of initial attack angle;(b) Angle between different planes at 35°-55° cases.
As the angle of attack further increased,in the range of 65°-85°,the overall structure of the debris cloud also increased significantly,and the inner and outer cone structures reappeared.The fragments were largely distributed near the intersection of the outer bubble and inner cone,and the density and size of the fragments were significantly reduced.As the attack angle increased,the size of the fragments gradually decreased,and the fragment distribution became more uniform and symmetric.
Over the entire range of attack angles,there are three different structural characteristics of the debris cloud: the front cone,the inner cone,and the outer bubble at a small attack angle,the two intersecting planes and the outer bubble at a larger attack angle,and the inner and outer cones are reproduced at a greater attack angle.As the angle of attack increases,the radial distribution range of the debris cloud tends to first decrease before increasing.
Importantly,the density and size of the fragments generated by the projectile at attack angles of 35°-55°were significantly greater than those in other cases.From this,we can preliminarily infer that under the same conditions,the debris cloud generated by the cylindrical projectile at an angle of attack between 35°and 55°had the ability to inflict greater damage on the rear plate than in the other cases.
4.2.Distribution characteristic of hazardous fragments under different attack angle
The debris cloud can penetrate the rear plate because of the impact of a single larger fragment or multiple adjacent fragments and the cumulative damage effect of the fragments at the same position of the rear plate.In fact,not all fragments cause serious damage to the rear plate,and fragments with serious threats need to be screened out by the threshold,and the change in their distribution characteristics with the attack angle must be analyzed.
Incorporating the advantage of the adaptive method,we can clearly obtain the fragment boundaries and identify the elements representing the fragments and then calculate the location,mass,and velocity information of each debris.Considering the analysis method of the rear plate damage situation in Ref.[28],the criterion for selecting hazardous fragments involves determining whether a single fragment that hits the rear plate can form a crater with a diameter greater than 0.5 mm.When the difference in the shape of the fragments is ignored and the fragments are considered to be spheres,the linear model of the crater diameter formed by the aluminum ball impacting the aluminum plate in Ref.[36] is as follows:
where
In Eq.(4),Dc denotes the diameter of the craters,ddenotes the equivalent sphere diameter of the fragments,vcorresponds to the velocity of the fragments,and the constants α=1.5,σ=0.51,and κ=1.60.The diameter of the craters (Dc) was set as 0.5 mm.The minimum equivalent sphere diameter of the fragment at different velocities was obtained,and the mass threshold value was calculated.
The hazardous fragment screening criterion adopted in this study is that the fragments can cause obvious craters or more serious damage to the back plate;the fragments that may penetrate the rear plate (fragments with an equivalent sphere diameter greater than 1 mm)are called dangerous fragments.Accordingly,it is assumed that the SPH particles representing tiny fragments are uniformly distributed and do not damage the rear plate.
The movement of the debris cloud between the two plates can be divided into two stages: formation and expansion.In the previous stage,the projectile and target were continuously broken,and the collision between the fragments caused the mass and speed of the fragments to continuously change.In the second stage,the debris cloud reached a steady state,where the projectile and target materials were no longer broken,and the mass and speed of each fragment remained almost unchanged.In this study,the criterion of the debris cloud with steady state defines that the sum of the squares of the momentum components of all fragments on the reference coordinate axis within a 0.5 μs interval does not exceed 5% [27].
When analyzing the hazardous fragments at steady state(Fig.4,right),there are three different distribution characteristics within the entire range of attack angles: the annular distribution at 6.7°-24.3°attack angles;the hazardous fragments are distributed in two intersecting planes at 35°-65°attack angles;and the hazardous fragments are distributed on the surface of two perpendicularly intersecting ellipsoids at 75°-85°attack angles.Each distribution characteristic exhibits a law with an increase in the angle of attack.
When the attack angle is in the range of 6.7°-24.3°,the hazardous fragments are significantly affected by the impact of the front plane of the projectile,which results in an annular distribution.Hazardous fragments are largely distributed near the blue ellipse in Fig.4 (right),which is affected by the sharp edges of the projectile,and the fragment density in the upper half is greater than that in the lower half.As the attack angle increased,the accumulative effect was evident,the fragment distribution range decreased,and the elliptical distribution shape gradually tended to be oblate.
When the attack angle is in the range of 35°-65°,the sharp edges of the projectile have a significant impact on the distribution characteristics of hazardous fragments.All hazardous fragments are distributed in an elliptical form.Indeed,the fragments close to the sharp edge of the projectile divided the ellipse into upper and lower parts.The fragments in the upper part of the ellipse are distributed in a triangular area.In this area,the hazardous fragments were mostly concentrated at the bottom and top corners of the triangle,and the number and concentration of fragments near the bottom side were the largest throughout the entire range.The fragments were more evenly distributed in the lower part.As the angle of attack increased,the area of the triangle increased,and the position of the hazardous fragments near the bottom gradually moved downward.The degree of aggregation first increases before decreasing,reaching a maximum at an attack angle of 45°.The top of the triangle is another concentrated area of hazardous fragments,where the change rule of the number of fragments is consistent with the change rule of the degree of hazardous fragment accumulation near the bottom of the triangle.The uniformity and number of hazardous fragments in the lower half of the ellipse both decreased with an increase in the angle of attack.
When the attack angle is in the range of 75°-85°,during the initial impact,the curved surface of the projectile is the main factor that significantly influences the distribution characteristics of hazardous fragments.Under this condition,the hazardous fragments were largely distributed in the range of the two intersecting ellipses.Owing to the weak influence of the sharp edge,both the number and density of hazardous fragments in the lower half of transverse ellipse II are greater than those in the upper half.The fragments in longitudinal ellipse I are primarily distributed in areas c and d,and the debris density in area c is slightly lower than that in area d.As the angle of attack increases,it is evident that the number of hazardous fragments in the area where the two ellipses intersect is reduced and there are almost no fragments.Besides,the fragments distributed in areas a,b,c,and d are more uniform and symmetrical.
4.3.Size-quantity distribution of hazardous fragments
The equivalent spherical diameter of the hazardous fragments was selected to quantitatively describe the hazardous fragments and intuitively reflect the size of the hazardous fragments.The segmentation statistics were carried out a 0.2 mm step length,and then the number of different equivalent diameter fragments under different attack angles was calculated,as shown in Fig.6.
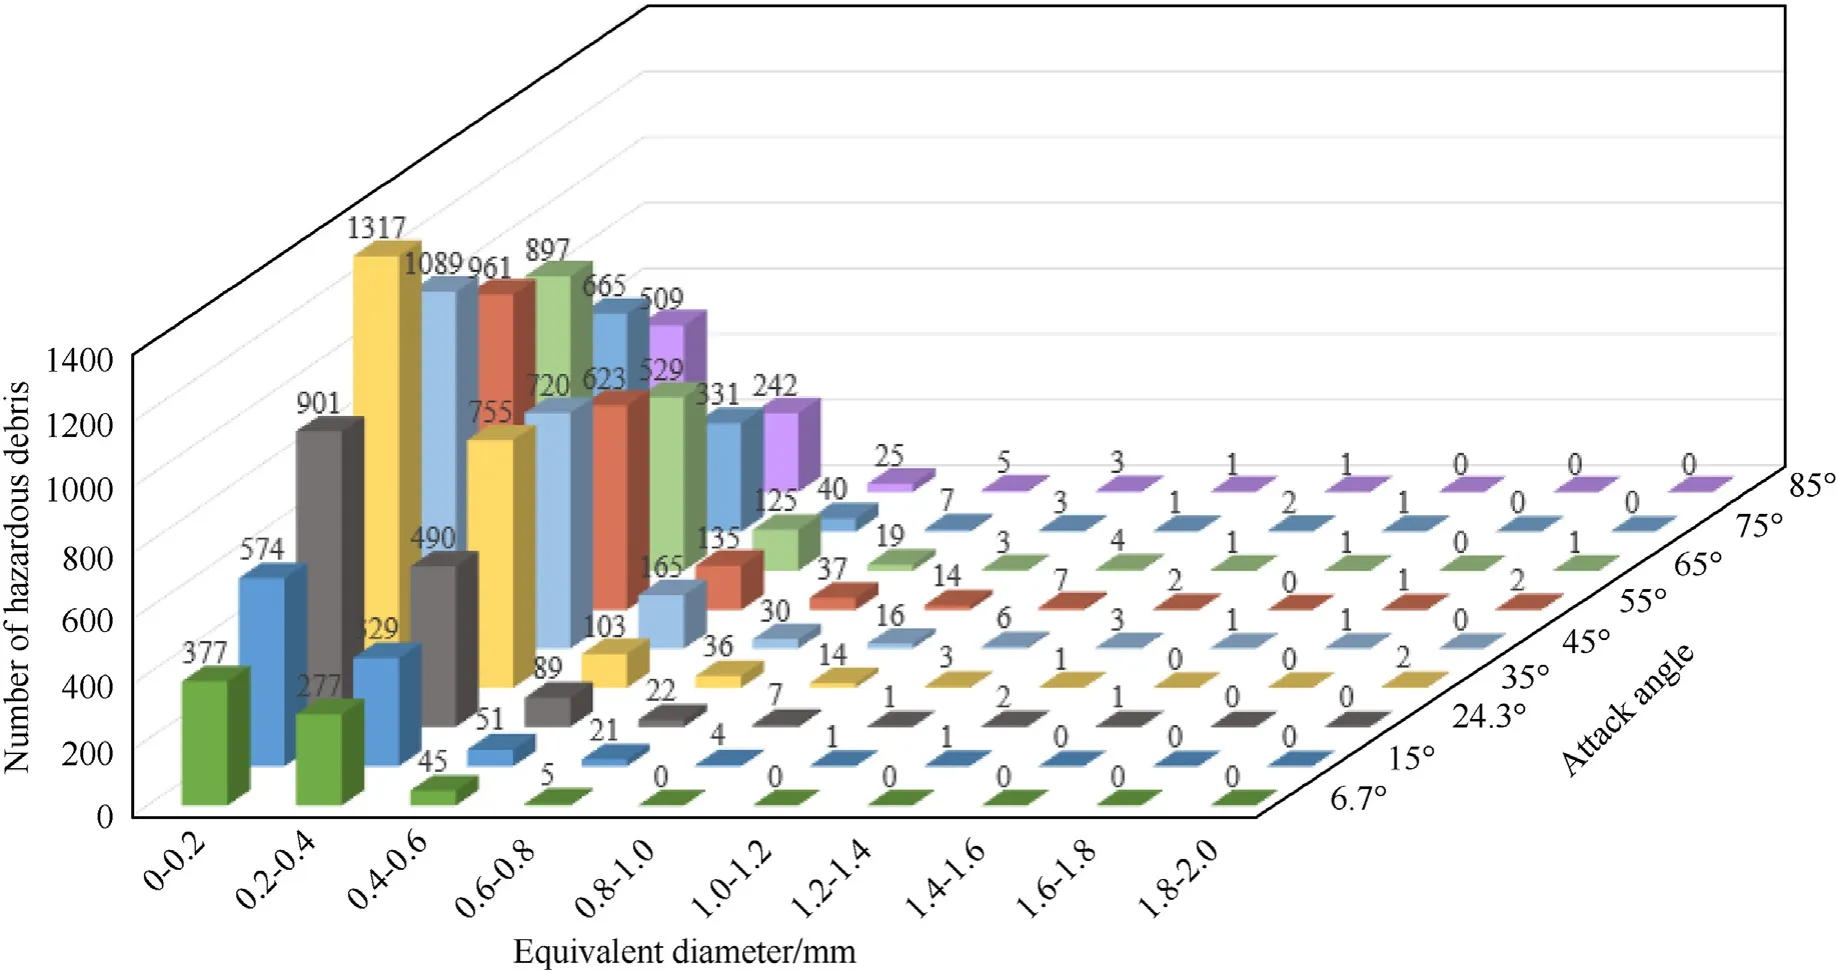
Fig.6.The number of different equivalent diameter fragments under different attack angle.
Hazardous fragments of different equivalent diameters are primarily distributed in the range of 0-0.4 mm.When the equivalent diameter is greater than 0.4 mm,the number of hazardous fragments decreases sharply.Only a very few dangerous fragments with an equivalent diameter greater than 1 mm are concentrated in the attack angle range from 35°to 65°.
As the angle of attack increased,the number of hazardous fragments in different equivalent diameter ranges first increased and then decreased,reaching maximum at an attack angle of 35°.When the attack angle is in the range of 6.7°-35°,the number of hazardous fragments with different equivalent diameters increases faster as the angle of attack increases.When the range of attack angle is 35°-65°,the number of hazardous fragments with different equivalent diameters increases slowly as the attack angle increases.When the angle of attack is greater than 65°,the number of hazardous fragments with different equivalent diameters decreases faster.
The curves in Fig.7 illustrate the total number of hazardous fragments (blue curve) and the number of dangerous fragments with an equivalent diameter greater than 1 mm (orange curve) at different attack angles.The number of hazardous fragments at 35°was the highest (2231).The number of dangerous fragments was small and mostly distributed at 45°(11)and 55°(12)attack angles.
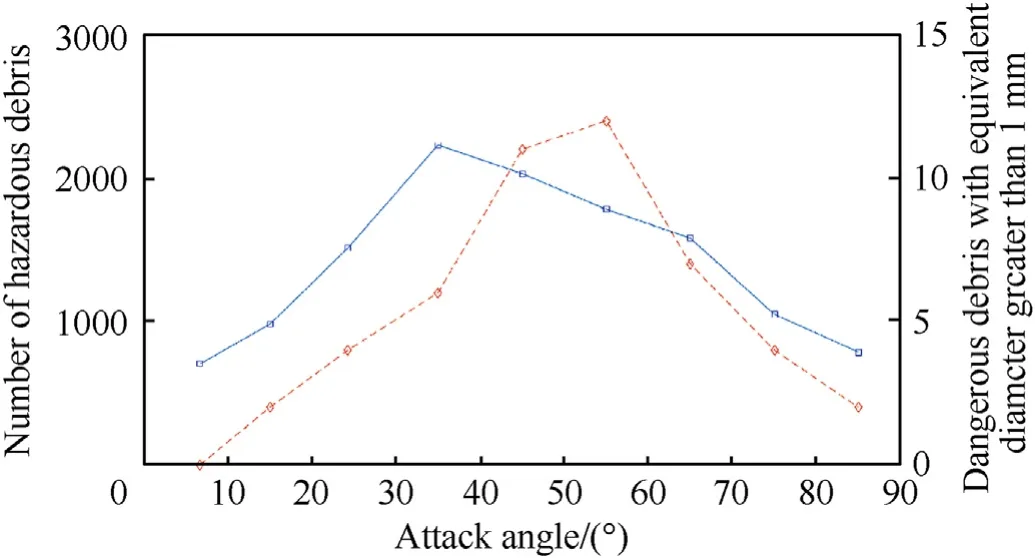
Fig.7.Variation curve of the number of hazardous fragments and dangerous fragments with the attack angle.
Based on an analysis of the outstanding advantages of the adaptive method,the cases of projectiles impacting the plate at different attack angles are calculated in this section.Moreover,the change rule of the debris cloud structure and hazardous fragment distribution with respect to the attack angle are obtained.Furthermore,a statistical analysis of the number of hazardous fragments with different equivalent sphere diameters under different attack angles revealed that the number of hazardous fragments at an attack angle of 35°was the largest.
5.Distribution and energy density of hazardous fragments in velocity space
As the angle of attack increases,the front plate,sharp edges,and curved surfaces of the projectile have different effects on the structure of the debris cloud in the initial stage of impact,resulting in multiple debris cloud structures and hazardous fragment distribution characteristics.However,in such cases,it is difficult to describe these structures uniformly because of the irregular structure of the debris cloud.However,the distribution of hazardous fragments significantly affects the damage to the rear plate,and thus it is necessary to discuss the distribution of hazardous fragments.
He et al.[28] adopted the concept of velocity space to describe the distribution range of hazardous fragments under completely symmetrical conditions using the maximum velocity angle.However,it is necessary to consider the distribution discrepancy in different directions in the case of an asymmetric structure of hazardous fragments,particularly when using the velocity angle to describe the distribution range of the fragments.The description of the distribution range of asymmetric hazardous fragments is discussed in detail below.Moreover,based on the energy density distribution within this range,the damage ability of hazardous fragments to the rear plate can be quantitatively analyzed.The quantitative analysis will be an effective guide for actual engineering design of spacecraft bulkheads.
5.1.Distribution of hazardous fragments in the velocity space
Calculate the position,velocity,and size information of the identified hazardous fragments,which are then analyzed by the velocity space and velocity angle [28].It should be noted that the traditional position space coordinate axis is the physical position of the fragments in thex,y,andzdirections;the velocity space is the velocity component information of each fragment in the three directions,corresponding tovx,vy,andvz,respectively.
In the first stage (formation) of the debris cloud,the number,mass,velocity,and location of the fragments constantly change,and the fragments in the location space and velocity space change with time.As a result,it is difficult to analyze effectively.When the debris cloud is in the second stage (expansion),the quantity and velocity of fragments are stabilized,and the physical information in the location space is also dynamic,which cannot reflect the movement state of fragments.In velocity space,the time variable can be ignored,and a stable distribution of hazardous fragments can be obtained.The velocity angle (between the speed of the hazardous fragments and the positive direction of theZ-axis) is calculated by mapping the fragments into the velocity space as points.
For hazardous fragments generated by the impact in a completely symmetrical condition,the cone can describe the distribution range of hazardous fragments on the rear plate,which is described by the parameter of maximum velocity angle θmaxat the initial impact point [28].For the debris cloud generated by the asymmetrical condition or more complex structure of the projectile,the distribution of hazardous fragments is messier.Obviously,a single maximum velocity angle cannot describe the distribution range of hazardous fragments.Therefore,it is necessary to analyze the distribution range of hazardous fragments in different directions.
Considering the selected hazardous fragments in Fig.4 of this numerical simulation as an example,the distribution difference of the hazardous fragments in theX′andY′directions is considered.The velocity angle component of each hazardous fragment on theX'OZandY'OZplanes is calculated.The maximum values of the different velocity angle components (Φ,Ψ) are the parameters of the elliptic cone to describe the distribution range of hazardous fragments under asymmetric conditions.The maximum values of the velocity angle components are presented in Table 4.

Table 4 The maximum velocity angle components on the X’OZ (Φ)and Y’OZ (Ψ) planes.
Considering that there may be some fragments with little energy at the edge of the hazardous fragments,and these low energy fragments will not pose a significant threat to the rear plate,however,the fragments have a large velocity angle,which affects the analysis of the debris distribution range.Using the definition of θ99in Ref.[28],the energy remaining after removing the edge hazardous fragments accounts for 99% of the total energy of the original hazardous fragments to move out of the hazardous fragments at the edge.
The difference in the maximum velocity angle component of hazardous fragments on the two planes is used to describe the change in its asymmetric distribution range for a uniform attack angle.The elliptical cone was conducted using the parameters of the two velocity angle components (Φ,Ψ) as shown in Fig.8.The final position of the hazardous fragments on the rear plate can be derived from their distribution in the velocity space[28].In Fig.8,Oindicates the initial impact point,theZaxis is the direction of impact,andLdenotes the distance from the initial impact point to the rear plate.In the ellipse,the length of the long axis isa=L×tanΦ,and the length of the short axis isb=L×tanΨ,where is the distribution range of hazardous fragments on the rear plate.
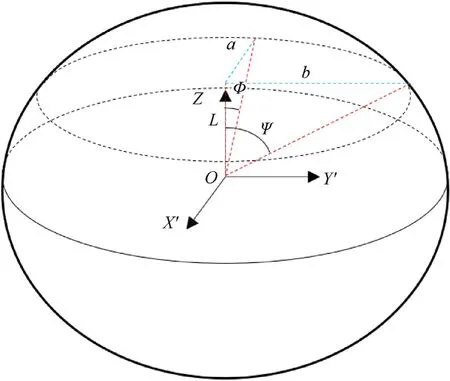
Fig.8.Schematic of the distribution range of hazardous fragments.
The velocity and distribution shown in Fig.9 were obtained by introducing an elliptical cone into the velocity space of the filtered hazardous fragments.It is evident from Fig.9 that in addition to the filtered hazardous fragments,the elliptical cone can describe the distribution range of hazardous fragments,accounting for 99% of the total hazardous fragment energy.It is intuitive that the elliptical cones at attack angles of 24.3°and 35°are smaller than those in the other cases.

Fig.9.The velocity and distribution of the hazardous fragments under different attack angle.
The analysis results showed that the change in the maximum velocity angle components with the attack angle can reflect the law of the hazardous fragment distribution range with the attack angle.As shown in Fig.10,the green curve represents the changing trend of Ψ (Y’OZ) under different conditions,and the blue curve represents the changing trend of Φ (X’OZ) under different working conditions.Indeed,the distribution range of hazardous fragments first decreases and then increases with an increase in the attack angle,reaching the smallest value near the attack angle of 35°.
5.2.Distribution of the energy of the hazardous fragments
Based on the distribution characteristics of hazardous fragments,calculating the energy density distribution within the distribution range can quantitatively analyze the damage ability of hazardous fragments.A schematic of the projection of the energy of the fragments onto a spherical surface is shown in Fig.11,where the 2Φ and 2Ψ are twice as large as the maximum velocity angle projected on theX'OZandY'OZplanes respectively,the radian of each grid side is π/180,and the distance from the impact point to the rear plate(the radius of the sphere)is 107.93 mm.Accordingly,the grid side length is approximately 1.88 mm.
The velocity angle and kinetic energy of each hazardous fragment in steady state was calculated(10 μs).The kinetic energy was projected onto the corresponding grid on the spherical surface to calculate the kinetic energy density of each grid,as shown in Fig.12(kJ/mm2).Evidently,the kinetic energy density of hazardous fragments under 35°-65°attack angles is greater than that of other attack angles.In this range,except for several special grids with extremely high energy compared to other areas,the kinetic energy in numerous grids with serious threats is in the range of 2-8 kJ/mm2.It should be noted that the maximum kinetic energy occurs in the case of a 35°attack angle.The two highest-energy columns are 13.638 kJ/mm2and 15.055 kJ/mm2from left to right,respectively,while the kinetic energy density in other areas is lower than 6 kJ/mm2.
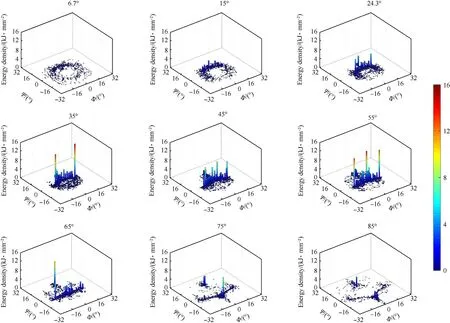
Fig.12.Energy density distribution of hazardous fragments under different attack angle.
Overall,with an increase in the attack angle,the distribution characteristics of the kinetic energy density were essentially the same as the aforementioned distribution characteristics of the hazardous fragments.The comparison of Figs.4 and 12,indicates that in the range of 6.7°-24.3°attack angles,the kinetic energy density at the upper side of the elliptical distribution range is significantly greater than that at the lower side.As the attack angle increases,the kinetic energy density at the upper side increases and gradually concentrates,whereas the energy density in the remaining areas is reduced,and the distribution is sparse.When attack angles are in the range of 35°-65°,the kinetic energy density is primarily concentrated at the bottom and top of the triangular distribution area.As the angle of attack increases,the kinetic energy density concentration area at the bottom of the triangle gradually moves downward and the kinetic energy density gradually decreases.As the attack angle increases further,in the range of 75°-85°,the areas with higher kinetic energy density are mostly distributed in areas c and d,as shown in Fig.4.There are only a few grids with higher kinetic energy density,and the remaining grids with little kinetic energy density hardly damage the rear plate.
In Fig.12,the kinetic energy density in a few grids are much greater than that of the surrounding grids,it is a critical factor that cannot be ignored,and it will have a certain impact on the assessment of damage areas and the analysis of energy density distribution changes.Considering the 24.3°case of the penetrating rear plate in the experiment as an example (Fig.13),the sharp increase in the kinetic energy density at‘a’and‘b’areas was caused by the impact of a large fragment and a very small number of small fragments in the area where the kinetic energy density is much larger than that of the surrounding grids,which are 5.85kJ/mm2and 5.65 kJ/mm2respectively.
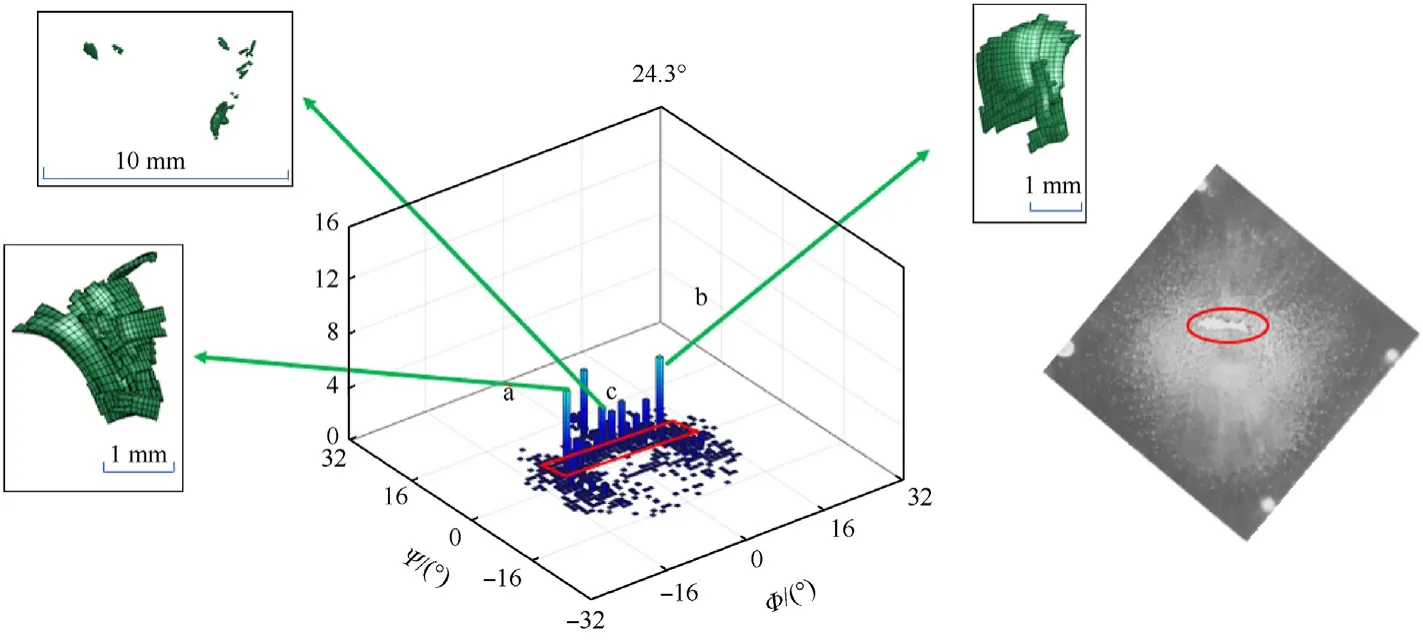
Fig.13.Distribution characteristics and comparison of kinetic energy density in a local area under 24.3° attack angle.
Based on the geometric characteristics of the fragments,three characteristic dimensions were selected to describe their shapes[37].DimensionAis the largest sized fragment,the length isL1;dimensionBis the maximal length on the plane perpendicular to dimension A,the length isL2;and dimension C is the maximum length in a direction perpendicular to both dimensions A and B,and the length isL3.The three dimensions of the maximum fragment at‘a’ were 0.301,0.254,and 0.108 cm,respectively;the three dimensions of the maximum fragment at ‘b’ were 0.288,0.214,and 0.119 cm,respectively,where the dimensions ofAandBare much larger than dimensionC,which is characteristic of disc shape.These large fragments cause a sudden increment in the kinetic energy density.In the numerous grids with higher kinetic energy density in the figure,taking ‘c’ as an example,the primary reason for the high kinetic energy density in these grids is the result of accumulative damage of a large amount of debris.Importantly,comparing the experimental results of the same case (Fig.12,right) [4]revealed that the position and shape of the higher energy concentrated distribution area in the red box were essentially the same as the hole on the rear plate in the experiment.The analysis of the kinetic energy density in Fig.12 can be considered to infer that when the attack angle is greater than 24.3°and less than 65°,hazardous fragments are more likely to penetrate the rear plate and cause more serious damage to the rear plate.
This section analyses the hazardous fragments in the steady state through the velocity space.First,the maximum velocity angle component was used to analyze the variation in the distribution range of the hazardous fragments with the attack angle,and an elliptical cone was used to describe the distribution rang uniformly.Lastly,we calculated the kinetic energy density within the distribution range of hazardous fragments.Collectively,the fact that the number of risky debris is the highest at the 35°attack angle in the fourth section combined with the conclusions in this section that the hazardous fragment distribution range at the 35°attack angle is the smallest and the kinetic energy density is the largest,indicates that the hazardous fragments near the 35°attack angle have the most powerful ability to damage the rear plate.
6.Conclusions and discussions
This study discusses the influence of different attack angles on the debris cloud and the distribution of hazardous fragments by simulating a cylindrical projectile impacting a thin plate using the FE-SPH adaptive method.
First,the FE-SPH adaptive method was used to recalculate the cases of cylindrical projectiles those impact the thin plate at attack angles of 6.7°and 24.3°.The reliability of the adaptive method was verified by comparing experimental and SPH results.More importantly,the distinct advantage of the adaptive method is that the size,position,and morphology of the fragments can be obtained directly compared with the SPH method.
Based on the remaining parameters,attack angles of 15°,35°,45°,55°,65°,75°,and 85°were added.The results showed that the structure of the debris cloud changed significantly as the angle of attack gradually increased,and the number and density of the fragments first increased and then decreased.It is preliminarily inferred that the debris cloud has a greater ability to damage the rear plate when the attack angles are between 35°and 55°.Subsequently,the hazardous fragments were screened using specific criteria,and the distribution characteristics and relationship between the number of hazardous fragments of different sizes and the attack angle were analyzed.The results showed that the number of hazardous fragments at an attack angle of 35°was the largest.
Finally,the velocity angle is extended from completely symmetrical to asymmetrical conditions to describe the distribution range of hazardous fragments using the concept of velocity space.The result showed that the distribution range of hazardous fragments was smallest at a 35°attack angle.Simultaneously,the damage ability of the hazardous fragments was quantitatively analyzed by calculating the kinetic energy density.These results indicate that hazardous fragments near the 35°attack angle have the strongest ability to damage the rear plate.
Based on the work carried out in this research,simulation experiment of the hazardous fragments impacting the rear plate can be conducted using the linear mapping method,to expand,supplement,and support the conclusion of this work.Moreover,further analysis of the damage of the hazardous fragments to the rear plate can provide a reference to optimize the rear plate structure.
In this study,the FE-SPH adaptive method was used to simulate the HVI problem of a cylindrical aluminum projectile impinging on a thin aluminum plate at an attack angle.The highlights are as follows:1.Expand the concept of the maximum velocity angle from a single variable used to represent the hazardous fragments in a completely symmetrical structure to two variables use to characterize the hazardous fragments of asymmetric structures and widen the scope of application.2.The kinetic energy density within the distribution range of the hazardous fragments was calculated.The damage type of the damage area can be further analyzed based on the intuitive result of the damage distribution of the hazardous fragments to the rear plate,which is more practical.3.Based on the FE-SPH adaptive method,the debris cloud structure and hazardous fragment distribution characteristics generated by the impact at different attack angles were analyzed.
Declaration of competing interest
The authors declare that they have no known competing financial interests or personal relationships that could have appeared to influence the work reported in this paper.
Acknowledgments
This work was supported by the National Natural Science Foundation of China (Grant No.11872118,11627901).
杂志排行
Defence Technology的其它文章
- An energetic nano-fiber composite based on polystyrene and 1,3,5-trinitro-1,3,5-triazinane fabricated via electrospinning technique
- Dynamic response of UHMWPE plates under combined shock and fragment loading
- Aerial multi-spectral AI-based detection system for unexploded ordnance
- Model-based deep learning for fiber bundle infrared image restoration
- Robust design and analysis for opto-mechanical two array laser warning system
- Combustion behavior and mechanism of molecular perovskite energetic material DAP-4-based composites with metal fuel Al
