Aerial multi-spectral AI-based detection system for unexploded ordnance
2023-10-09SeungwnChoJungmokOlegYkimenko
Seungwn Cho ,Jungmok M ,Oleg A.Ykimenko
a Republic of Korea Army,Republic of Korea/Defense Acquisition Program Administration,47,Gwanmun-ro,Gwacheon-si,Gyeonggi-do,13809,Republic of Korea
b Department of Defense Science,Korea National Defense University,1040,Republic of Korea
c Hwangsanbul-ro,Yangchon-myeon,Nonsan-si,Chungcheongnam-do,33021,Republic of Korea
d Department of Systems Engineering,Naval Postgraduate School,USA
e 1 University Circle,Monterey,CA,93943,USA
Keywords:Unexploded ordnance (UXO)Multispectral imaging Small unmanned aerial systems (sUAS)Object detection Deep learning convolutional neural network(DLCNN)
ABSTRACT Unexploded ordnance (UXO) poses a threat to soldiers operating in mission areas,but current UXO detection systems do not necessarily provide the required safety and efficiency to protect soldiers from this hazard.Recent technological advancements in artificial intelligence (AI) and small unmanned aerial systems (sUAS) present an opportunity to explore a novel concept for UXO detection.The new UXO detection system proposed in this study takes advantage of employing an AI-trained multi-spectral(MS)sensor on sUAS.This paper explores feasibility of AI-based UXO detection using sUAS equipped with a single(visible)spectrum(SS)or MS digital electro-optical(EO)sensor.Specifically,it describes the design of the Deep Learning Convolutional Neural Network for UXO detection,the development of an AI-based algorithm for reliable UXO detection,and also provides a comparison of performance of the proposed system based on SS and MS sensor imagery.
1.Background
Unexploded ordnance (UXO) is “military ammunition or explosive ordnance which has failed to function as intended”and left behind after war conflicts,weapon system testing and trainings[1].Fig.1 shows a wide range of UXO varying by size (cf.155-mm projectile vs.20-mm M55 projectile),shape,and color.
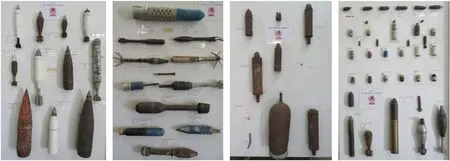
Fig.1.Sample UXO found during Fort Ord ex-military base clean up.
UXO poses an obvious threat to warfighters and civilians relevant to military affairs resulting in injuries and deaths of hundreds of people each year worldwide[2].Most UXO(>50%)are located on the surface of the ground and can be detected visually or photographically,but modern UXO detection systems are often equipped with subsurface UXO targeting means such as magnetometers or electromagnetic sensors [3].These UXO detection systems,designed for hand-held operations,pose several problems in terms of safety and efficiency.The systems require soldiers to walk through the hazardous areas to detect UXO;and it takes a lot of time to survey an area in question because of relatively low productivity.
To address the problem of reliable UXO detection,researchers have tried different approaches.Most of the recent approaches involved using different sensors flown on small unmanned aerial systems (sUAS).For example,DeSmet et al.[4] designed a mine detection system using sUAS equipped with an infrared spectrum camera to detect a plastic mine-a kind of UXO that may not be detected by the electromagnetic detection system.Their study proved feasibility of the suggested approach in various conditions including different temperatures,moisture,and burial depths [4].Similarly,Qi et al.[5]attempted to detect underground UXO using the sUAS with the transient electromagnetic sensor.Their UXO detection experimentation also proved to be a good alternative to conduct dull and dangerous UXO detecting operations.

The multi-spectral(MS)sensors have been used for a variety of applications already as well [6].According to the Defense Science Board Task Force [7],infrared spectrum data has a potential value for surface and very shallow UXO.Johnson et al.[8] suggested possibility of distinguishing between UXO and natural materials by using a spectral signature.Takumi et al.[9] studied MS object detection for autonomous vehicles in traffic and found that the detector trained with MS images featured 13% higher mean average precision compared to the detector trained with a single-spectral(SS) sensor imagery.
While the previous studies demonstrated advantages of using sUAS for UXO detection,no attempt has been yet reported to make use of artificial intelligence (AI) including deep learning convolutional neural network (DLCNN) as applied to MS sensor [10].This paper presents the results of a preliminary study on UXO detection using AI-based detectors trained on different bands of MS sensor.And is based on[11].The paper is organized as follows.The overall concept of the sUAS-based UXO detection system and basics of the MS technology are presented in Section 2.Section 3 suggests the DLCNN architecture for MS UXO detection and provide details on the overall algorithm.Section 4 discusses the detection results using DLCNN trained on SS and MS sensor imagery.Section 5 presents the results of the flight test to demonstrate the feasibility of suggested approach in a real-world operational scenario.The paper ends with conclusions.
2.Concept of operations and underlying MS sensing technology
This section provides the concept of operations (CONOPS) of a sUAS-based UXO detection system and provides some background on MS sensors.
2.1.sUAS-based UXO detection system CONOPS
Fig.2(a)presents an example of a UXO detecting operation near Yeongpyeong shooting range in South Korea,where the Republic of Korea Army 5th Engineer Brigade and the U.S.Army 2nd Infantry Division are using a ground-based electromagnetic system.This operation is obviously dull,dirty,dangerous,and that is why using sUAS seems to be a very attractive alternative not putting humans at risk.Fig.2(b)shows a soldier testing the next-generation sUAS at Fort Benning,GA.Such a sUAS,equipped with a MS sensor can make UXO detection much more efficient.
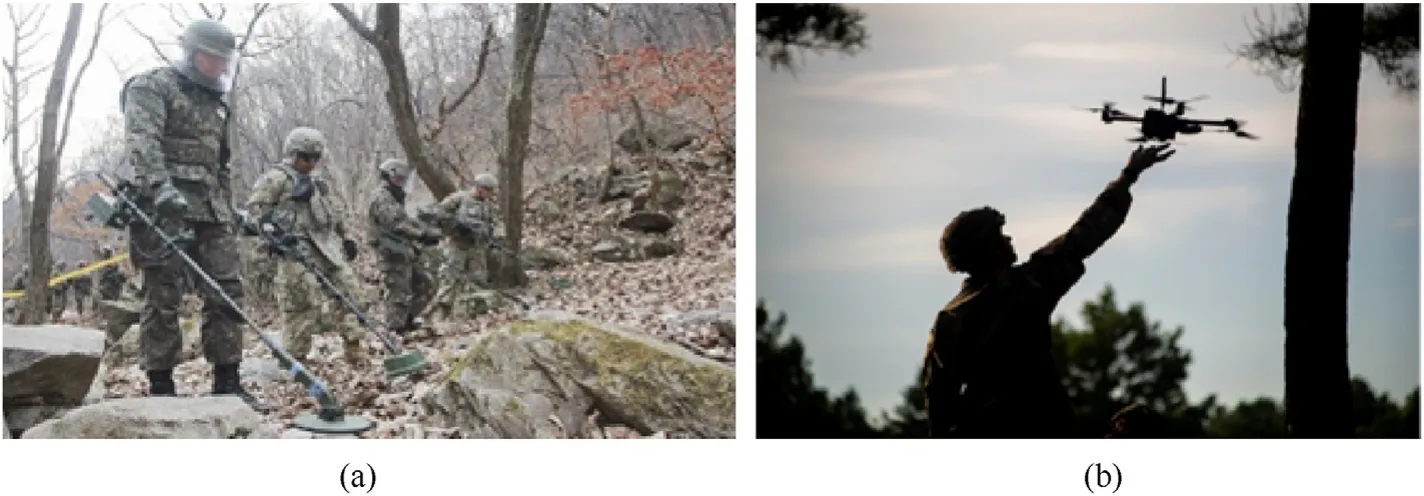
Fig.2.(a) Manual UXO search,vs.(b) automated search using sUAS.
The commander can define the search area and initiate the launch of one or several sUAS to comb the specified area (Fig.3).These low-flying sUAS would use a standard pattern for detecting and identifying UXO to secure a mission area before a small tactical unit makes a maneuver.The sUAS captures footage of the mission area with onboard SS and/or MS sensor and transmits this footage to the ground control station (GCS).The image processing algorithms can reside either onboard sUAS or at GCS.The trained DLCNN is then used to run through the images(or streamed video)and mark the suspected UXO(s) with the bounding boxes (BBs),providing an operator with the coordinates of suspected UXOs.The operator assesses the UXO threats based on the detection results and makes an educated decision.
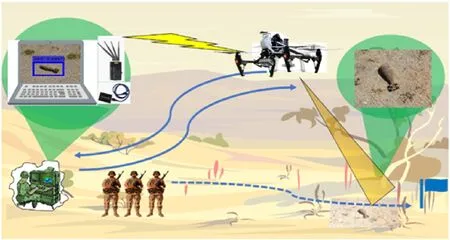
Fig.3.CONOPS for a sUAS-based UXO detection system.
Enabling the aforementioned capability for the operational use,as shown on the right side of Fig.4,involves several steps resulting in the development of a trained DLCNN-based UXO detector.Specifically,it involves gathering some original(relatively large)set of imagery data featuring a variety of known UXOs to be detected(as depicted on the left side of Fig.4),and then conducting several steps toward preparing data for DLCNN training,developing the detector and then validating its performance (the three blocks shown in the middle part of Fig.4).The dashed line in Fig.4 represents the process of updating the UXO imagery data set for future retraining of DLCNN as/if needed.Sections 3 and 4 describes these steps in detail,while the remainder of this section introduces the MS sensor used in this study to gather UXO imagery.
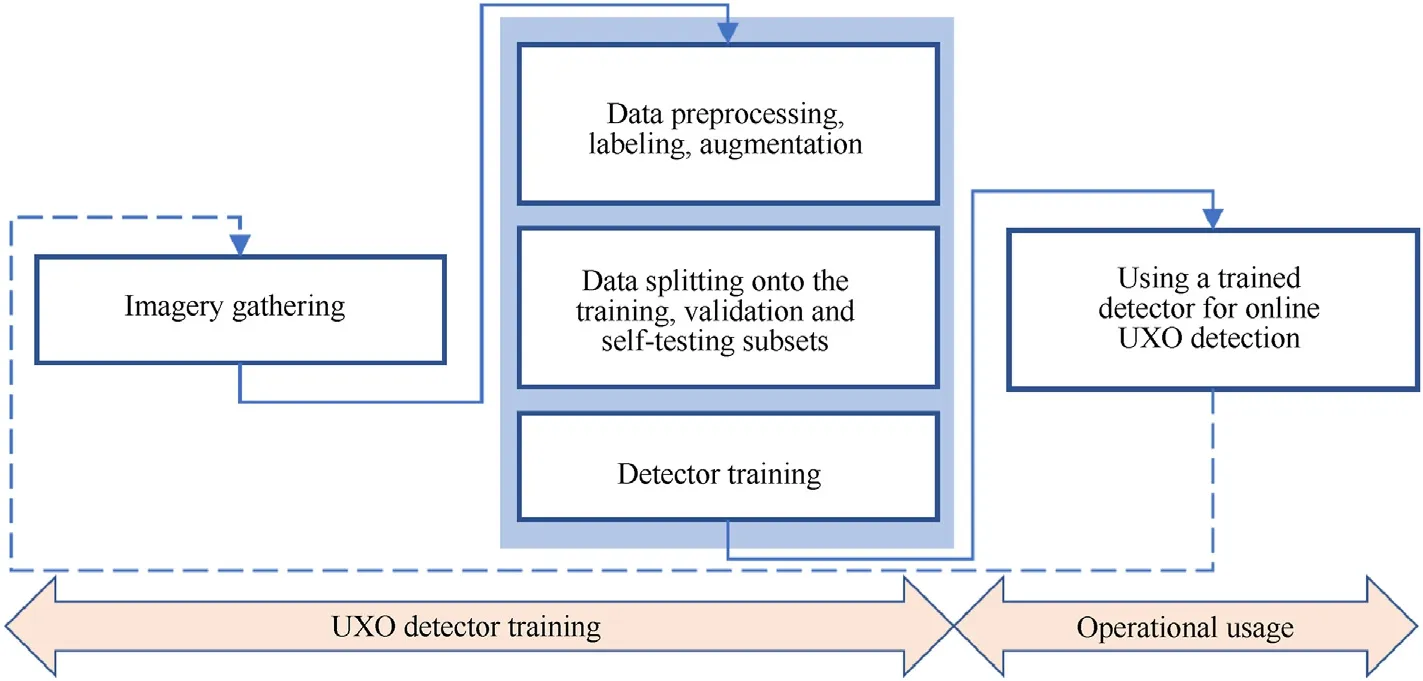
Fig.4.Steps involved in developing a DLCNN-based UXO detector,and its further operational usage.
2.2.MS imaging
While the traditional single-lens SS sensors combine and store visible light spectrum (400-700 nm) as Red-Green-Blue images,and MS sensors employ multiple lenses to capture multiple images in a selected sets of wavelength bands.The latter may include wavelengths invisible to the human eye.For example,the set of wavelength bands shown in Fig.5 includes visible Blue,Green,and Red spectra,along with invisible Red Edge(RE),and Near-Infrared(NIR) spectra.As seen,RE spectrum (between 690 nm and 730 nm) is located in the very beginning of the non-visible light spectra in the region of rapid change in reflectance of vegetation,and as such can be very useful in detecting disturbed soil features caused by changes in the physical environment and in chemical properties.NIR wavelengths fall into the invisible part of the light spectrum between 700 nm and 1200 nm.The MS sensors have already proved to be a very useful tool in agriculture,forestry and land management applications;hence it is natural that this study assesses their effectiveness for UXO detection.
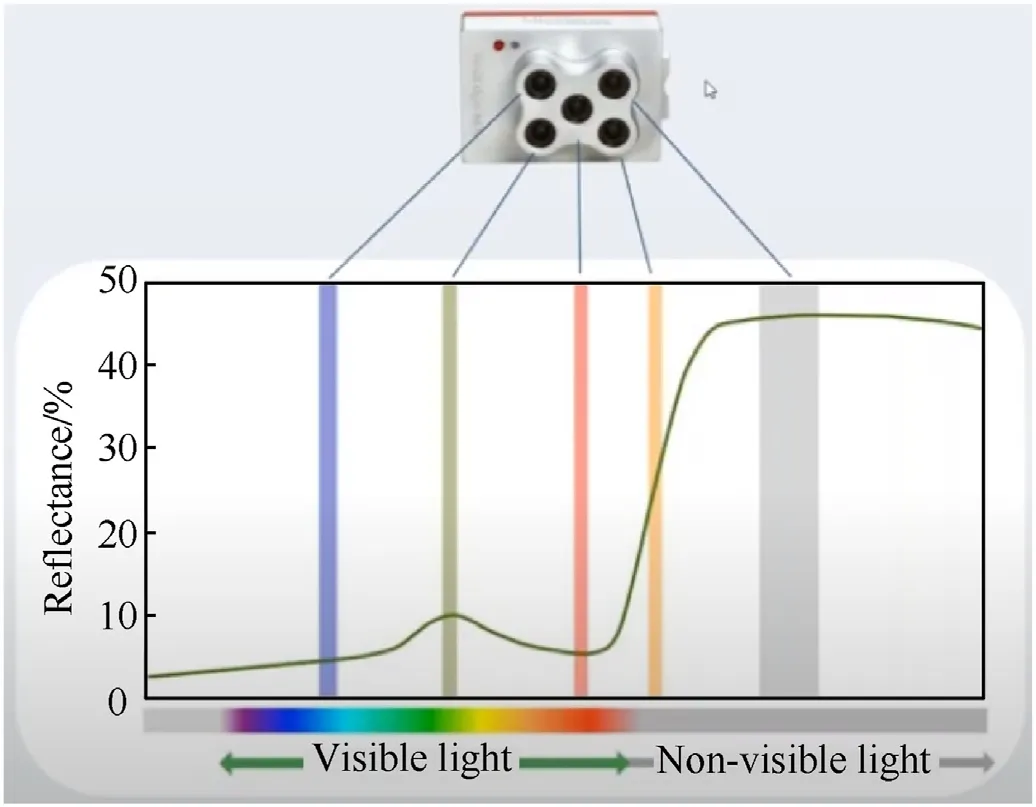
Fig.5.SS vs.MS imaging.
One example of a relatively inexpensive MS sensor is Parrot Sequoia which features Green,Red,RE and NIR bands plus a standard 16Mpix Red-Green-Blue (RGB) lens for color mapping (while the former four lenses use a global shatter,the RGB lens uses a rolling shatter so that the quality of RGB images is not as good as those of the individual bands).Parrot Sequoia manufacturer offers an integration kit with a Parrot Bluegrass Parrot Disco-Pro AG sUAS[12].
Another popular (a bit more expensive) sensor is MicaSense RedEdge sensor(Fig.6(a))with five narrow bands centered around Blue(475 nm),Green(560 nm),Red(668 nm),RE(717 nm),and NIR(840 nm)[13].Compared to Parrot Sequoia,the addition of the Blue component allows compositing RGB bands to create a nice crisp color maps).This sensor became very popular so that many leading drone manufacturers offer integration kits with their sUAS(Figs.6(b) and 6(c)).Having such a sensor integrated with a small multirotor aerial platform,like the one shown in Fig.6(b),allows covering up to 0.3 km2within about 15 min,i.e.,during a single sortie.It is this sensor that was used in this research.

Fig.6.(a) MicaSence RedEdge MX sensor,(b) integrated with DJI Inspire 2 and (c) in the nose bay of Quantum Trinity F90+.
Fig.7 shows an example of MicaSense RedEdge MS imagery recorded by each individual spectrum lens.While all images look somewhat the same,there may be slightly different sets of scene features captured by each of them,thus complementing each other.The images are stored in the Tag Image File Format (TIFF) files for each spectrum band.

Fig.7.Example of five-band MS sensor imagery.
3.AI-based algorithm for MS data processing
This section presents the developed approach to process MS sensor imagery to detect UXO.The key is that each MS band is processed separately using the corresponding pretrained detector(different for each spectrum band).The detection results from all bands are then combined to make a final determination.
3.1.MS-based UXO detection
All five simultaneously obtained images shown in Fig.7 feature the same UXO seen in the different spectrum bands.As suggested in one of the previous research efforts involving MS imagery,each spectral image features different characteristics and as such the best approach to process MS imagery would be to detect the object(s) of interest in each spectrum separately and then combine the detection results [9].Following this suggestion,the data flow for the developed algorithm looks like presented in Fig.8.
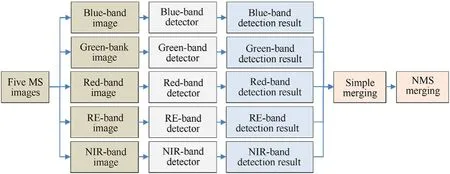
Fig.8.MS-based UXO detection algorithm data flow.
Five same time-stamp MS images are processed using five different detectors developed (trained) for each spectrum.The detection results are then merged using the two-step procedure.The data flow depicted in Fig.8 (developing five complementary detectors as opposed to just one) essentially enhances the three blocks shown in the middle part of Fig.4.
The following two sections describe the developed algorithms,essence of detector training and detection results merging procedure.
3.2.Multi-stage DLCNN architecture
For UXO detection in each MS band,this research employed a deep learning convolutional neural network (DLCNN) as shown in Fig.9(deep refers to the number of hidden layers,i.e.depth of the neural network).The three main pieces of the developed DLCNN architecture include feature training subnetwork,feature transfer layer,detection subnetwork,and output layer.
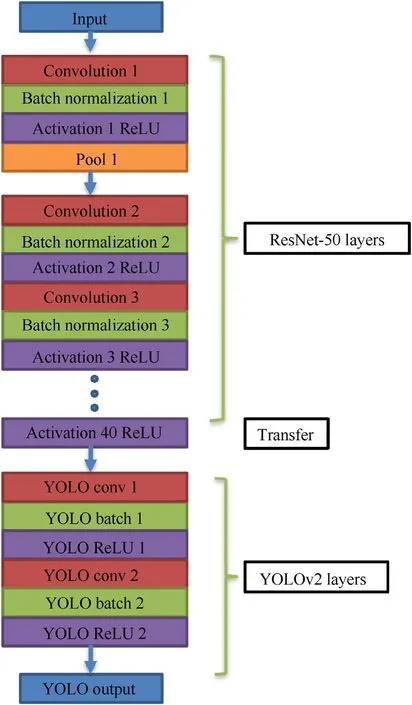
Fig.9.DLCNN architecture for UXO detection.
Rather than building a feature training subnetwork from scratch,the pre-trained CNN structure for feature extraction was used.After experimenting with DarknetReference,Darknet19,ResNet50,and Desnet201,the ResNet50,a variant of ResNet model,was finally chosen.
ResNet50 refers to the Residual Network with 50 layers based on residual learning [13].Theoretically,the performance of CNN increases with the increase in the number of layers because these additional layers learn more complex features.However,there is a limit to the number of layers,so that when it is reached,the accuracy of the model starts to saturate and then degrades(due to the so-called vanishing gradient problem) [14].In other approaches,each layer feeds to its next layer and the same goes on subsequently.In a residual network,each layer feeds to its next layer and directly to the 2-3 layers below it (not shown in Fig.9).Using ResNet drastically improves the CNN performance despite having more layers (to be able to identify features of smaller objects like UXO shown in Fig.7).Each,convolution layer is followed by a batch normalization layer and a Rectified Linear Unit (ReLU) activation function,f(x)=max(0,x).(Without an activation function the model would behave like a linear regression model with a limited learning capacity.)
As shown in Fig.9,using the trial-and-error approach the ResNet50 CNN was actually limited to just 40 layers which provided a good balance between UXO detection performance and training time.As such,ReLU 40 activation function transforms the final detected feature data to the detection/classification subnetwork.
After experimenting with three popular CNN models for object detection -Faster R-CNN [15],SSD [16],and YOLOv2 [17] -the latter one was chosen for this particular application,proving the fastest learning speed yet again [18].
3.3.Essence of the YOLOv2 algorithm
The key advantage of YOLOv2 in improving detection/classification speed and efficiency is the use of the anchor boxes(ABs).The ABs are a set of predefined boxes of different sizes defined to capture the scale and shape (aspect ratio) of specific object class(es).Instead of predicting one BB per pixel,YOLOv2 divides a reduced-size input image into a square grid and predicts several BBs per grid.As an example,Fig.10(a)shows a 5 by 5 grid with a set of three fixed ABs tiled across the image (for simplicity,Fig.10(a)visualizes just four grid cells filled with the ABs).These 5 × 5 × 3=75 ABs represent the initial BB guesses.An AB-based object detector processes an entire image at once as opposed to scanning an image with a sliding window(as some other methods do) and computing a separate prediction at every potential position.

Fig.10.(a)Example of a 5×5 grid populated with three different-shape Abs;(b)Computation of an adjusted AB parameters[17];(c)Mean IoU for UXO detection vs.the number of ABs per grid cell.
In reality,YOLOv2 uses the input image of size 416 pix×416 pix divided into a 13 × 13 grid enabling to downsample it 32x (five times)and execute a multiscale training to find both large and finer objects(YOLOv2 architecture randomly chooses image dimensions for every 10 batches).
Fig.10(a) also shows a hypothetical ground truth box (GTB)created during data labeling (this GTB contains the object of interest in it).The ABs of the grid cell where the center of GTB resides are responsible for detecting this object.(One grid cell may be responsible for predicting several objects and that is another reason to use multiple ABs per cell.)
The BB predictions are made by varying (predicting) five parameters per each involved AB.Four of them,tw,th,tx,andty,define the size of the adjusted AB (BB prediction) relative to the GTB’s width and height,pwand ph,as shown in Fig.10(b),as well as the location of its center relative to the upper-left corner of the corresponding grid cell(σ(x)denotes a sigmoid function to constraint its output between 0 and 1 [19]).The fifth varied parameter is the confidence score(CS)reflecting how confident the model is that the BB region (predicted by DLCNN) contains an object and also how accurate it thinks the predicted BB(pBB)is.It is defined as a product
whereP(Object),the probability of example belonging to a given class (just one class,UXO,in this study),would be 1 or 0,as each sample in the training dataset is a known example from the domain,and IoU(AB,GTB),the intersection over union(IoU)for the predicted BB (pBB) and GTB defined as Ref.[20].
For the specific case shown in Fig.10(a),for all but one grid cell,P(Object)=0(since the center of the GTB does not fall in them)and CSs are zero.For the ABs residing at the fourth raw (counted from the top of the image)and the second column of the grid cell,CSs are identical to the IoU values for those three ABs(sinceP(Object)=1).
During CNN training,we only want one AB(BB predictor)to be responsible for each object.We assign one predictor to be“responsible”for predicting an object based on which prediction has the highest current IoU with the GTB.This leads to specialization between the BB predictors.Each predictor gets better at predicting certain sizes,aspect ratios,or classes of an object,improving overall ability of the detector to find all relevant objects.In the situation shown in Fig.10(a),out of three pBBs the one with highest IoU will be selected.
In the case of multiple objects in the image (and even within a single grid cell),the number of pBBs may be adjusted by establishing a threshold on IoU.Decreasing the threshold reduces the number of selected BBs.Of course,decreasing the threshold too much,leads to elimination of pBBs that represent objects close to each other in the image.This procedure is referred to as nonmaximum suppression (NMS).
In the specific application this study dealt with,all UXOs are considered to be of a single class,but theoretically,the proposed DLCNN could be trained to recognize several UXO classes since there may be a need to differentiate between the different types of UXOs (see Fig.1).Fig.10(c) shows how the number of ABs (within each grid cell) affects the average IoU.Choosing a large number of prior boxes allows for greater overlap between ABs and GTB(higher IoU values),however,using more ABs can increase the training time and lead to overfitting and therefore worsening detector performance.In this study it was chosen to use nine ABs(ensuring a mean IoU value of about 0.8),since after that the mean IoU plateaus(typically,any threshold greater than 0.5 should suffice).
During an object detector training,the AB positions and sizes are refined to minimize the so-called loss function,which is a weighted sum of squared error and consist of classification loss(1-CS)and BB localization error.The DLCNN training process (the process of updating network parameters θ,weights and biases) employs a stochastic gradient descent with momentum optimizer.In this case,the parameter vector θ is updated as follows [21]:
wherelis the iteration number,α is the learning rate,∇denotes the gradient,E(θ)is the loss function and γ determines the contribution of the previous gradient step to the current iteration.Usually,it is not possible to fit the whole available training dataset(hundreds of images)in the machine’s memory and that is why the second term in Eq.(3) is computed using a minibatch data processing.
wherenis the number of minibatches andEi(θ) is the i-th minibatch loss.A batch or minibatch refers to equally sized subsets of the dataset over which the gradient is calculated,and weights updated.(Mini-batch sizes are commonly called “batch sizes”for brevity.The term batch itself is ambiguous,however and can refer to either batch gradient descent or the size of the minibatch.)If the total number of available data (images) in N and the size of a minibatch is k,then nk ≤N.If the dataset does not divide evenly by the batch size,the final batch has fewer samples than other batches.
The number of batches is also referred to as a training epoch.One epoch means that each sample in the training dataset has had an opportunity to update the internal model parameters.If the total number of available data(images)inNand the size of the batch isN,then the parameter vector θ is only updated once per epoch(which in this case is the same as iteration).Otherwise,it is updatedm=ceil(N/k)times.Minibatch gradient descent reduces the risk of getting stuck at a local minimum,since different batches will be considered at each iteration,granting a robust convergence.
The UXO detection DLCNN ends with the YOLOv2 output layer(Fig.9).The output layer provides the locations of refined BB enclosing all found UXOs.As an example,Fig.11 shows these BBs for MS images similar to those of Fig.7.

Fig.11.BBs for a detected UXO as seen on MS images.
3.4.Merging of the MS detection results
As seen from Fig.8,after five MS band detectors find (or not)UXO(s),the detection results for multiple detectors need to be merged.The first step is simple merging that shows the detection results from five detectors on a single image(which can be one of the band images or composed RGB image).For instance,if only two out of five detectors detect UXO,the simple merging would result in two BBs showing up on the image.
The simple merging step for BBs shown in Fig.11 (in the case when the corresponding detectors detect UXO in each spectrum),is shown in Fig.12(a)featuring five BBs around the same single UXO.
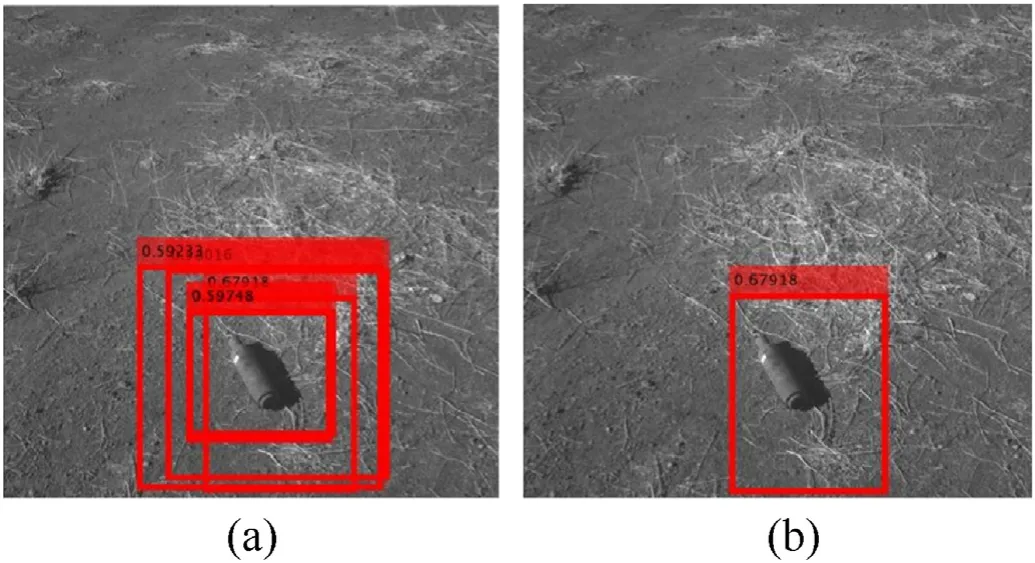
Fig.12.(a) Simple merging;(b) Suppression of week detection results.
The final merging step (Fig.8) combines whatever number of BBs was found for each UXO into a single one.This is done by using the NMS method,described in Section 3.3.The only difference is that IoU values (see Eq.(2)) are computed using a pairwise comparison between all found BBs.If it exceeds a certain threshold,the weaker detections are suppressed.
To prevent the actual overlapped detection result from being recognized as not overlapped,this NMS IoU threshold is set as low as 0.1.Hence,the redundant detection results can be effectively suppressed for which IoU is higher than 0.1,except for the best detection result.The reason for setting the low IoU threshold relates to the characteristic of the MS specific sensor used in this research (Fig.6(a)).MicaSence RedEdge MX sensor has five physically different lenses for five spectra,and the different physical locations of these lenses cause some misalignment of MS data.Even though each spectrum detector successfully detects UXO,the simply merged BBs are misaligned and with a high IoU threshold this makes the system think they detected different objects.Fig.12(b)shows an example of NMS method as applied to the situation shown in Fig.12(a)leaving the only BB with the highest CS among the five detection results.
4.Algorithm performance evaluation
This section describes imagery collected in the close to actual operational environment to assess feasibility of the proposed UXO detection approach,followed by describing the process of detector training and finally evaluating the overall performance of the developed and trained MS UXO detector as compared to the detector based on a standard SS sensor imagery.
4.1.UXO imagery gathering and preprocessing
This study took advantage of using nine different types of UXO shown in Fig.13(cf.Fig.1).These included mortar projectile,handgrenade,bullets,etc.All of these UXOs have a different shape,color,and size.(As mentioned earlier,this study aimed at assessing the overall concept of detecting UXO using MS sensor and was not intended to attempt to classify different types of UXO.) To obtain diverse data,these nine UXOs were randomly placed on the ground.Some were placed close to/under the bushes to mimic the operational environment (Fig.14).

Fig.13.A set of UXO used to train DLCNN.

Fig.14.Examples of UXO placement to mimic the operational environment.
A total of 4075 still images -815 photos for each spectrum -were collected using the MicaSense RedEdge MX sensor as visualized in Fig.15(a).These images had 1280 pix ×960 pix resolution.To assess advantages of using an MS sensor to detect UXO,the corresponding imagery was also taken using a SS sensor.Specifically,1225 still images and 59 videos (each about ten to 20 s in length each)were taken using the Sony Alpha 6000 digital camera(Fig.15(b)).The still images had 6000 pix × 4000 pix resolution.
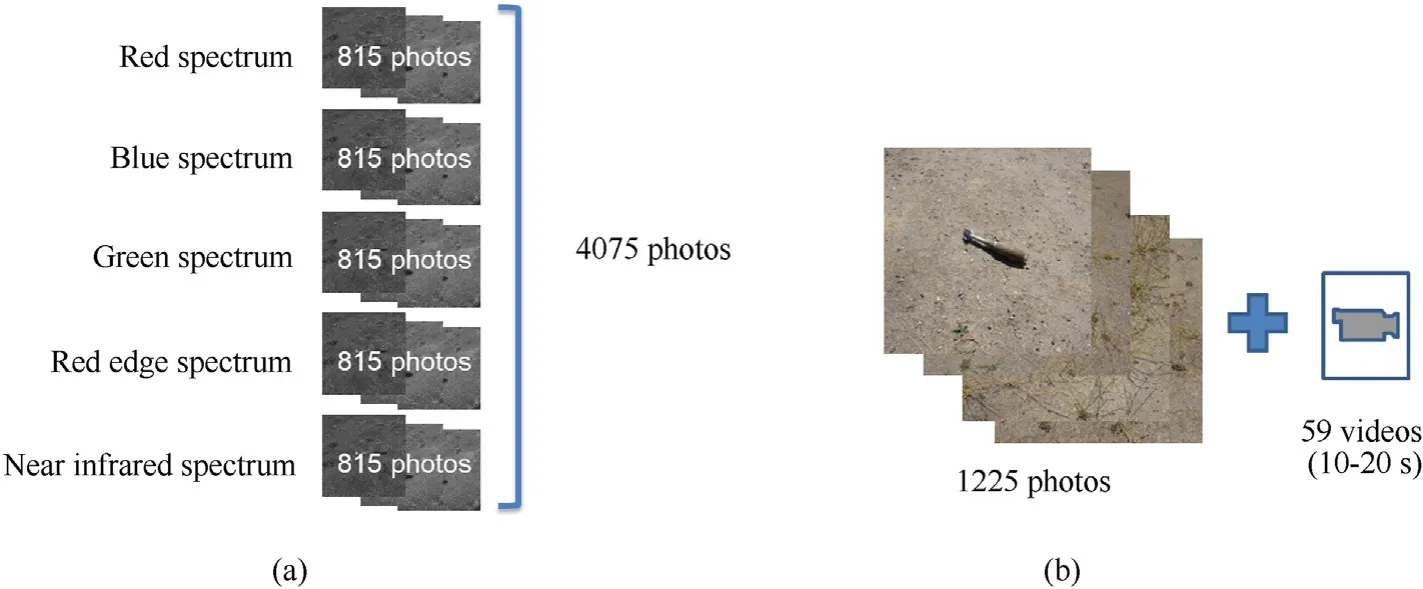
Fig.15.Data collected with the MS (a) and SS (b) sensors.
Both sets of still images were preprocessed using the same fourstep routine.
(1) All collected data were resized to 416 pix × 416 pix resolution,which happens to be the best image size for YOLOv2 CNN model performance(Fig.16(a))(Figs.16 and 17 show the four-step routine as applied to the SS images),
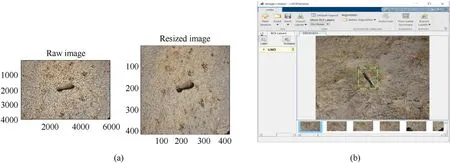
Fig.16.(a) Image resizing;(b) Labeling.
(2) To establish ground truth data,the resized images were labeled using the Image Labeler app provided by MATLAB(Fig.16(b)),
(3) Labeled data were randomly divided into three groups-70% for training the UXO detector,15% for validation (for selfcorrection at regular intervals during training to improve the detector’s performance),and 15% for testing data (for evaluation of the trained detector)For the SS sensor it meant 857:184:184 split (Fig.17(a)),and for the MS sensor -571:122:122 split,
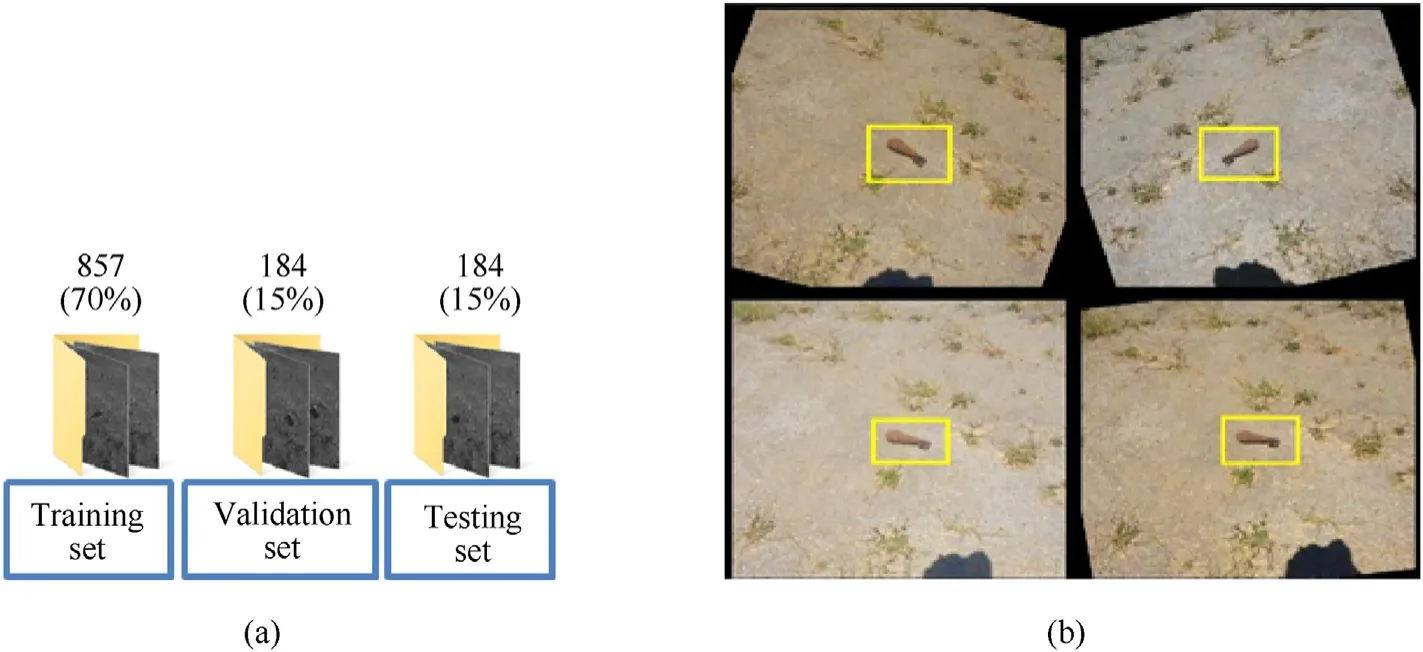
Fig.17.(a) Division of collected imagery into the training/validation/testing subsets;(b) Examples of labeled image augmentation.
In order to increase the size of the ground truth data pool(to add more variety to the training data without actually having to increase the number of labeled training samples),the training subset of labeled data was augmented by applying rotation,changing brightness and contrast (Fig.17(b)).(Validation and testing data should be representative of the original data and as such is left unmodified for unbiased evaluation.) As a result,the number of training subset of images was increased fourfold:up to 3428 for the SS sensor and up to 2284 for the MS sensor.
4.2.Detector training
All DLCNN training was conducted using a MATLAB (interpretative) development environment on a generic laptop (Table 1).

Table 1 Laptop specifications.
First,the SS detector was trained as explained in Section 3.3.Step 1 of the four-step routine of Section 4.1(1225 images resizing)takes 2 min,while Step 2(image labeling)happens to be the most time consuming -on the order of 2 h.
As far as a training procedure itself,after several tries with the different training options,the number of the ABs was set as nine,maximum epochs as 20,and mini-batch sizes as eight(Fig.18).One epoch represents one backward and one forward pass through the network for all the training data;the batch size is the number of training data in one forward and backward pass;the iteration is the number of batches for one epoch.This setup seems to deliver the optimal training performance as applied to the collected UXO imagery.Using the aforementioned parameters,the training of a visual spectrum UXO detector took about 2 h.
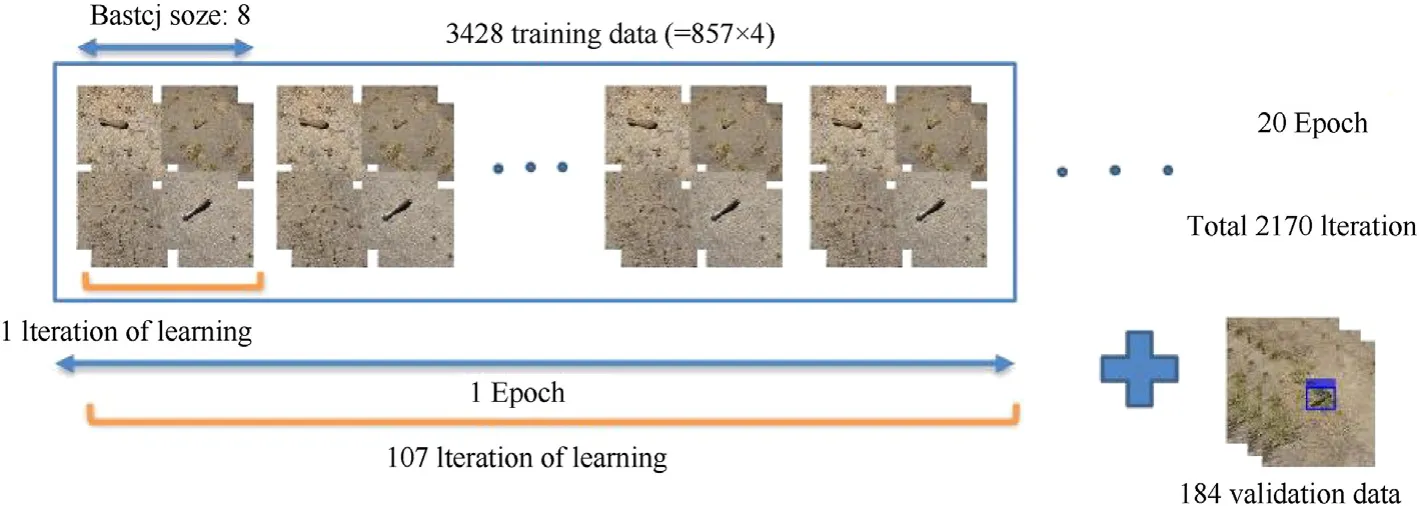
Fig.18.SS imagery training setup.
The results of applying the trained SS detector to the several images from the testing set are shown in Fig.19.The UXO detector puts BB around the predicted UXO in the testing image along with the detection CS.Specifically,Fig.19 shows three examples of the successful UXO detection and one example of unsuccessful detection.Unsuccessful means that the detection CS happened to be below the threshold (of 0.5) and as such -BB does not show up.
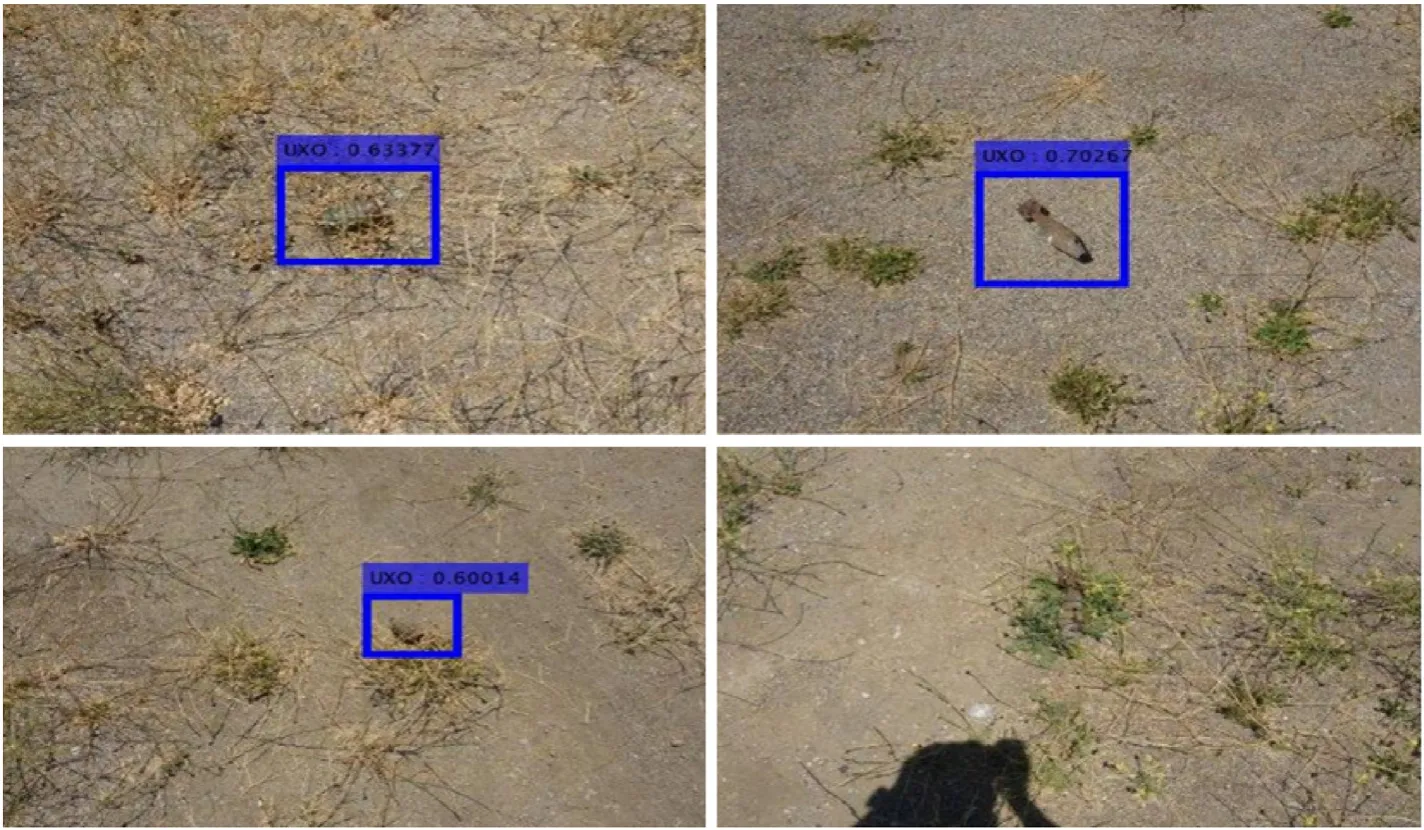
Fig.19.Examples of three successful and one non-successful UXO detection.
The UXO detector training for each of five MS sensor spectra was conducted next(Fig.15(a)).Similar to the SS detector training data preparation,Step 1 takes about 2 min and Step 2 takes an hour and half.
The same number of ABs(nine)and the same(eight)mini-batch size were used,but the number of epochs was reduced to five.This was done to keep the training time about the same as for the SS detector (with no significant loss of performance).As a result,it took only 20 min to train each of five detectors,1 h 40 min in total.
Fig.20 shows a typical example of applying five separately trained detectors to five individual spectrum band images (see Fig.7).As expected,UXO is not necessarily detected in each spectrum band.In this particular example,only the Blue and Green detectors were successful while three other were not.In some other cases,only the NIR detector detected UXO while other detectors failed.Indeed,having five detection results rather than just one for a SS detector increases the overall reliability of UXO detection.Fig.20 also shows the merging step of the Blue and Green detector BBs.
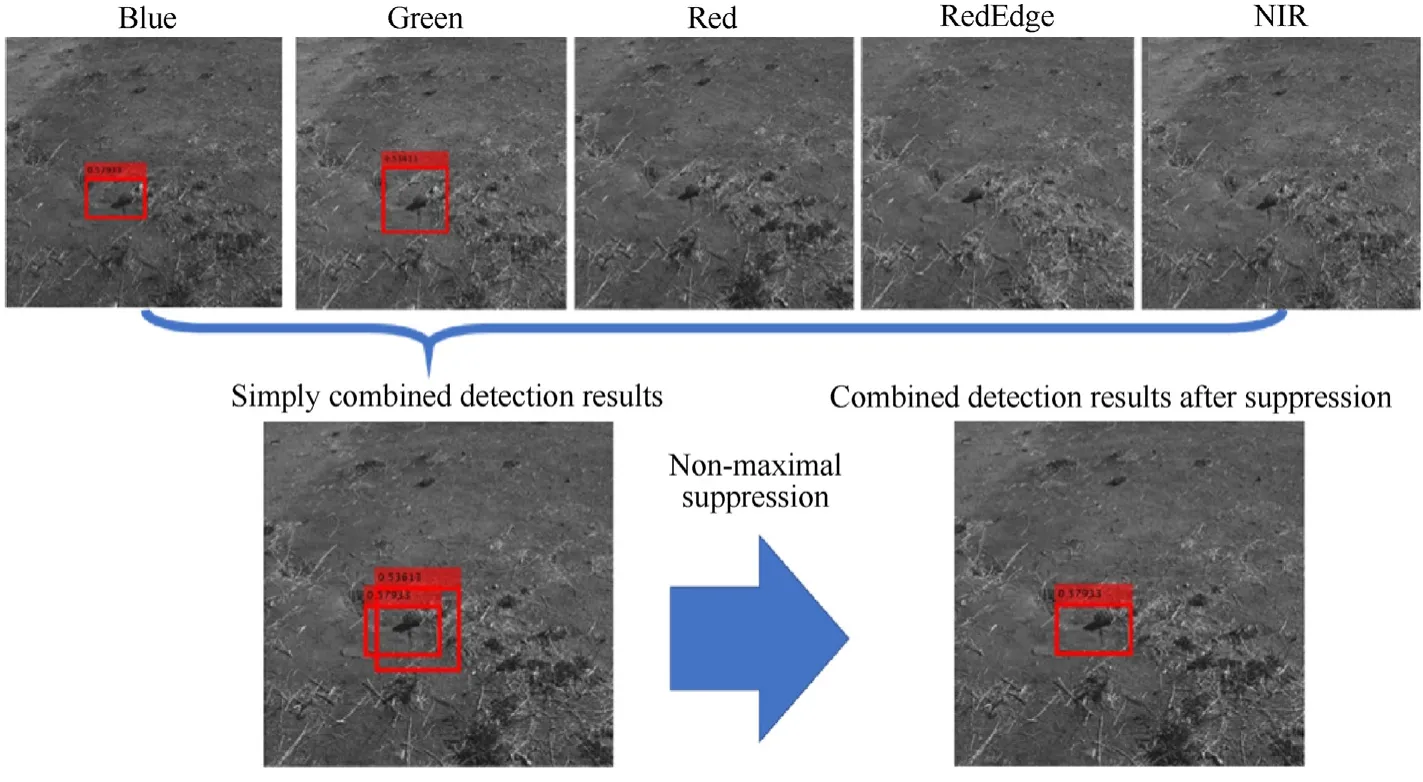
Fig.20.Results of detection in multiple spectra and the final merging BB.
It should be noted that as opposed to the SS detector,for all five MS detectors,the IoU threshold was set to a slightly lower value(0.4 as opposed to 0.5).The reason is that individual spectrum band images for MS data are not aligned with each other (Section 3.4).The misalignment of data causes a phenomenon in which a True Positive-correct detection result-is recognized as a False Positive-wrong detection result.Setting a lower threshold for the MS detectors can prevent the actual True Positive from being evaluated as False Positive.
4.3.Overall performance assessment
As a metric to evaluate the effectiveness of the trained detector,the average precision (AP) is commonly used [22,23].The average precision provides a single number that incorporates the ability of the detector to make correct classifications (precision) and the ability of the detector to find all relevant objects (recall).
The first step to compute AP,is to build a confusion matrix(CM)that is a very convenient tool to visualize algorithm performance(Fig.21).The CM rows represent the test outputs,while its columns indicate an actual state.Positive or Negative is determined by whether the UXO detector detects UXO in a given image.True or False is determined by whether the value of IoU is larger than a certain IoU threshold,indicating how much the detection results and the actual UXO location overlap.Precision measures how accurate the UXO detector's predictions are based on the ground truth data-in this case,actual UXO location.Hence,if the IoU between the prediction and the ground truth is more than or equal to a IoU threshold,the detection is classified as True Positive;if IoU is less than a IoU threshold,the detection is classified as False Positive;and if a ground truth is present in the picture and the detector failed to detect the object,it is classified as False Negative.

Fig.21.CM for UXO detector evaluation.
Next,the values of precision,p,and recall,r,are computed.Precision measures a fraction of Positives within all detections
Recall measures how well the detector finds all Positives based on the ground truth data
Finally,after the trained UXO detector detects UXO in a given set of test data,the detection results are ranked in the descending order of the predicted CS (see example in the left-hand side of Fig.22).To visualize thepandrvalues of the detection results,the Precision-Recall (PR) curve is plotted (right-hand side of Fig.22).This curve shows the precision of the trained detector at different recalls [23].
The AP is then computed as an average precision value among all recalls,i.e.,as an area under the PR curve.By construction,the calculated AP is between 0 and 1,and it is presumed that the higher the AP,the better the detector.
Following the PASCAL Visual Object Classes(VOC)Challenge,in order to reduce the impact of the“wiggles”in the PR curve,caused by small variations in the ranking of examples,the AP value is calculated by averaging precision at a set of 11 evenly-spaced recall values [0,0.1,…,1] [24,25].
The precision at each recall level is interpolated as
What is shown in Fig.22 is the PR curve computation and the 11-point-interpolation AP evaluation for the trained SS detector,which resulted in detecting 193 UXOs within 184 test images.As shown,the AP was evaluated to be 0.774.
For MS detection,the respective detectors were evaluated with the 122 test images for each spectrum.The AP for the respective detectors were computed as being between 0.484 and 0.592 as shown in Fig.23.
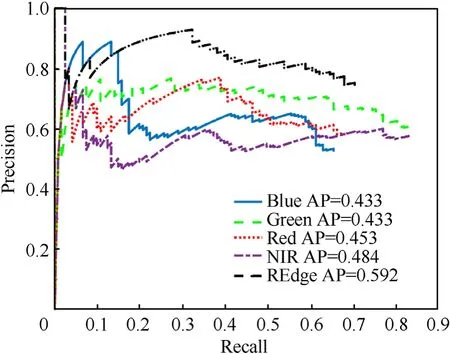
Fig.23.The PR curve for individual spectrum detectors.
As seen,the Blue,Green,and Red detectors feature a(0,0)point meaning that they have no detection result in some images.On the contrary,the RE and NIR detectors do not have this point meaning they found a candidate UXO in every image,even if there were no UXO.
Data shown in Fig.23 were further integrated into a combined PR curve using the two-step merging procedure described in Section 3.4 (Fig.7).By doing so,the five detection results were integrated into a single one (the integrated MS detection results were evaluated on the basis of Red spectrum test data).The integrated MS detector PR curve is shown in Fig.24.Compared to Fig.22,the integrated MS detector features a 12.5% higher AR value as opposed to the SS detector (0.871 as opposed to 0.774) which matches the results of the earlier study [9].
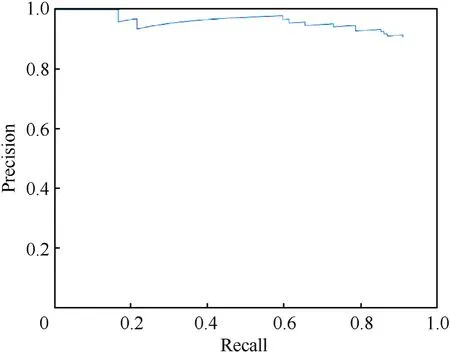
Fig.24.The PR curve for the integrated MS detector.
While the evaluation results of respective detectors were all less than the evaluation of the RGB-spectral detection,when integrated they feature da better effectiveness of the trained UXO detector(Table 2).

Table 2 Comparison of SS and MS UXO detectors.
Fig.25 illustrates an attempt to increase the AP value even further by using a tighter GTBs when labeling (Fig.16(b)).While being much more time consuming,this approach resulted in only 1% improvement of the tight-fitted detector as compared to the loose-fitted detector using the same dataset (AP=0.904 and AP=0.895,respectively).(It should be noted that because of randomization in splitting the original data set into three subsets(Fig.17(a)),the initial value in Fig.25 (0.895) differs from that of Fig.24(0.891).)
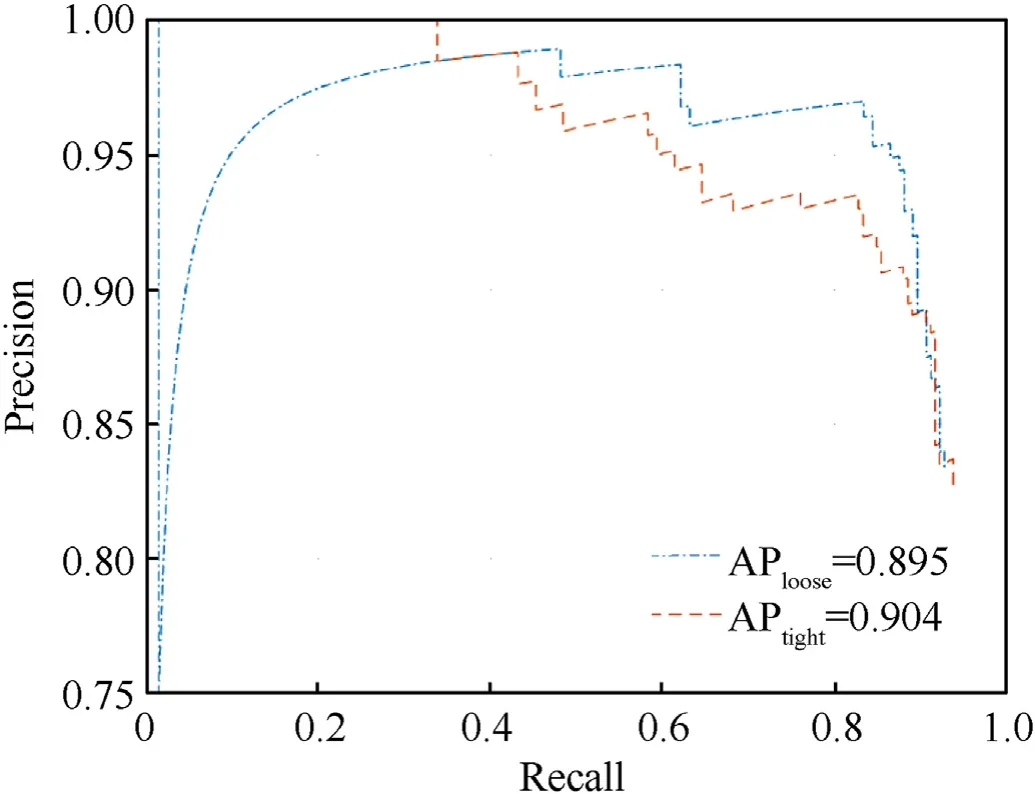
Fig.25.Effect of tightness while data labeling [26].
5.CONOPS assessment
To prove the overall sUAS-based UXO detection CONOPS,one more set of tests was conducted.The idea was to check if the developed DLCNN architecture and training procedure could be used to detect other objects rather than UXOs and if the detection could be performed using a steamed video as opposed to still images in a real-time.Specifically,in this series of tests,four small firearms-two rifles and two pistols-were used as the objects of interest as shown in Fig.26(a).Fig.26(b) shows a sUAS integrated with a Zenmuse X5 sensor used in this case (there were no MS sensors that would provide a steamed video available).Fig.27 illustrates the operational scenario.
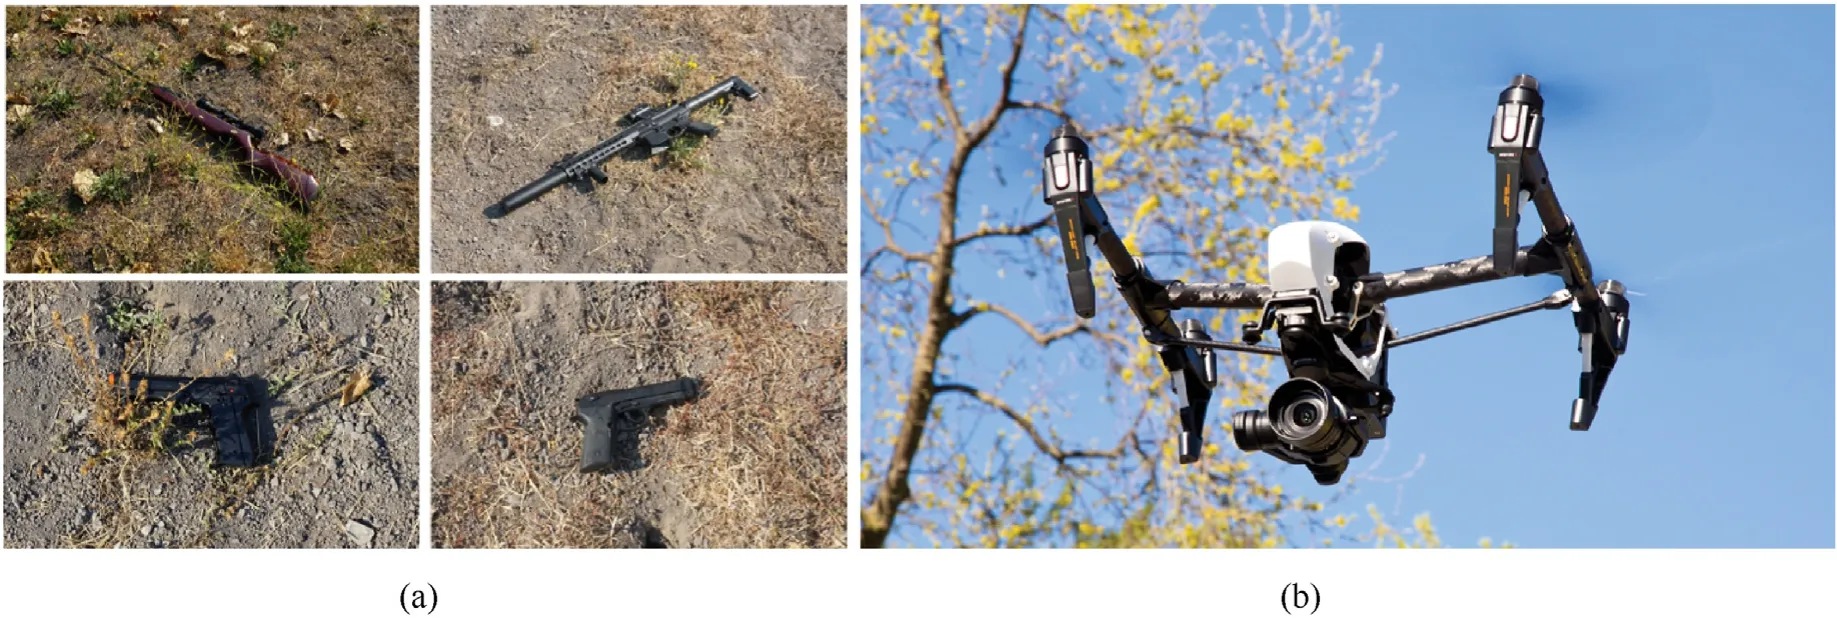
Fig.26.(a) Typical small firearms,and (b) sUAS integrated with an SS sensor.
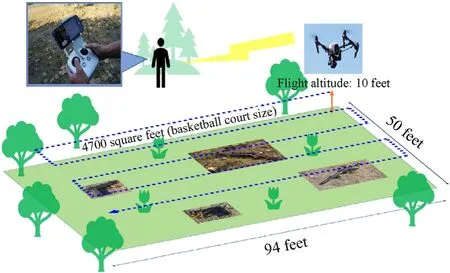
Fig.27.Operational scenario used in the CONOPS evaluation flight test.
Specifically,the mission area was established as a size of a basketball court 28.65×15.24 m2(94×50 ft2)or 440 m2(4700 ft2),sUAS executed a serpentine search pattern flying 3 m(10 ft)above the ground level at an average walking speed of about 5 km/h(1.4 m/s or 3 mph).The complete sweep of the area took 18 passes,about 30 s each,or approximately 10 min in total.Therefore,it only took one sortie to sweep the area.
In total,18-30-s-long video clips,were collected.These raw 18 video clips were recorded at 30 frames per second(fps).They were then split into still frames.Further processing included only one of every three consecutive images 5400 images in total),thus effectively reducing the rate down to 10 fps.The SS detector training was conducted using the same DLCNN structure and training procedure as outlined in Sections 3 and 4.Specifically,twelve video clips(equivalent to 1812 RGB images)were used for small arm detector training,three(389 images)-for validation and three(389 images)-for testing.These images had 3,840 pix × 2,160 pix resolution.
The training procedure employed eight ABs.Similar to what was shown in Fig.9(c),having eight ABs ensured about the same mean IoU value(of about 0.8)as nine ABs for UXO detection.The DLCNN training options were also similar to those for the SS and MS UXO detector training.To decrease the training time,a minibatch size was set to eight,and the maximum number of epochs-to five.The training took an hour and 10 min.
The trained DLCNN detector was then applied to process three testing video clips.Fig.28(a) shows four snapshots capturing a BB around each type of the small firearms used in the experiments.Visually,there were no dropouts or false detection during the detector testing,suggesting that the AP value of the small firearms detector is close to 1.This is confirmed by data presented in Fig.28(b)featuring the AP value of 0.966,which is 25% higher than that of the SS UXO detector and 11% higher than the MS UXO detector (Table 2).Hence,due to a specific shape of small firearms,even a SS detector does almost a perfect job in reliably (precisely)finding all objects in questions.
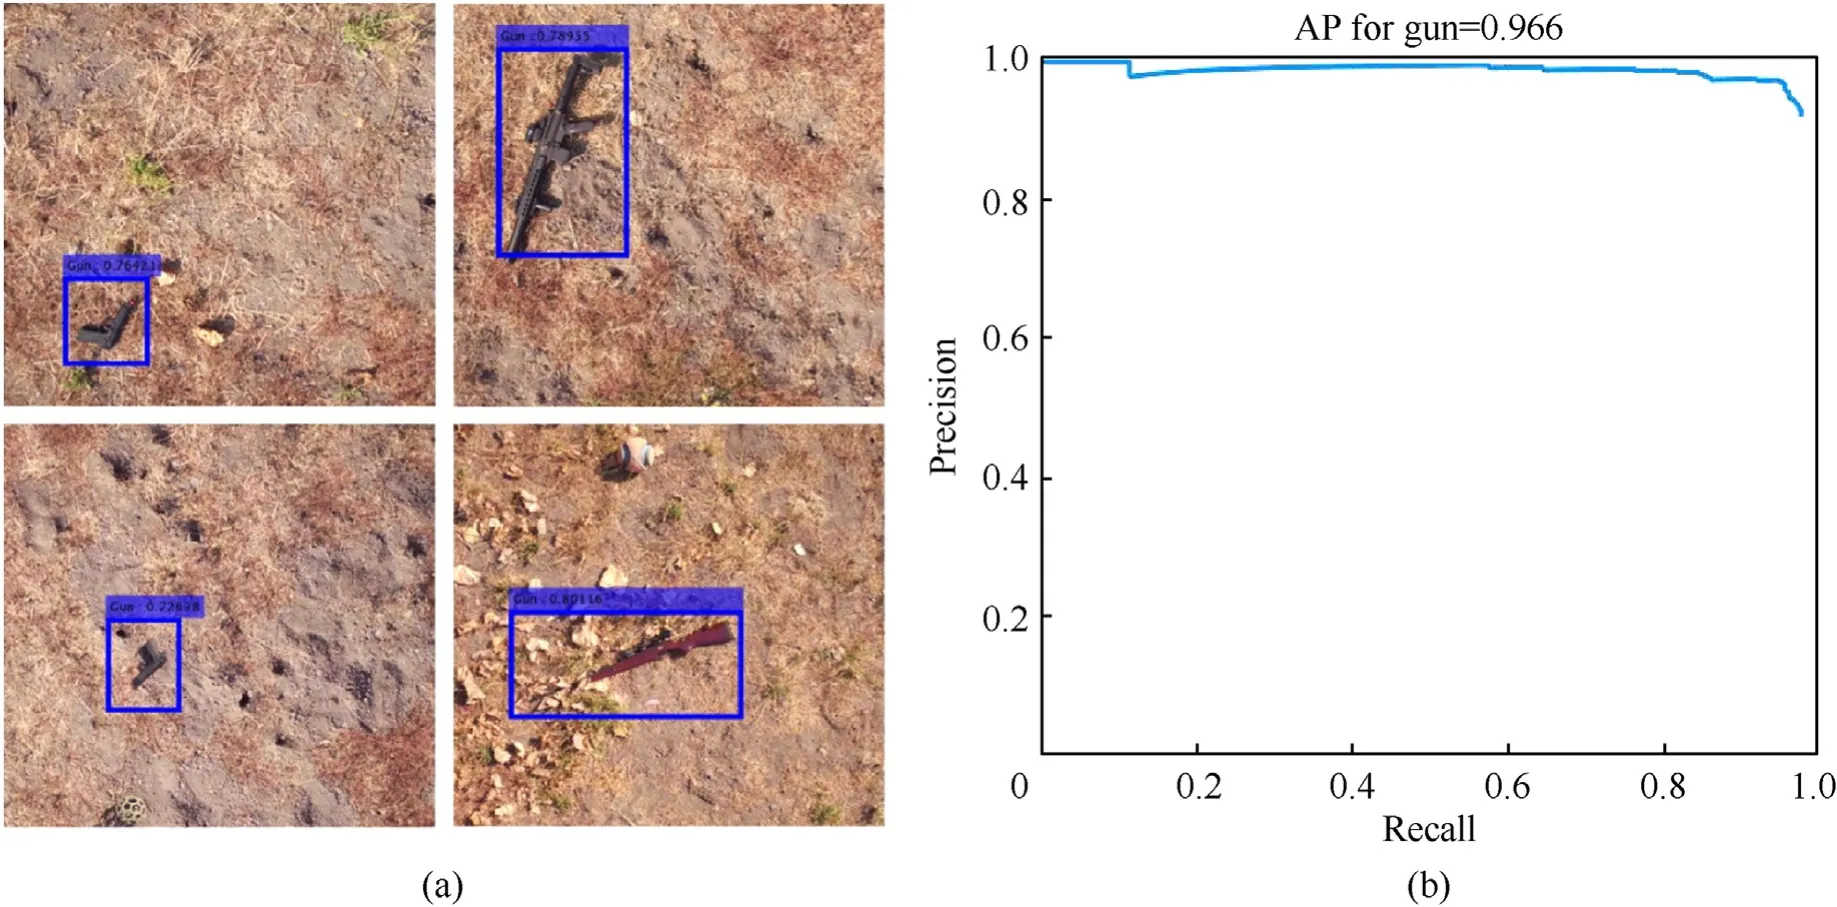
Fig.28.(a) Examples of successful firearms detection and PR curve for the SS-based firearms detector.
Even though the trained DLCNN detector was applied to the video clips in the interpretive environment of MATLAB,each frame was processed in 0.1 s,which suggests that the algorithm should work in real time (at least for the rate of 10 fps and less).
This field flight proves the feasibility of the trained detector within the actual operational flying environment.Plus,this implementation explores the potential to expand he UXO detection system for other articles.For the operational assessment,the test result shows that the one sUAS trained with 1812 images can cover the area of operation 440 m2(4700 ft2)operational within 30 s with 96% reliability in the condition of the open field and the 3 m(10 ft)flight altitude.If the sUAS fly higher,it could cover the wider area,or it could sweep the area much faster.In consideration of the trade-off between the reliability and the flight altitude,the future study is suggested to find the optimal highest flight height to cover the operational environment as quick as possible.
6.Conclusions
This paper presented the concept of using a small multirotor sUAS equipped with SS or MS sensor to take advantage of AI-based algorithms for small object(UXO and small firearms)detection.The DLCNN detectors developed and trained on realistic imagery proved overall feasibility of the concept and demonstrated quite a promising performance.With only about 1000 images (per each spectrum band) needed to train a SS detector or MS detector,it takes on the order 2 h to prepare(resize,label,augment)data and about 1-2 h to actually train the detector.Once trained,the detector can process streamed video at the 10fps rate(in the MATLAB interpretative environment).For the compiled code this rate is expected to be at least 100 times higher.As far an average precision,even a standard single (visual) spectrum camera allows detecting UXO and small firearms with 0.774 and 0.966 precision,respectively,which are the high values.Employing a MS sensor with multiple spectrum bands,especially Red Edge and NIR,allows capturing different sets of features so that while the AP values for individual spectrum bands are lower than that of the SS sensor,when combined (integrated) they ensure much better detection results.A typical small multirotor UAS equipped with the SS or MS sensor featuring about 30 min flight duration can effectively sweep an area equal to three basketball courts in just one sortie.Future research will attempt the UXO detection in different weather conditions and partially under the ground.Another extension will be attempting UXO classification along with UXO detection.
Authors’contributions
SC designed and coordinated this research,carried out experiments,and drafted the manuscript.JM conceived of publishing the paper and helped to draft the manuscript.OY participated in the design of the study research coordination and revised the manuscript.The authors read and approved the final manuscript.
Funding
The authors declare that no funds,grants,or other support were received during the preparation of this manuscript.
Code availability
Not available publicly.
Ethics approval
Not applicable.
Consent to participate
Not applicable.
Consent for publication
Not applicable.
Declaration of competing interest
The authors declare that they have no known competing financial interests or personal relationships that could have appeared to influence the work reported in this paper.
Acknowledgements
The authors would like to thank the Office of Naval Research for supporting this effort through the Consortium for Robotics and Unmanned Systems Education and Research.They would also like to thank the personnel of the California National Guard post at Camp Roberts,CA,Manager of the NPS Field Laboratory at McMillan Airfield,Mr.Greg Arenas,and NPS Base Police LT Supervisor Edward Macias.
杂志排行
Defence Technology的其它文章
- An energetic nano-fiber composite based on polystyrene and 1,3,5-trinitro-1,3,5-triazinane fabricated via electrospinning technique
- Dynamic response of UHMWPE plates under combined shock and fragment loading
- Model-based deep learning for fiber bundle infrared image restoration
- Robust design and analysis for opto-mechanical two array laser warning system
- Combustion behavior and mechanism of molecular perovskite energetic material DAP-4-based composites with metal fuel Al
- Perforation studies of concrete panel under high velocity projectile impact based on an improved dynamic constitutive model
