Perforation studies of concrete panel under high velocity projectile impact based on an improved dynamic constitutive model
2023-10-09FeiZhouHoWuYuehuCheng
Fei Zhou ,Ho Wu ,* ,Yuehu Cheng
a Department of Disaster Mitigation for Structures,College of Civil Engineering,Tongji University,Shanghai,200092,China
Keywords:Concrete panel Projectile Dynamic fracture Scabbing limit Constitutive model
ABSTRACT The finite-depth concrete panels have been widely applied in the protective structures,and its impact resistance and dynamic fracture failures,especially the scabbing/perforation limits,under high velocity projectile impact,are mainly concerned by protective engineers,which are numerically studied based on an improved dynamic concrete model in this study.Firstly,based on the framework of the KCC (Karagozian&Case concrete)model,a dynamic concrete model is proposed which considers an independent tensile damage model and a continued transition between dynamic tensile and compressive properties.Secondly,the strength surface,equation of state and damage parameters of the proposed model are comprehensively calibrated by a triaxial compressive test with high confinement pressure,the rationality of which is further verified based on the single element tests,e.g.,uniaxial and triaxial compression as well as uniaxial,biaxial and triaxial tension.Thirdly,a series of projectile high velocity impact tests on thin and thick concrete panels are simulated,which indicates that the projectile residual velocity and dynamic fracture failures are reproduced satisfactorily,while the KCC model underestimates both the spalling and scabbing dimensions severely.Finally,based on the validated concrete model and finite element analyses approach,the validations of the existing five empirical formulae are evaluated,in terms of the depth of penetration(DOP)and scabbing/perforation limits of concrete panel.Both the Army corps of engineers (ACE) and modified National Defense Research Committee (NDRC) formulae are recommended in the design of the protective structure to avoid scabbing failure.
1.Introduction
As a primary building material,concrete has been widely applied in the constructions of civil and military protective structures to resist accidental impact loadings.The impact resistance,e.g.,depth of penetration(DOP)or projectile residual velocity,and dynamic fracture failures,e.g.,spalling and scabbing in the structural front and rear surfaces,of concrete targets struck by high velocity projectile are mainly concerned by protective engineers.Majority of the existing work [1-5] concentrate on the projectile penetrations into the semi-infinite target.Comparably,the related studies on the finite-depth concrete panels are limited,despite that they are widely exist in the protective structures.Due to the intensive tensile stress wave and punch shear function of projectile,the scabbing failure would appear near the structural rear surface,causing the concrete splash that endangers the inner personal safety.Therefore,for the practical design of the concrete protective structures,the impact resistance and dynamic cracking failures of finite-depth concrete panels,especially the scabbing/perforation limits(the minimum structural thicknesses required to prevent the scabbing/perforation failures under a giving impact velocity),should be paid more attentions.
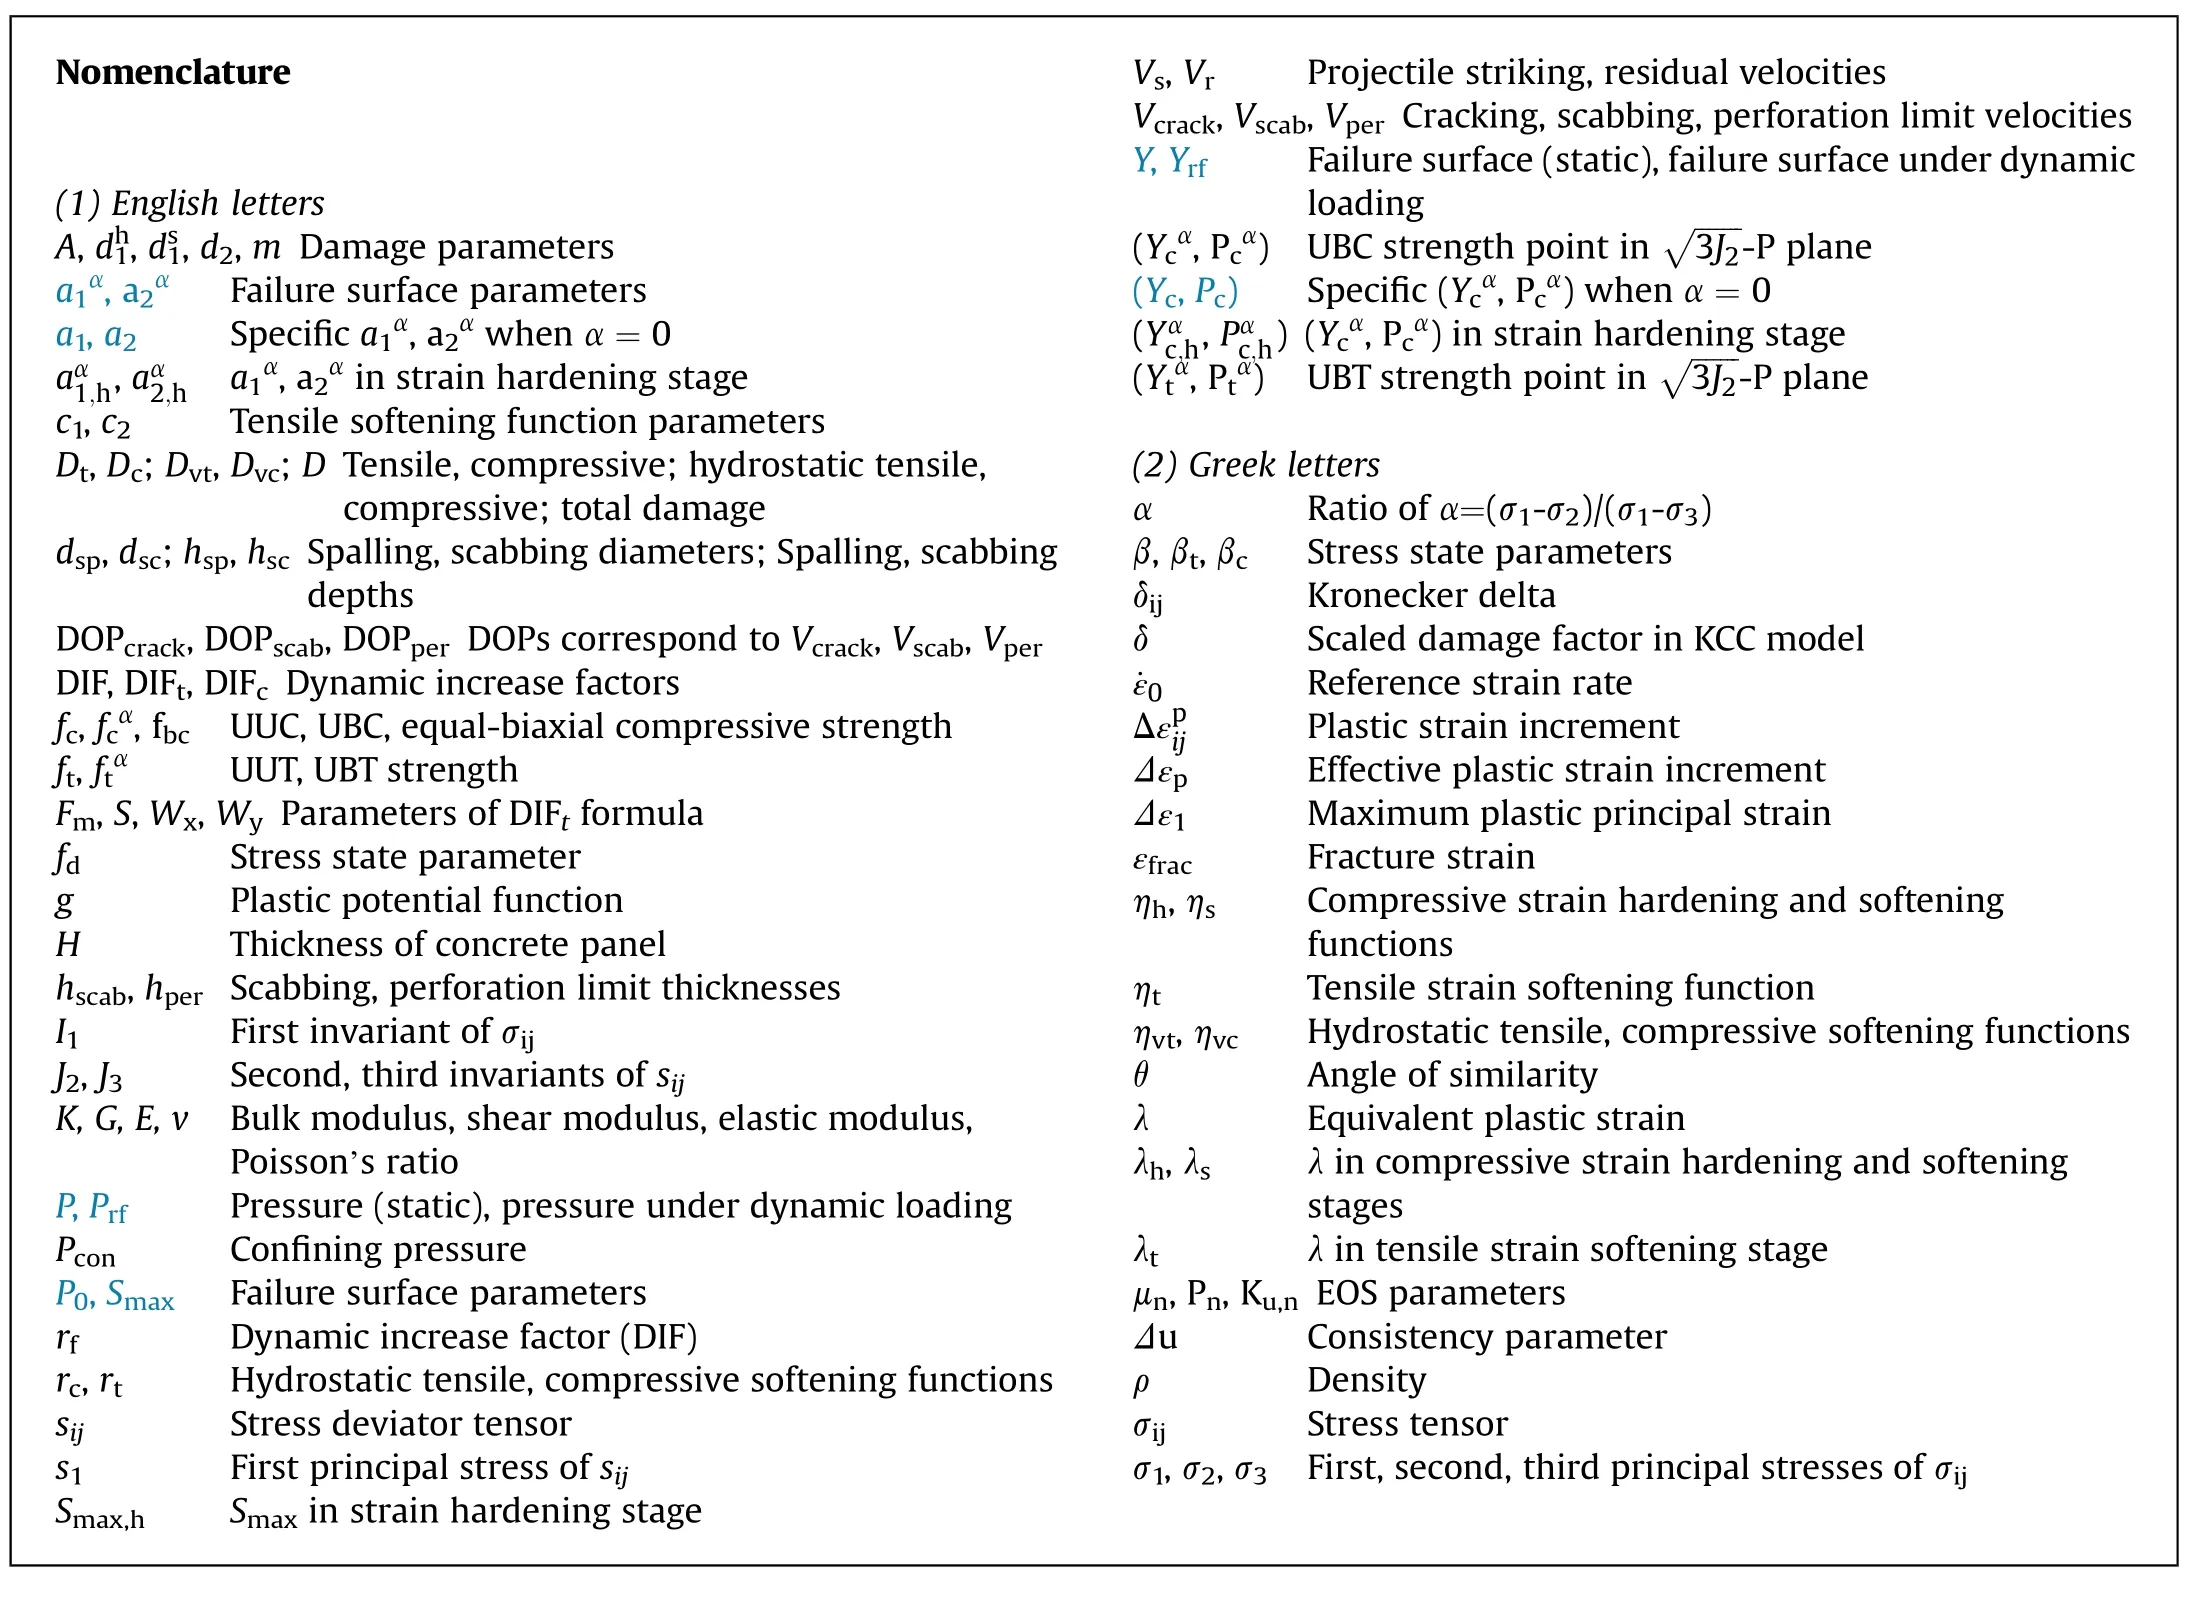
The projectile perforation test is a usual practice to examine the performance of concrete panel under high velocity projectile impact.Hanchak et al.[6]performed a series of 25.3-mm-diameter projectile perforation tests on the 178-mm-thick normal strength(48 MPa)and high strength(140 MPa)concrete panels,and derived that the residual velocity is not strongly affected by the compressive strength at high impact velocity.Using a 50 mm-diameter projectile,Cargile et al.[7] conducted a set of perforation tests on 38 MPa concrete panels with the thicknesses of 127-284 mm and striking velocities of 306-473 m/s,in which an onboard accelerometer was adopted to record the projectile decelerations.By launching a 152-mm-diameter projectile at striking velocity of 459 m/s,Hansson and Skoglund[8]conducted a perforation test on the 750-mm-thick concrete panel (compressive strength of 92 MPa),and experimentally measured the residual velocity of projectile by comprehensively using the high-speed camera,accelerometer and Doppler radar.Unosson and Nilsson [9] conducted a 75-mm-diameter projectile perforation test on the 153 MPa high performance concrete panel with the striking velocity of 620 m/s.The residual velocity after perforating the 400 mm-thick panel is monitored by a Doppler radar.To examine the effect of target thickness and the measurement method of the residual velocity,Li et al.[10] launched a 64-mm-diameter projectile striking on the 34 MPa concrete panels with the thickness of 300-700 mm and incidence velocity of 400 m/s.Based on the 20-mm-diameter projectile impact test on the 50-mm-thick concrete panel,Kristoffersen et al.[11] experimentally determined the ballistic limit (the minimum impact velocity required to perforate target) for the C35,C75,and C100 concrete panel,respectively.Besides,Peng et al.[12]and Xu et al.[13]experimentally evaluated the projectile perforation resistance of two new types of concrete panel,i.e.,ultra-high performance steel fiber reinforced concrete(UHPSFRC) and ultra high toughness cementitious composites(UHTCC).In the aforementioned work,the projectile residual velocity is considered as a key parameter to assess the perforation resistance of concrete panel.Comparably,the fracture failure patterns of concrete panel are usually not given in detail.Previously,we conducted a set of 25.3-mm-diameter projectile perforation tests on the monolithic and segmented concrete panels(100-300 mm in thickness,compressive strength of 41 MPa),and give the comprehensive test data of the cratering dimensions,projectile residual velocities and decelerations [14].
With the help of the refined and validated concrete material model,the numerical simulations can reproduce the instantaneous stress variation (impact resistance in particular) and damage evolution(fracture failures in particular)of concrete target,which has become a more efficient and low-cost approach to tackle the projectile perforation issue.By adopting a Mohr-Columb criterion and introducing a compressive damage,Huang et al.[15] modified the Taylor-Chen-Kuszmaul (TCK) model [16] which predicts a perfect elastic-plastic compressive response.It indicates that the modified TCK model predicts the fracture of concrete panels and projectile residual velocities in the perforation test [6] with reasonable results.Considering that the Holmquist-Johnson-Cook(HJC)[17]and TCK models respectively ignore the tensile and compressive damage,Liu et al.[18] proposed an improved concrete model by combining the tensile region of TCK model and the compressive region of HJC model,which showed improvement in predicting the cratering dimensions in the front and rear surfaces of concrete panels in the perforation test [6].To predict the front spalling and rear scabbing damage modes of concrete panel under projectile impact,Kong et al.[19] comprehensively modified the HJC model by introducing tensile damage and damage-based erosion criterion,considering the Lode-dependence,improving the strain rate effect and calibrating material parameters.By comparing with the perforation test [6],it was found that the modified HJC model predicts the fracture failures reasonably well,while the original HJC model cannot reproduce the fracture failure.Furthermore,Kong et al.[20] modified the Karagozian &Case concrete (KCC) model[21]by adopting an improved tensile damage model and calibrating the strength surface,strain rate effect and damage function parameters.The modified KCC model was demonstrated to have good performance in predicting the dynamic fracture failures,while the original KCC model underestimates the spalling and scabbing dimensions largely.Bai et al.[22]proposed a dynamic concrete model that treats tensile damage (controlled by growth of micro-cracks)and compressive damage (controlled by collapse of micro-voids)separately.It draws that the new model has good capacity over the HJC model in predicting both the projectile residual velocity and fracture failures.Recently,Xu and Wen [23] proposed a constitutive model for concrete that considers the strain hardening and softening,tensile and compressive damage,strain rate and Lode-angle effects.Based on the proposed model [23],Xu et al.[24,25] further build the homogeneous and three-dimension (3D)meso-mechanical models of concrete target,and numerically studied the penetration and perforation of concrete targets under projectile impact.By examining the projectile deceleration,residual velocity and target cracking patterns,it was found that the proposed concrete model has better performance in predicting the front and rear cratering dimensions,and the 3D meso-mechanical model has better predictions than the homogeneous model.
Generally,to precisely reproduce the compression-dominated impact resistance and the tensile-critical fracture failures of concrete panel struck by projectile,suitable improvements should be made on the exiting concrete models in commercial hydrocodes,e.g.,the TCK,HJC,and KCC models,since these models have their inherent disadvantages in describing the dynamic tensile or compressive properties of concrete.However,these aforementioned numerical studies still have the following limitations as (i)the tensile and compressive properties of concrete are treated separately without considering a transition.Specifically,Liu et al.[18] considered the tensile and compressive strength surfaces independently,causing the discontinuous of strength surface at the intersection point of tensile and compressive regions,where the hydrostatic pressurePequals zero.Although the strength surface used by Kong et al.[19,20]and Xu and Wen[23]keeps continuous,the dynamic tensile and compressive damage accumulation is discontinuous whenP=0,which results in different dynamic material responses in the tensile and compressive regions as the pressure goes close to 0;(ii) Cui et al.[26] have experimentally derived that the hydrostatic compression behavior causes damage to the unconfined uniaxial tensile and compressive (UUT/UUC)strength,while most of the existing models and their modifications[15,16,19-21,23]neglected the hydrostatic damage;(iii)Most of the existing work[15-25]are only focused on the perforation scenario where the projectile residual velocity and cratering dimensions of the concrete panels are assessed.Relatively limited concern is paid to the dynamic response of concrete panels before perforation appears,e.g.,the DOP,fracture failures and the scabbing/perforation limits,which are more critical for the practical engineering designs of protective structures.
In this paper,the projectile perforation resistance,fracture failures,and the scabbing/perforation limits of finite-depth concrete panel under high velocity projectile impact are numerically studied.In Section 2,to precisely describe the impact resistance and fracture failures,an improved dynamic constitutive model is established on the basis of KCC model [21].The tension and compression properties are described separately,and a continued transition between them is considered depending on the stress state.Besides,the damage caused by hydrostatic compression is also introduced.In Section 3,the strength surface,equation of state(EOS) and damage parameters of the proposed model are comprehensively calibrated by triaxial test data,and the capacity of which in describing the basic mechanical properties of concrete is assessed based on the single element test under tensile and compressive stress states.In Section 4,a set of our previously performed perforation tests[14]are numerically simulated,and the proposed model is further validated by comprehensively comparisons of the experimental residual velocity and deceleration of projectile,as well as the cratering dimensions of thick and thin concrete panels.Comparably,the prediction capacity of the KCC model is also examined.Furthermore,in Section 5,based on the validated concrete model and the finite element analyses approach,the validations of the existing five empirical formulae are evaluated,in terms of the depth of penetration (DOP),perforation limit and scabbing limit.Lastly,brief conclusions of this study are summarized.
2.Dynamic constitutive model of concrete
In this section,to better describe the compressive and tensile properties of concrete,based on the framework of KCC model,an improved dynamic constitutive model is established.Firstly,a hyperbolic 3D failure criterion is proposed.Then,the maximum,initial and residual failure surfaces are introduced with considering the strain rate effect.The proposed model describes the tensile and compressive damage independently,with a continued transition.The hydrostatic damage on tensile and compressive strength is also introduced.Besides,a brief introduction of the KCC model is presented in the Appendix.
2.1.Hyperbolic three-dimensional failure criterion
2.1.1.Preliminaries
At present,the compressive and tensile stresses are marked as negative and positive,respectively.By referring to Chen [27],the principal stresses (σ1,σ2,σ3) and angle of similarity θ can be expressed by the invariants of the stress tensor σijas given in Eq.(1),whereP=-I1/3 is the pressure that take compressive stress as positive(I1=σ1+σ2+σ3),J2=sijsji/2,J3=sijsjkski/3 are the invariants of the stress deviator tensor sij=σij+Pδij,and δijis the Kronecker delta.The similarity angle has a range of 0≤θ≤π/3,and θ=0 and θ=π/3 are corresponding to the tensile (σ1>σ2=σ3) and compressive (σ1=σ2>σ3) meridian planes,respectively.
A parameter α=(σ1-σ2)/(σ1-σ3) is introduced to describe the principal stresses state,which is related to the similarity angle θ.On the compressive and tensile meridian planes,α equals to 0 and 1,respectively.Therefore,σ2can be replaced by α to expressJ2as presented in Eq.(2a).Particularly,by setting σ1=0,α=σ2/σ3is the principal stress ratio,and the unconfined biaxial compressive(UBC)strength correspond to the ratio of α can be derived asfcα=-σ3.On the meridian plane,the biaxial strength envelope is described by the points(Ycα,Pcα).According to Eq.(2a)and by satisfying σ1=0 in Eq.(1a),YcαandPcαcan be determined as Eq.(2c) and Eq.(2d).
2.1.2.Failure criterion
Eq.(3a)presents the hyperbolic compressive meridian proposed by Kong et al.[28] based on the KCC model,which has three features:(i)as the pressure goes to infinite,the compressive meridian has a maximal valueSmax,namely the asymptotic line of this hyperbolic curve;(ii)it passes explicitly through its intersection point with the plane of σ1=0,which is the UUC strength point (Yc,Pc)=(fc,fc/3).Note that(Yc,Pc)is the specific value of(Ycα,Pcα)when α=0;(iii) the criterion intersects with the P axis at the pressure point P0.Eq.(3b) gives the expressions of Smaxand P0,indicating that the parameters(Smax,P0)and(a1,a2)can be derived from each other.
A three-dimension failure criterion Eq.(4a) is proposed based on this hyperbolic compressive meridian,where the superscript α represents the effect of intermediate principal stress σ2.Fig.1(a)presents the sketch map of the present strength criterion on the meridian plane.It keeps the same three features as the compressive meridian:(i)interacts withPaxis atP0,(ii)has an asymptotic line ofSmax,(iii) passes through the UBC strength points (Ycα,Pcα).The parametersP0andSmaxare independent on σ2(or the similarity angle θ),thus,the failure surface closes atPaxis and the deviatoric section shape transits to a circle at high pressure range.Besides,the parametersa1αanda2αare extended froma1anda2by further considering the effect of θ,and can be obtained according to their relations withP0andSmax,as given in Eq.(4b) and Eq.(4c).
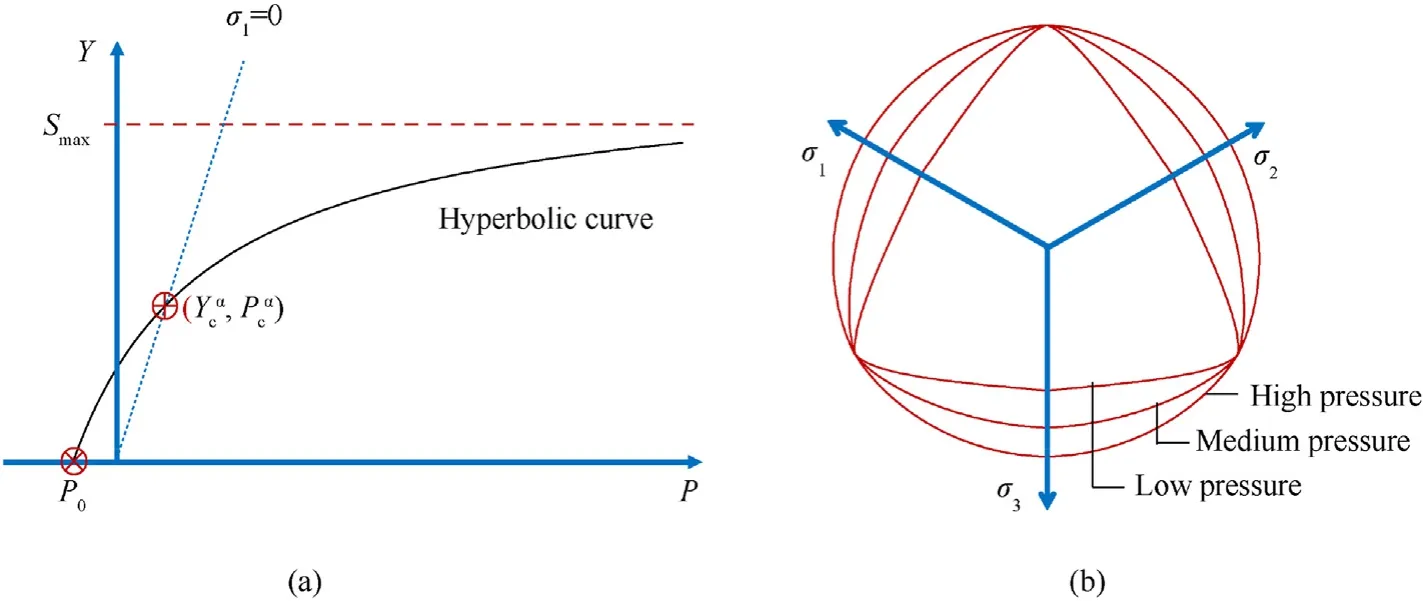
Fig.1.Sketch map of failure criterion: (a) Meridian;(b) Normalized deviatoric section.
To solve Eq.(4),it needs to find the biaxial strength envelope(Ycα,Pcα),the calculation method of which is given in Eq.(2c) and Eq.(2d),where the UBC strengthfcαis needed.At present,an empirical formula Eq.(5) suggested by Kupfer and Gerstle [29] is adopted,wherefbcrepresents the equal-biaxial compressive strength.This is a one-parameter function that the normalized UBC strengthfcα/fcis only determined by the ratio offbc/fc.According to the biaxial compression test of Kupfer et al.[30],thefbcis suggested asfbc=1.16fc.Fig.2 presents the biaxial failure envelope predicted by Eq.(5),which has good agreements with the test data of normal strength concrete.
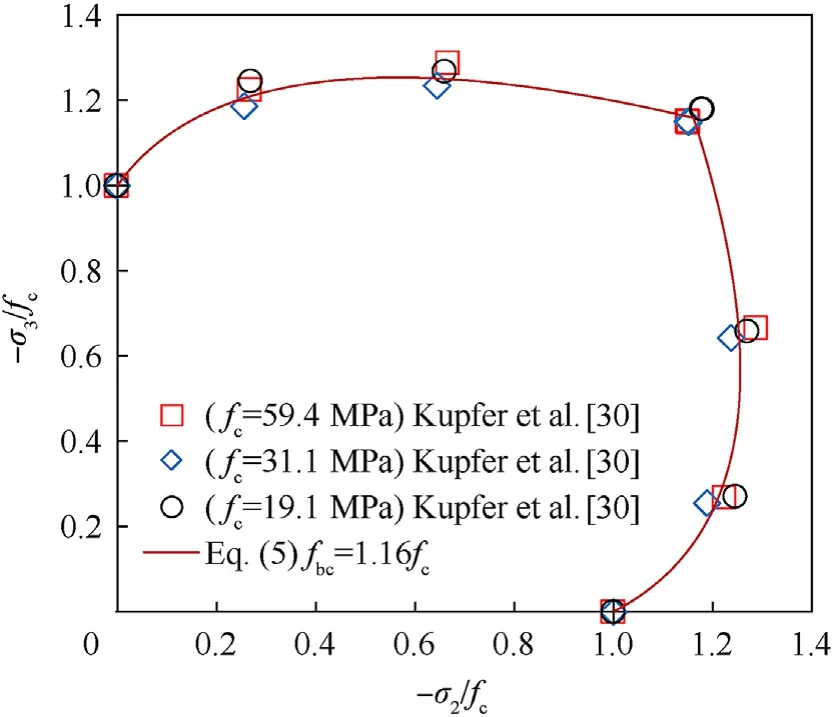
Fig.2.Comparisons of experimental and calculated UBC strength.
2.1.3.Applicability check
To verify the nonlinear unified strength criterion,the triaxial and multiaxial tests conducted on normal strength concrete at Tsinghua University in 1980s [31] are referred.Fig.3 shows the meridians and deviatoric sections predicted by Eq.(4),where the parameters are set asa1=0.53 anda2=(19fc)-1,namelyP0=-0.187fcandSmax=20fcaccording to Eq.(4b).It shows that the predictions well cover most of the test data on both the meridian and deviatoric planes.Furthermore,the normalized deviatoric sectionsY(α)/Y(α=0)atP/fc=0,15 and 100 are also presented in Fig.1(b),indicating that the deviatoric section shape transform from an irregular hexagonal pyramid to a circle with the increase of pressure.Thus,the present failure criterion well captures the Lodedependence.
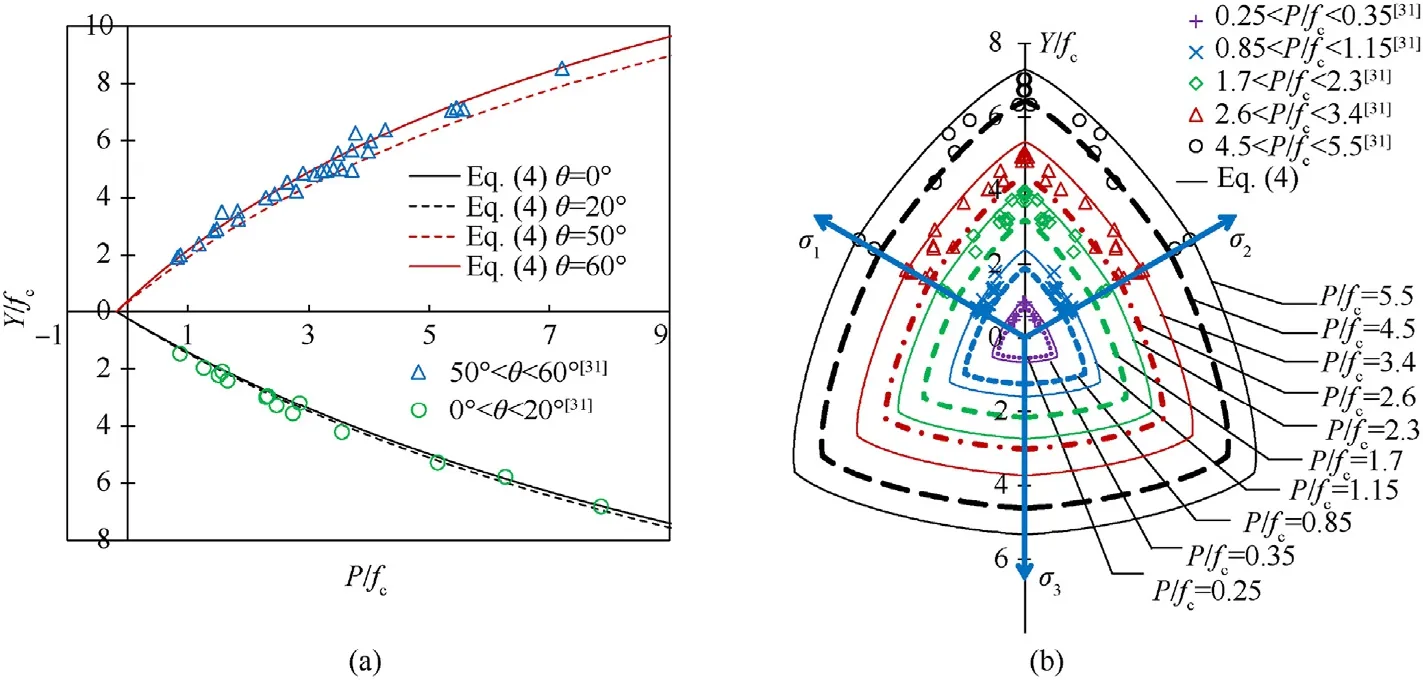
Fig.3.Comparisons of experimental and calculated: (a) Meridians and (b) deviatoric sections.
2.2.Failure surface
2.2.1.Maximum failure surface
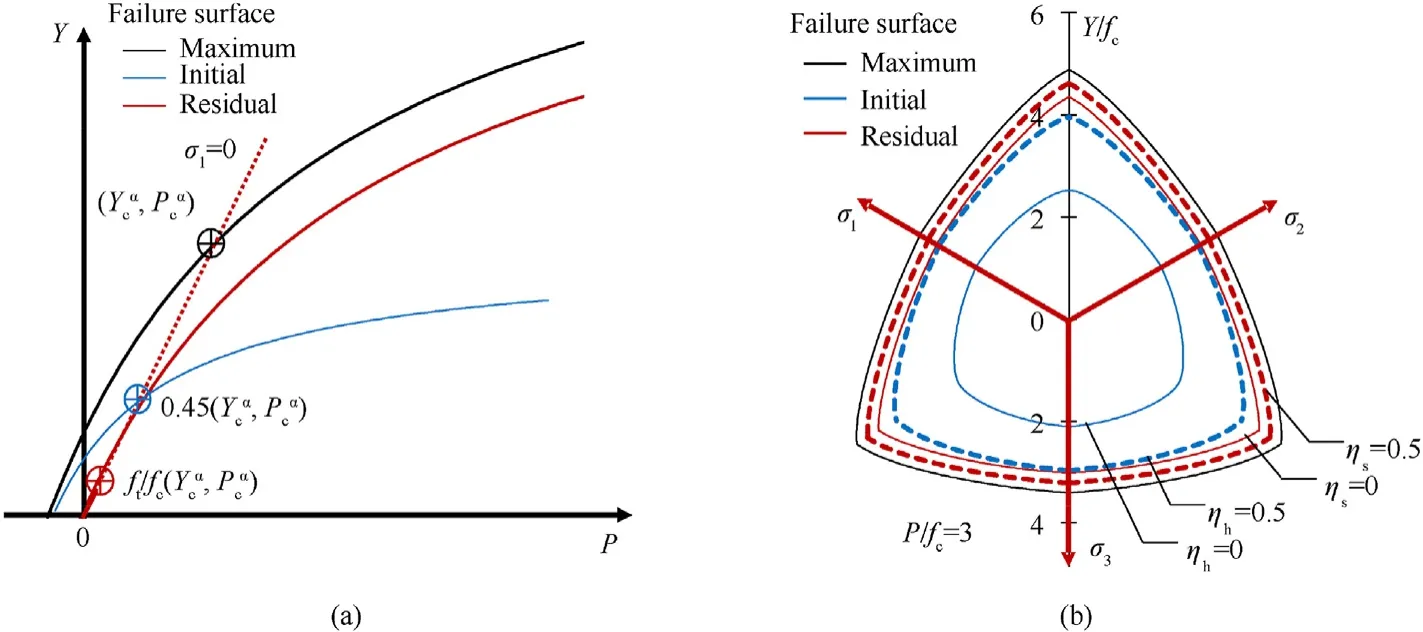
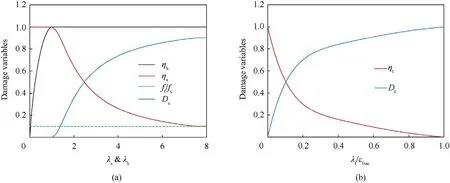
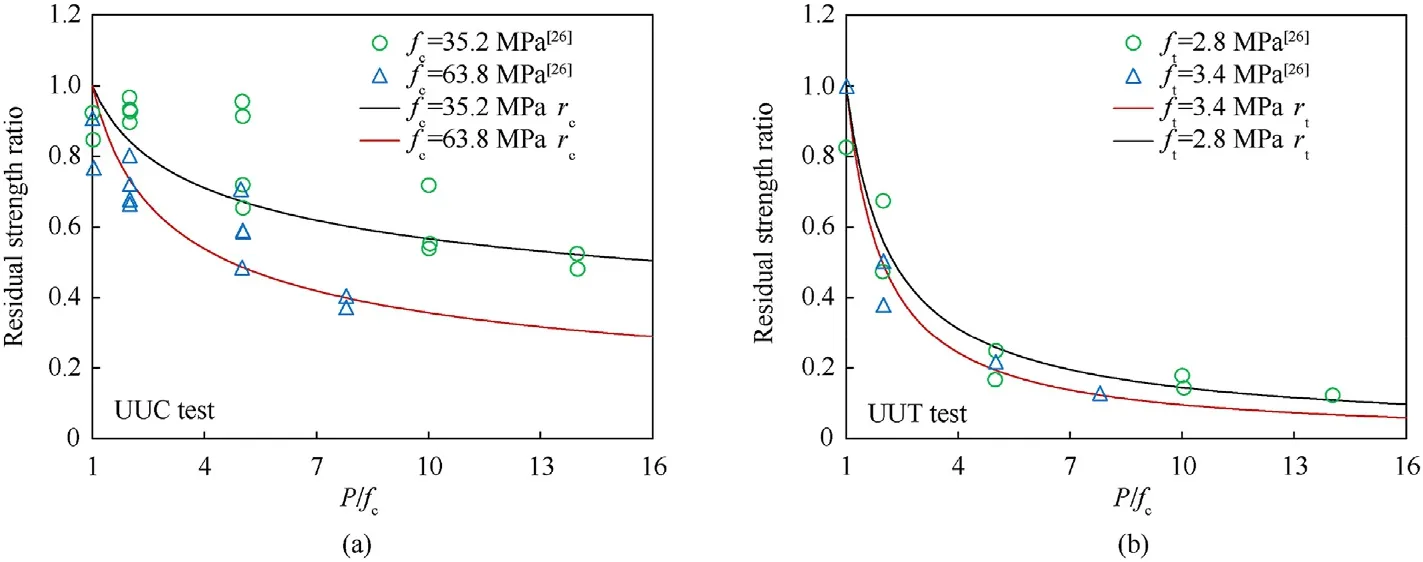
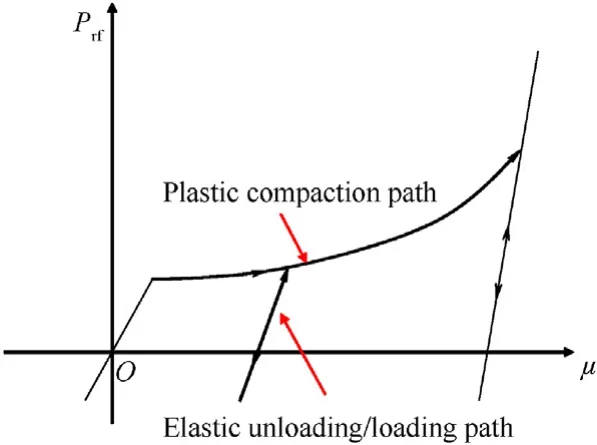
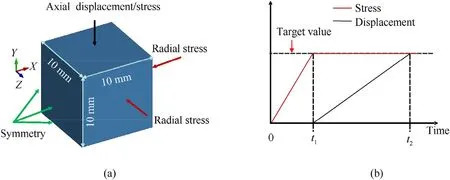
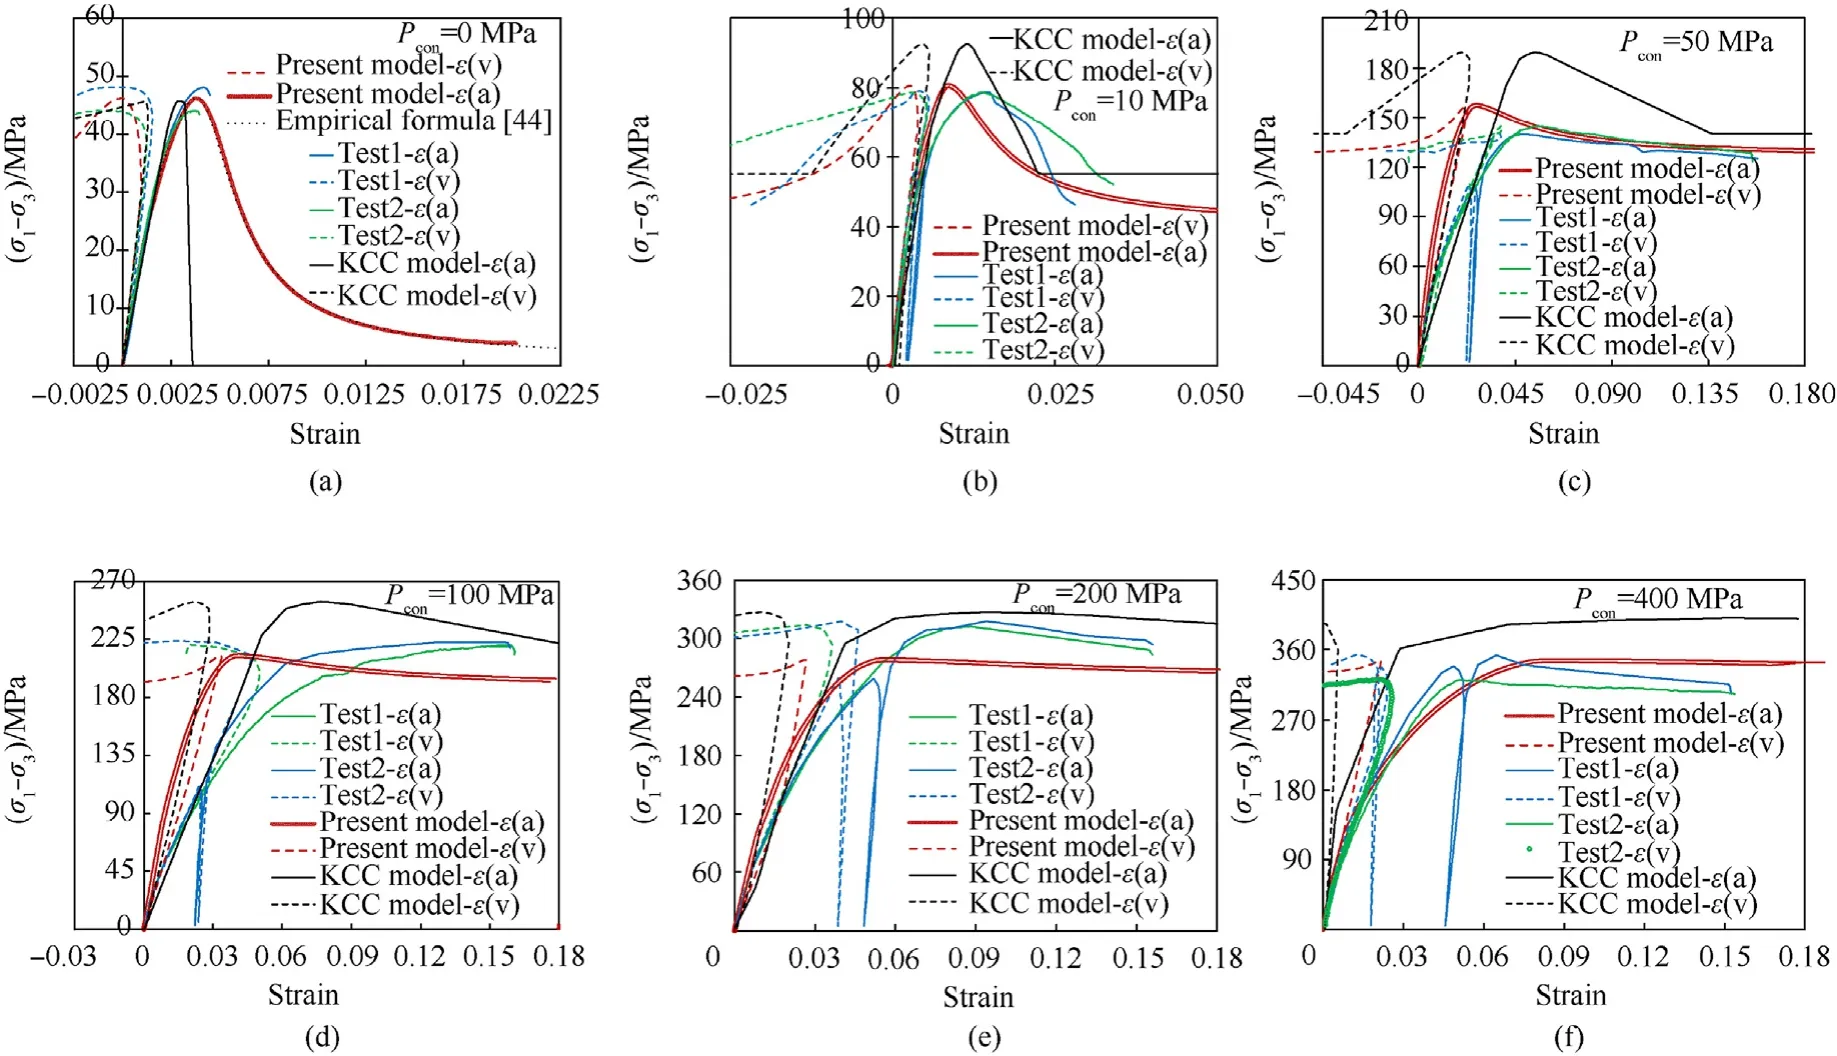
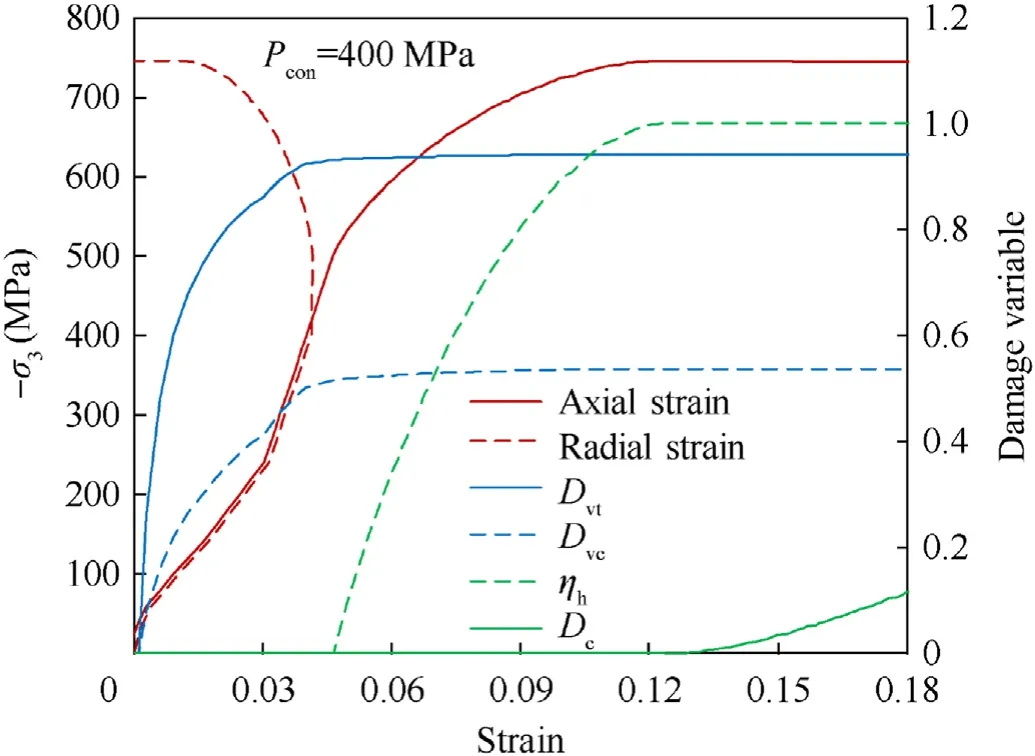
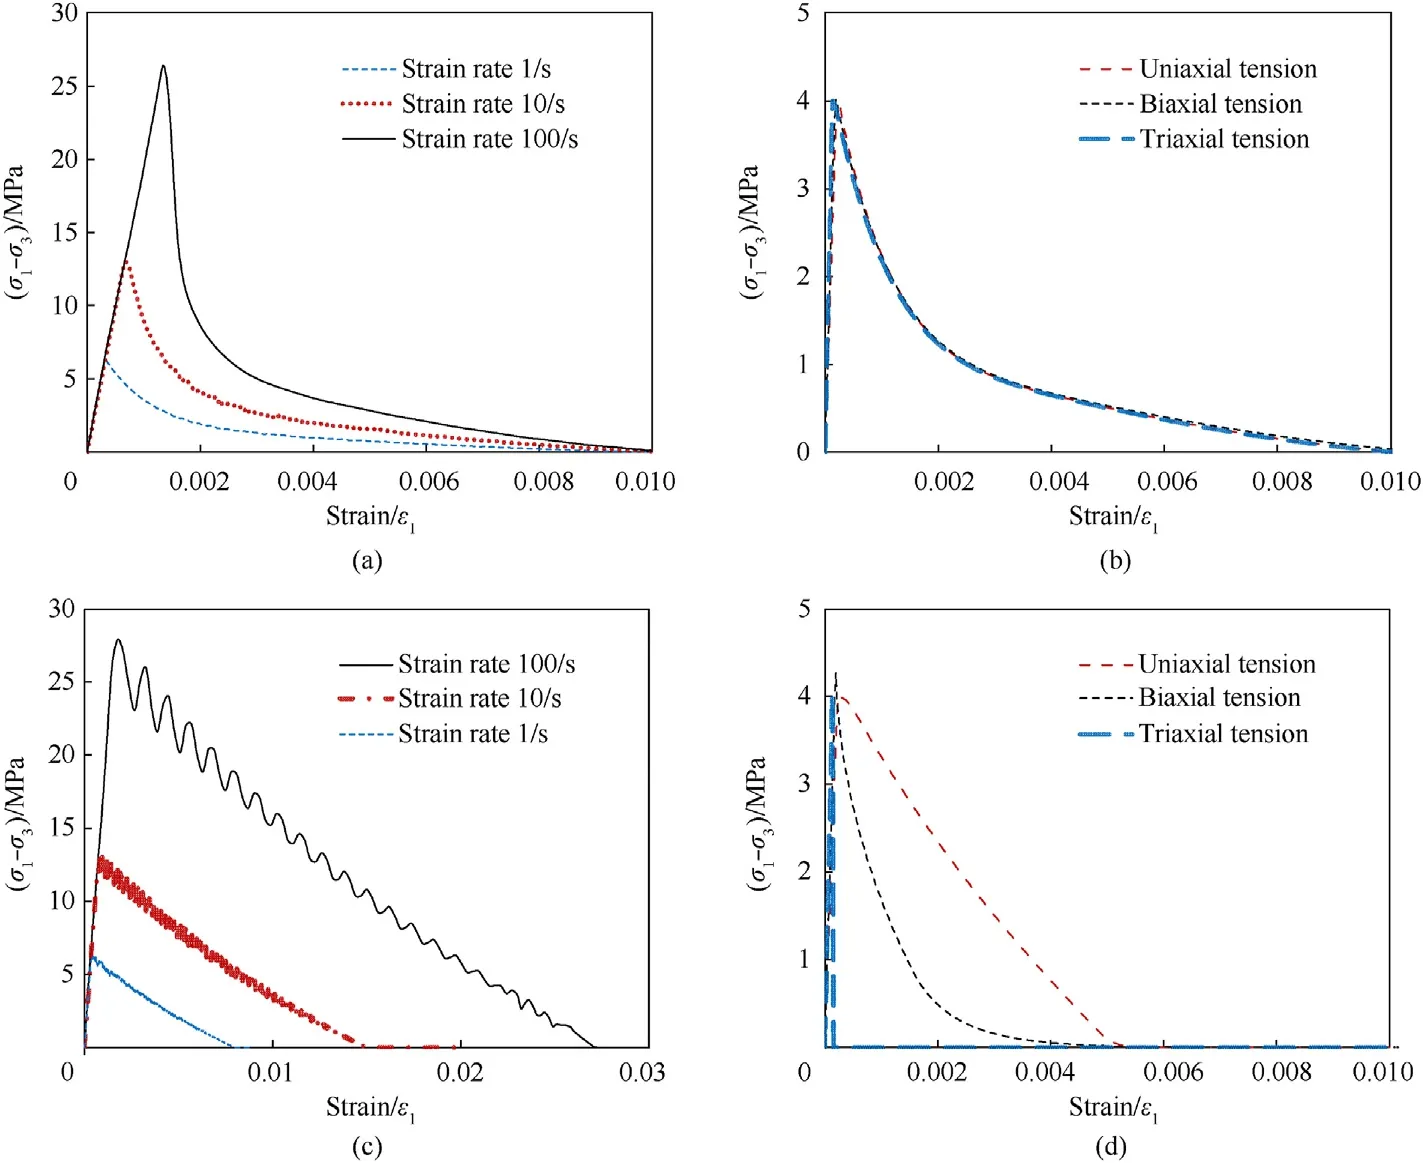
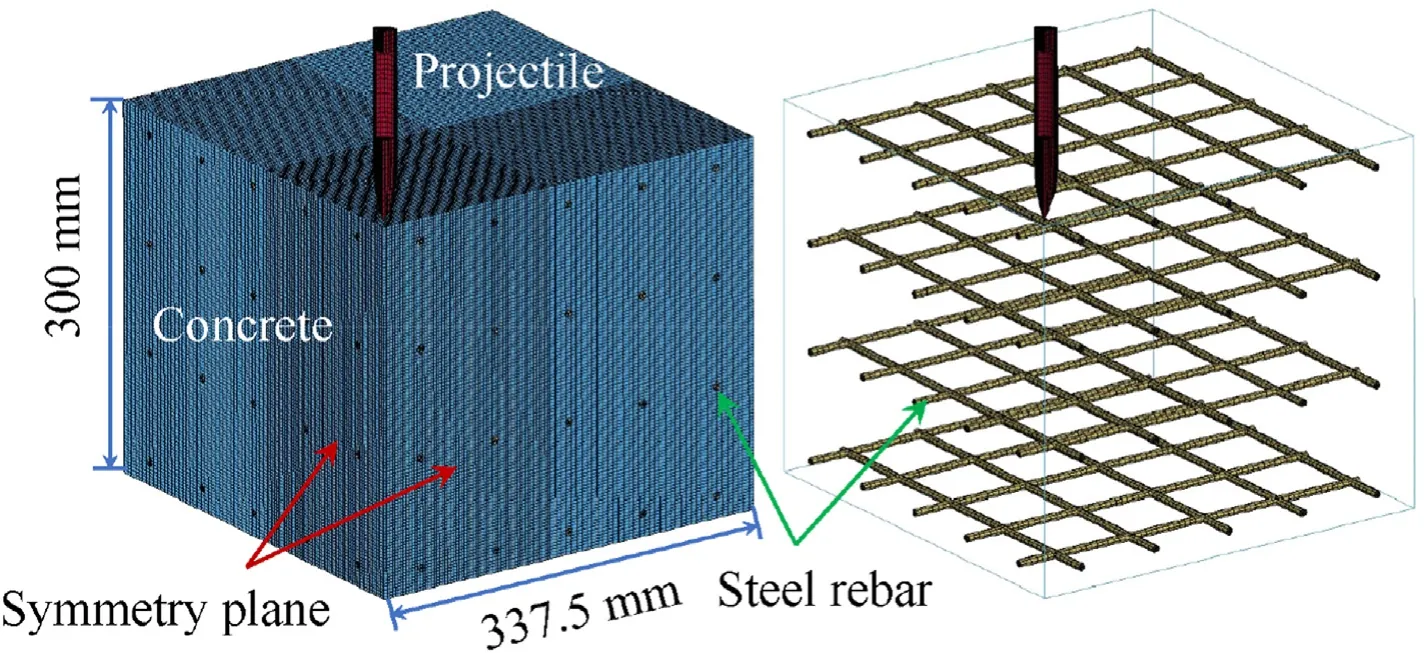
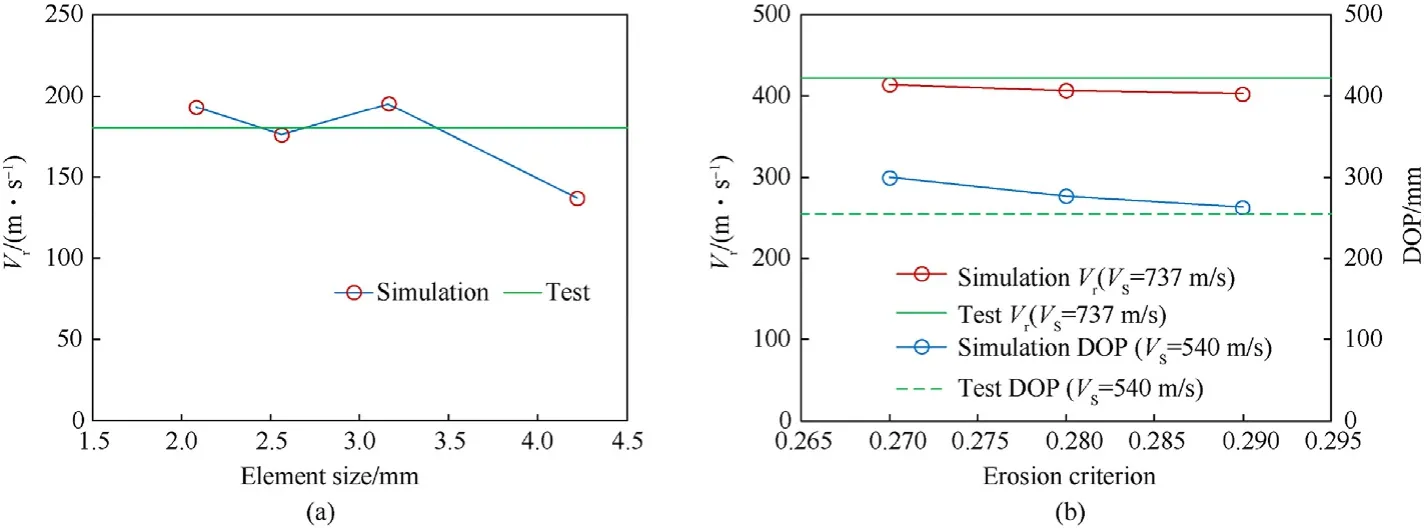
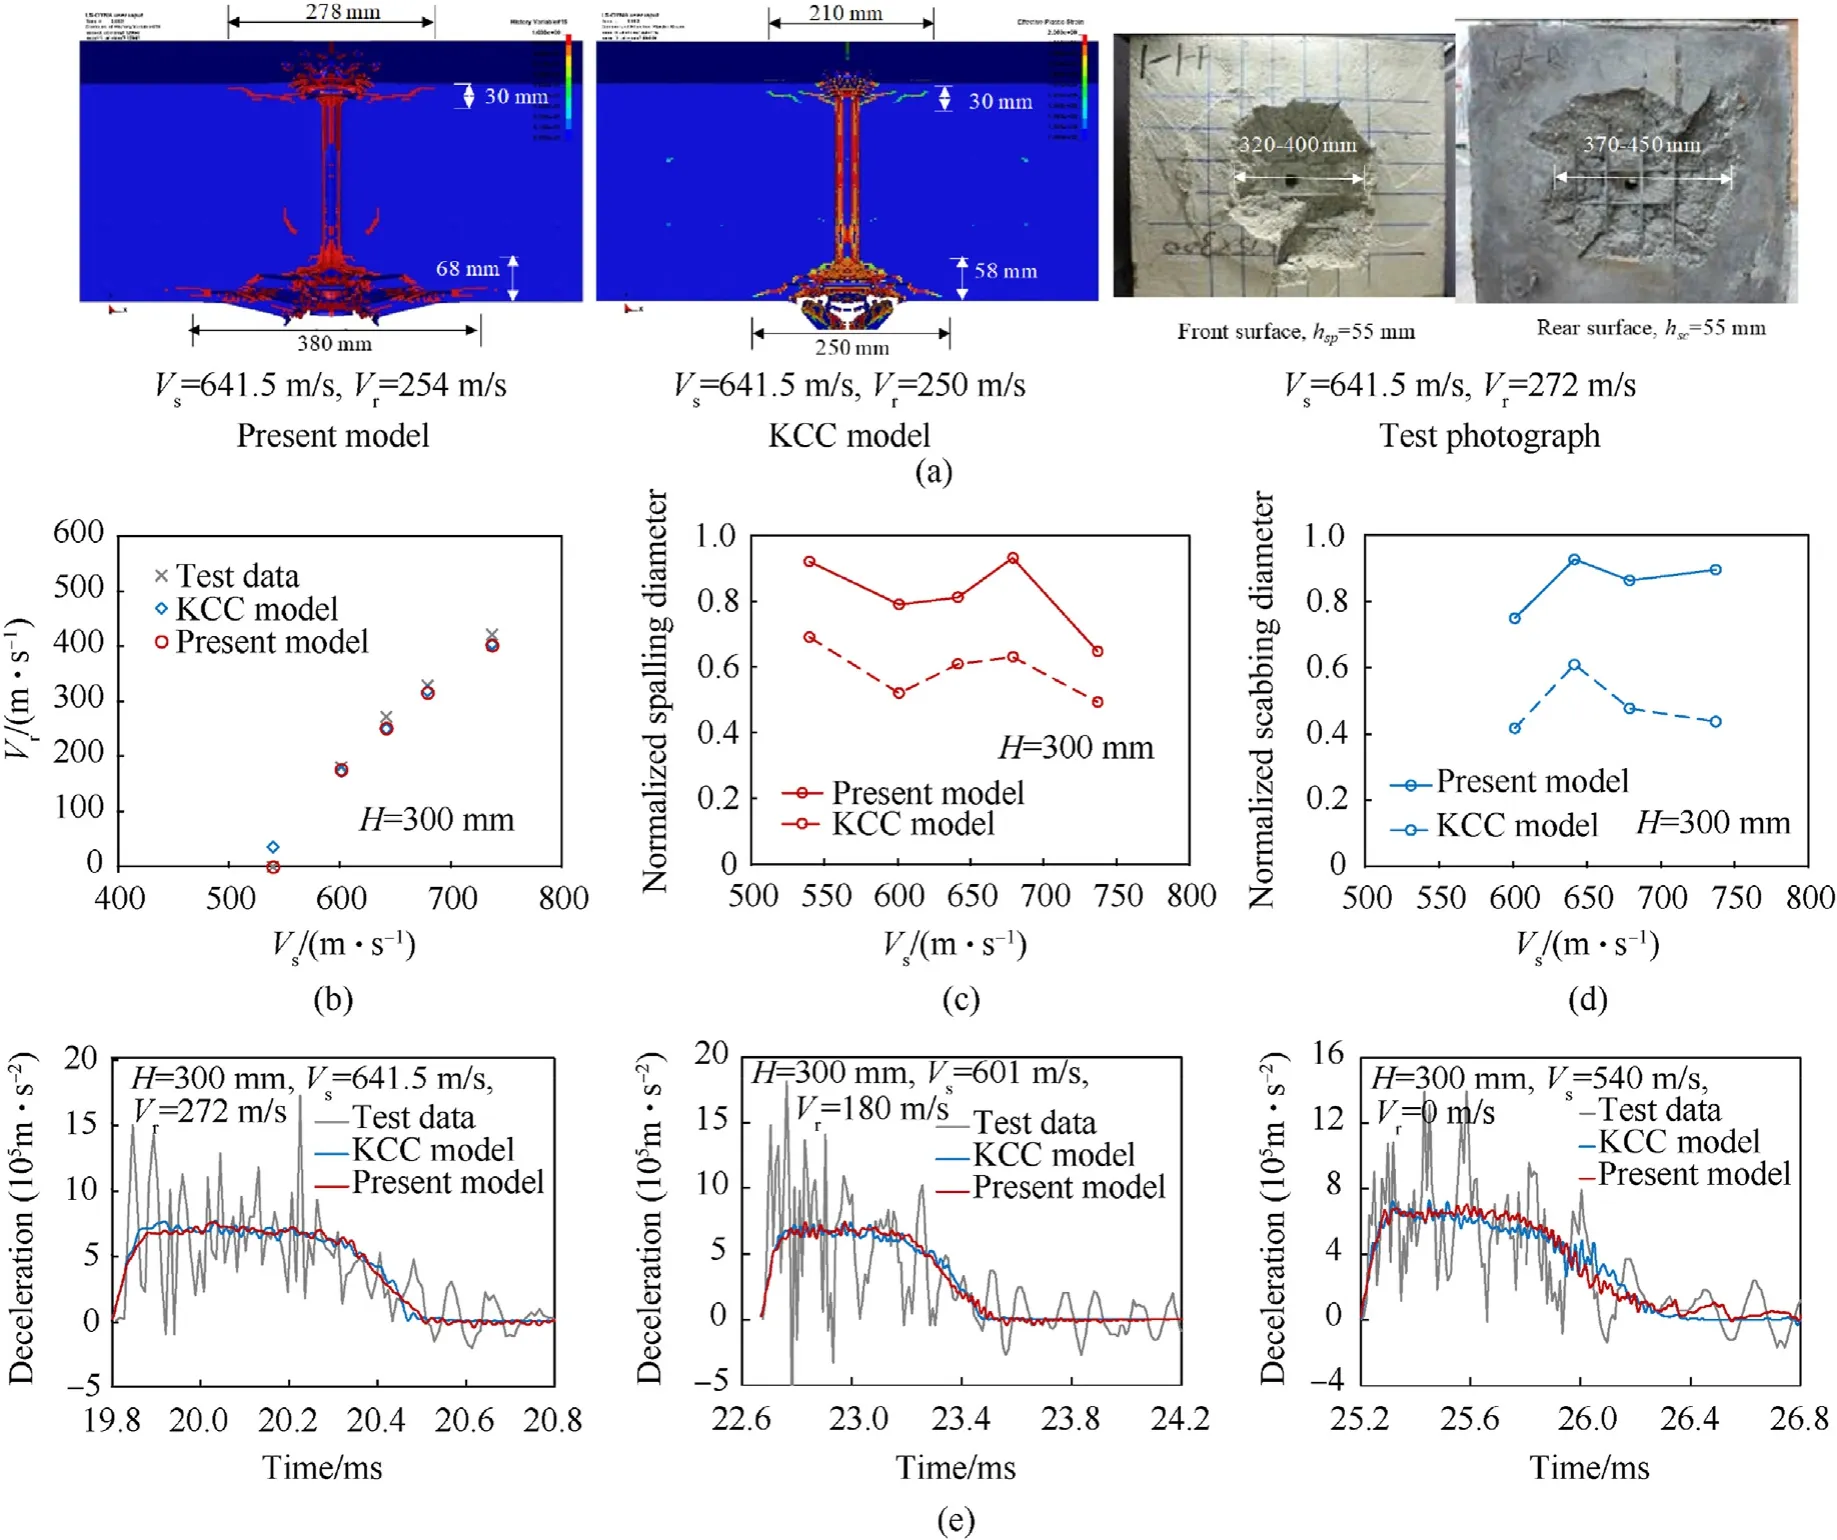
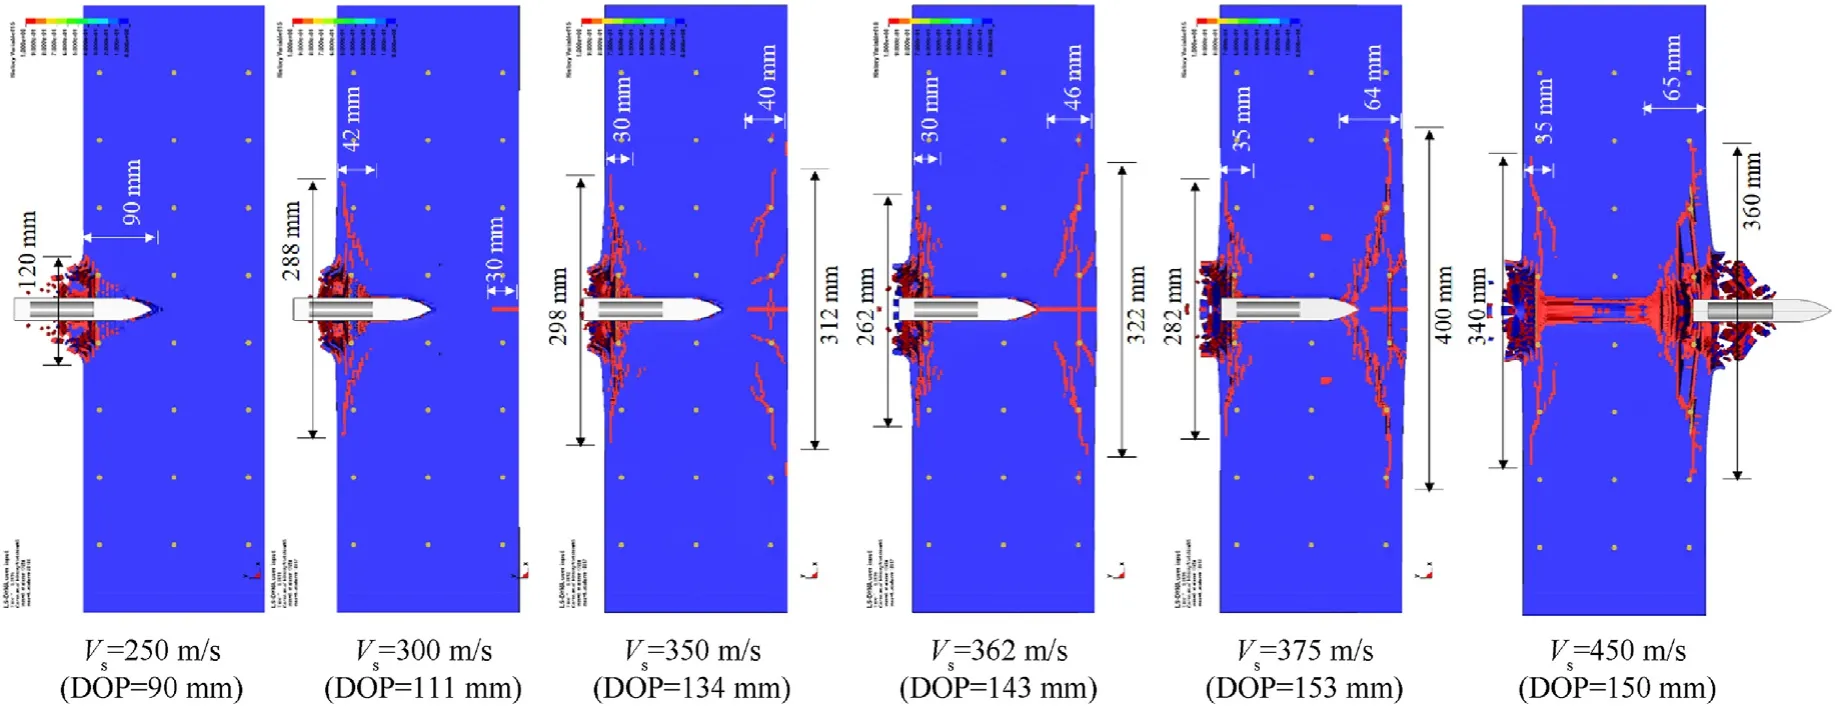
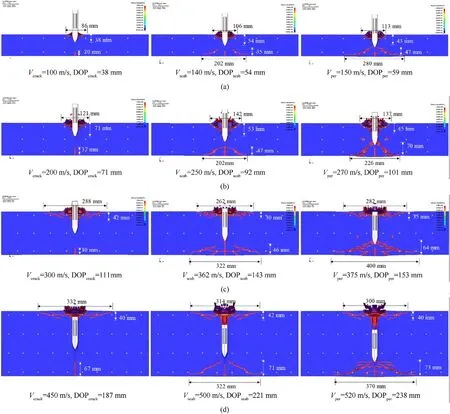
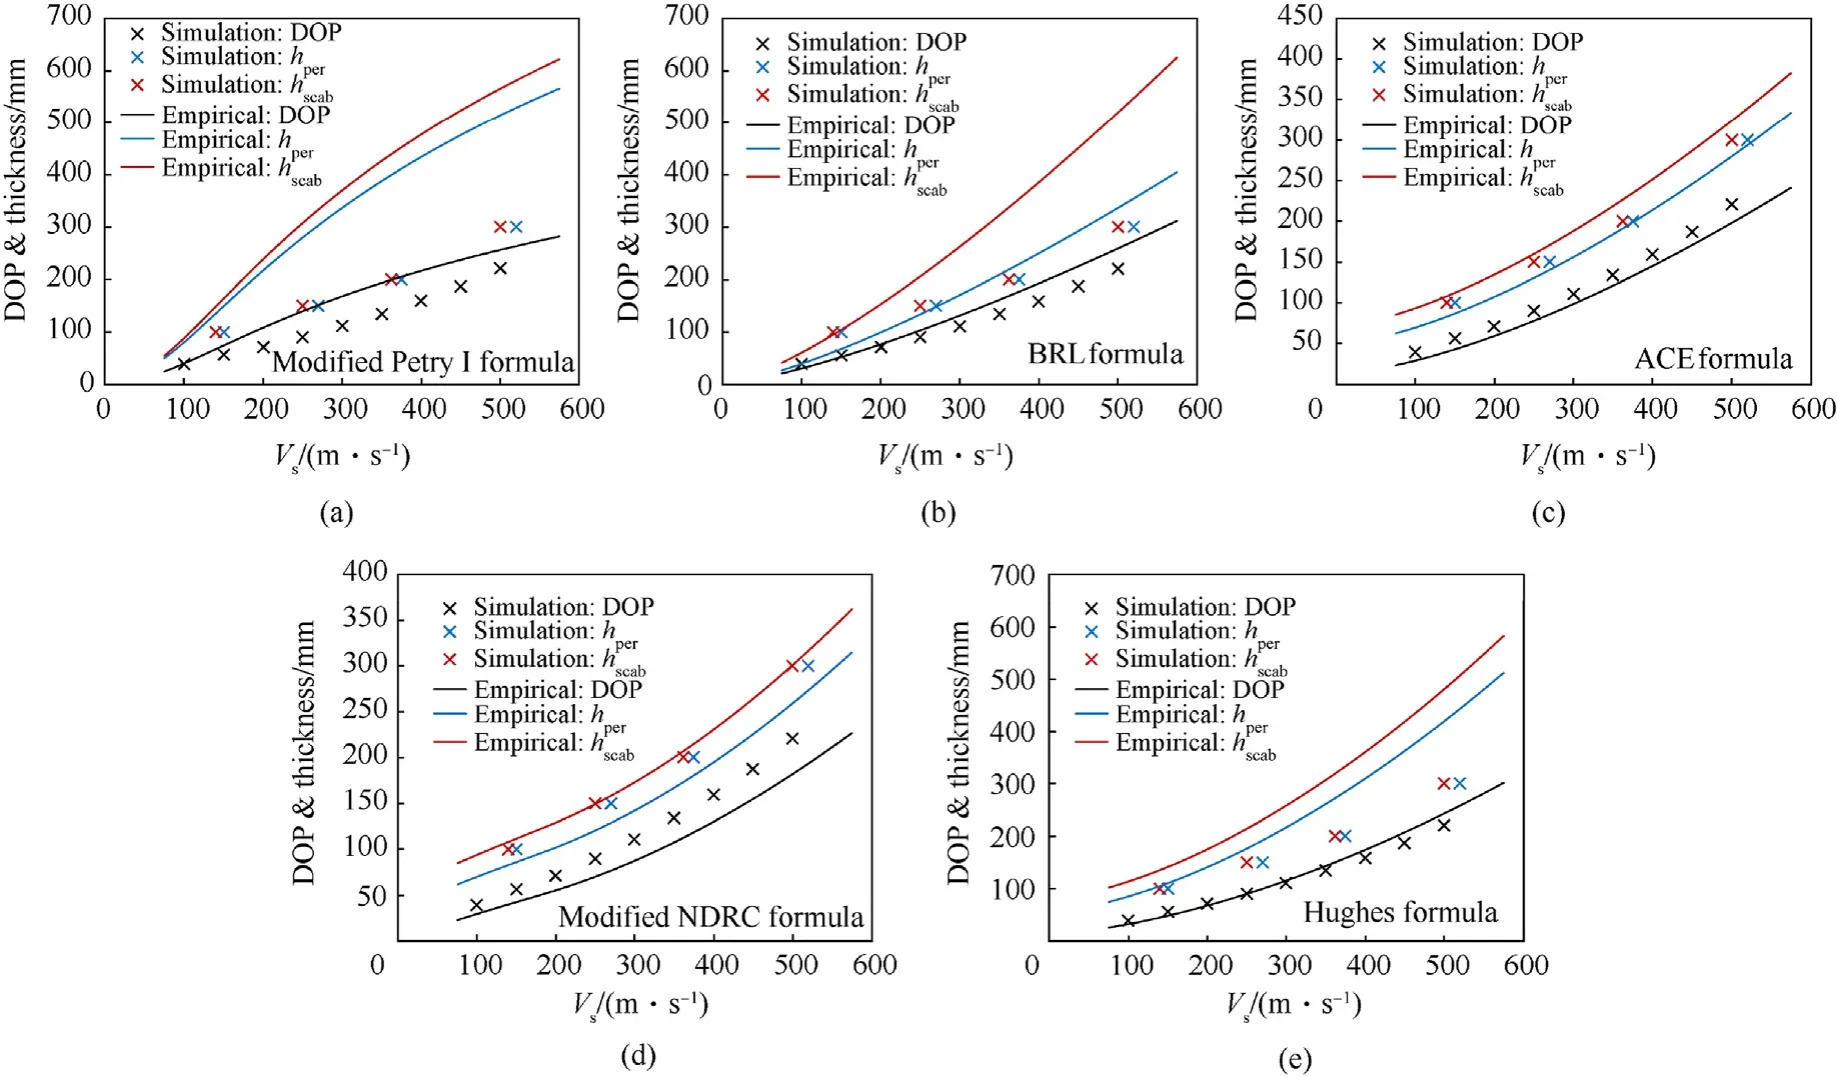
Note that Eq.(4)is applied to compressive stress state(σ1≤0),and it overestimates the strength under low pressure range(P When the pressure lies betweenPtαandPcα,the maximum failure strength is obtained by taking linear interpolation betweenYtαandYcα,seeing Eq.(7).Fig.4 shows the maximum failure surface of the present model,which indicates that the linear interpolation has good agreement with the test data [31] in the low-pressure range. Fig.4.Maximum failure surface and test data in low pressure range: (a) Sketch map;(b) Comparisons. 2.2.2.Initial yield surface By further utilizing the features of the hyperbolic 3D criterion,an initial yield surface Eq.(8a) is introduced to simulate the strain hardening behavior in the compressive region,where the parameters are shown in Eq.(8b) and ηhis a strain hardening shape function that increases from 0 to 1 with the accumulation of plastic strain.Note that ηh=0 and ηh=1 correspond to the initial yield surface and maximum failure surface,respectively.In the strain hardening stage(0<ηh<1),the failure surface:(i)Interacts with P axis at P0,(ii) has an asymptotic line of Smax,h,(iii) passes through the UBC strength point (,).When ηhequals to 0,the initial yield UBC strength is 0.45fcα,and the initial yield Smaxis set as Smax,h=0.25Smaxby referring to Refs.[33,34].Furthermore,the strain hardening behavior is neglected in the tensile region(P ≤ Ptα),namely the initial yield surface is identical to the maximum failure surface Eq.(6a).Through linear interpolations,the initial yield surface in the low pressure range (Ptα 2.2.3.Residual failure surface Eq.(9) presents the residual failure surface in the strain softening stage,which is assumed to be almost parallel to the maximum failure surface in both the compressive and tensile regions,where ηt(Ytα,Ptα) and ηs(Ycα,Pcα) are the damaged UBT and UBC strength points,and ηtand ηsare the tensile and compressive softening shape functions,respectively.Fig.5 presents the hyperbolic 3D failure surfaces in the strain hardening and softening stages.Similar to the maximum failure surface,it indicates that the damaged failure surfaces in both the strain hardening and softening stages well captures the Lode-dependence. Fig.5.Failure surfaces described by the hyperbolic curve in the compressive region (σ1 ≤0): (a) Meridians;(b) Deviatoric sections at P/fc=3. 2.2.4.Dynamic failure surface Under dynamic loadings,the failure strength is determined by the“radial enhancement”approach[20,21]given in Eq.(10),where rfrepresents DIF,Yrfand Prfare the dynamic failure surface and the pressure under dynamic loadings.The DIFtand DIFcare determined according to the semi-empirical formula proposed by Xu and Wen[35],i.e.,Eq.(11),where the parameters Fm=10,Wx=1.6,S=0.8,and Wy=5.5 are used for normal concrete[35].Besides,=1.0 s-1is the reference strain rate. In the present model,the deviatoric and hydrostatic damage,that caused by the stress deviator and spherical tensors,are considered.As described by Wang et al.[36],the hydrostatic damage is ignored in most of the existing models,including the,KCC [21],Kong-Fang[28] and continuous surface cap (CSC) [37] models.Besides,the usage of damaged UBT and UBC strength in the failure surface brings great convenience to introduce the deviatoric and hydrostatic damage into the tensile and compressive regions,respectively. 2.3.1.Deviatoric damage In each time step,the plastic strain incrementcaused by stress deviator tensor is divided into tensile and compressive parts to accumulate corresponding damage.Eq.(12) expresses the equivalent plastic strain λ,i.e.,the tensile strain softening λt,compressive strain hardening λhand compressive strain softening λs,where Δεpis the effective plastic strain incrementΔε1is the maximum plastic principal strain,andd2are the damage parameters.Furthermore,the variable λsstarts to accumulate only when λh≥1.Note that in the λt,the denominator ignores the effect of strain rate compared to the λhand λs,which satisfies with the experimental finding [38] that the dynamic fracture strain is a constant. The parameter β is introduced to distinguish the tension and compression accumulations of λ as given in Eq.(13),which is similar to the CSC concrete model[37].In the tensile(σ1>σ2>σ3≥0)and compressive (0≥σ1>σ2>σ3) regions,β equals to 0 and 1,and only the tensile and compressive damages accumulated,respectively.Besides,it assumes β=mat the pure shear state(P=0).β is then obtained by linear transition between the tensile(β=0),pure shear (β=m) and compressive (β=1) states.Thus,a continued transition is introduced between the independently described tensile and compressive damage.Furthermore,the parametermis set as 0.5,which assumes the tensile and compressive mechanic properties contribute equally at the pure shear stress state. Eq.(14) is the strain hardening and softening shape functions.The UUC stress strain expression suggested by Sargin [39] is adopted to derive ηs,seeing Eq.(14b).Note that ηsis set not less thanft/fcto avoid that the linear interpolation failure surface as given in Eq.(9)decreases with the increase of pressure.To describe the tensile strain softening,the exponential softening function Eq.(14c) proposed by Hordijk [40] is adopted,where the parametersc1=3 andc2=6.93.Besides,the deviatoric damage is defined asDt=1-ηtandDc=1-ηs,and are presented in Fig.6. Fig.6.Strength shape functions and corresponding damage: (a) Compression;(b) Tension. Fig.7.Comparisons of test and predicted residual strength ratio: (a) UUC;(b) UUT. 2.3.2.Hydrostatic damage Attributed to the closure and collapse of micro pores,concrete exhibits inelastic behavior under high confinement pressure,e.g.,projectile penetrations.To capture the relation between the volumetric strain (μ) and pressure (Prf),the proposed model adopts a piecewise linear curve identical with the EOS_8 adopted in KCC model,as sketched in Fig.8 and formulated in Eq.(16).In this EOS,the plastic compaction path is defined by the tabulated input volumetric strain μnand hydrostatic pressure Pnpoints,and the corresponding elastic unloading/loading path is determined by the tabulated input bulk modulus Ku,n.In addition,instead of calling EOS_8 in LS-DYNA,Eq.(16) is written inside the user defined material model to realize the hydrostatic compact response,the details of which can be found in Ref.[41]. Fig.8.Sketch map of EOS. The radial return algorithm [42] is implemented to update the stress tensor during calculation.To describe the shear dilation behavior,the hyperbolic initial failure surface Eq.(8a)is adopted as the plastic potential function,as given in Eq.(17). where Δu is the consistency parameter.The increment of plastic strain tensor is deduced from Eq.(17)and Eq.(18)and expressed as Eq.(20a) is the effective plastic strain increment.Combining with the expression of cosθ in Eq.(1b),the increment of the maximum principal plastic strain Δε1caused by stress deviators is deduced as Eq.(20b). where Δu can be found according to the Kuhn-Tucker condition[42] as The present model contains four series of parameters,including the basic material property parameters,strength surface parameters,EOS parameters and damage parameters.The five basic material parameters that can be determined directly from primary test data or empirical formulas[21],i.e.,density ρ,compressive strength fc,tensile strength ft,shear module G=E/2(1+ν),and bulk module K=E/3(1-2ν).E and ν are the elastic modulus and Poisson’s ratio of concrete.The strength surface and EOS parameters can be determined by triaxial compression test and hydrostatic compression test,which are calibrated from the triaxial test on 46.25 MPa concrete by Williams et al.[34]at present.Besides,considering that the hydrostatic pressure in Ref.[34] is located within nearly 500 MPa,the flyer impact test on 35 MPa concrete from Ref.[43] is further adopted to calibrate the EOS parameters (μn,Pn) in the highpressure range.Note that the suggested EOS parameters (μn,Ku,n)in the KCC model are adopted.Fig.9 presents the comparisons of the calibrated strength surface and EOS with the tests data.Table 1 lists the parameters of the present model.The compressive damage parameters includingand A are determined by fitting the stress-strain relationship obtained from triaxial compression test.The tensile fracture strain εfracis set as 0.01 by referring to Kong et al.[28],while the element size should be less than the width of the fracture process zone during simulation,which is recommended as 25.4 mm in the KCC model [21]. Fig.9.Comparisons of the tests data and the calibrated: (a) Strength surface;(b) EOS in low-pressure range;(c) EOS in high-pressure range. In this section,the proposed concrete model is written as a subroutine UMAT(user defined material model)and embedded in the LS-DYNA.By numerically conducting the compression and tension tests on a single cube element with the edge length of 10 mm as illustrated in Fig.10(a),the validity of the proposed model and corresponding parameters is verified. Fig.10.Compression test on single element: (a) Sketch map;(b) Loading steps. 3.2.1.Compression The compression test conducted by Williams et al.[34] is adopted,and the basic material properties arefc=46.25 MPa,ft=4.0 MPa,E=19.7 GPa and ν=0.17.The compression test is performed on the stress sate of σ1=σ2>σ3,and the load step of test is presented in Fig.10(b).Firstly,the hydrostatic pressure is applied linearly from time 0 until reaching the confinement pressure Pconat the time t1.During the time stage t1to t2,Pconkeeps unchanged and the axial displacement begins to apply linearly until the finish time t2. Fig.11 shows the comparisons between the predicted deviatoric stress and axial/volumetric strain relations and the corresponding test data [34] with the confinement pressure ranging from 0 to 400 MPa.Predictions of the KCC model are also presented,and the basic material parameters obtained from test and other autogenerated material parameters are adopted for KCC model.Note that the volumetric and axial strain,e.g.,ε(a)and ε(v)in this figure,generated in the first loading stage(0≤t ≤t1)are not counted,and Test 1 and Test 2 in Fig.11 refer to the repeated test results under identical loading condition in Ref.[34].In the UUC test (Pcon=0),the strain softening behavior predicted by the empirical formula[44] is presented since lacking the test data.As for the present model,it can be observed that the predicted peak strength,residual strength,shear dilation behavior predicted are close to the experimental observations.However,the predicted strain hardening has certain deviations with the test data,especially within the medium confinement pressure range of 10-100 MPa.Note that the plastic effective strain in the strain hardening stage described by Eq.(12)increases with pressure,while the test exhibits a decaying trend when Pcon>100 MPa.Thus,a compromise is made to balance the overall performance in both low and high pressure ranges,and the parameter d2is determined as d2=1 as a result.Comparably,the KCC model overestimates both the peak strength when the Pcon>20 MPa and the strain softening trend in the UUC test. Fig.11.Comparisons between the test and predicted deviatoric stress and axial/volumetric strain relations by the present model and KCC model under different confinement pressures. Under high confinement pressures,the evolutions of damage variables under triaxial compression test of the present model are shown in Fig.12.In the first loading stage,a hydrostatic pressure is applied,thus only the volumetric damageDvtandDvcare generated.In the second loading stage,the increasing trend of volumetric damage reduces sharply attributed to the appearance of deviatoric stress.Furthermore,the compression damage variables,including ηhand Dc,accumulate continuously with the increase of plastic strain in the second loading stage.It should be noted that the hydrostatic damage is neglected in most of the existing models[16,21,37].Although the hydrostatic damage is considered in Ref.[36],the difference between Dvtand Dvcwas ignored,while it is well described by the present model. Fig.12.Predicted damage variables of triaxial compression test (Pcon=400 MPa) by the present model. 3.2.2.Tension Fig.13 presents the dynamic and multi-axial deviatoric stressaxial strain relations predicted by the present model and the KCC model,where the material parameters used in the compression single element test are directly adopted.According to the test of Weerheijm and Van Doormaal [38],the dynamic fracture strain nearly keeps constant at 0.01 at high strain rates,meanwhile the dynamic tensile strength increases with increasing the strain rate.It can be observed from Fig.13(a)that the predicted dynamic tensile stress-strain relations of the present model satisfy with the above experimental findings [38],while the KCC model predicts the dynamic fracture strain increases with strain rate and overvalues the fracture energy under high strain rate.Besides,the present model assumes that the fracture strain ε1under biaxial tension test is the same as that in UUT test.This characteristic is affected by the usage of different components of plastic strain tensor,such as the effective plastic strain increment Δεpin the KCC model and the maximum plastic principal strain Δε1in the present model.If Δεpis used,the fracture strain under uniaxial and biaxial tension tests are not equal to each other,and also different from the input parameter εfracattributed to the difference between Eq.(18a)and Eq.(18b).As shown in Fig.13(b),the usage of Δε1in the present model ensures that the fracture strain equals the input value of εfrac,which is convenient in usage and the predictions are identical to the findings from Xu and Wen [23].However,the multi-axial tensile stress strain relations predicted by KCC model differ with each other,and a complete brittle fracture response under triaxial tension test is also observed for the KCC model. Fig.13.Deviatoric stress-axial strain relations from single element test of the present model: (a) Dynamic UUT test;(b) Multi-axial tension test,and the KCC model;(c) Dynamic UUT test;(d) Multi-axial tension test. To further verify the capacity of the proposed model in reproducing the impact resistance and cracking failures of concrete panel subjected to projectile impact,the perforation test [14] we have conducted on finite-depth concrete panels (thickness of 100-300 mm) is numerically simulated.To bring convenience in expressing the test and simulation results,the following shorthand notations are used: striking velocity Vs,residual velocity Vr,panel thickness H,spalling diameter dsp,spalling depth hsp,scabbing diameter dsc,and scabbing depth hsc. In this test,an ogival-nosed projectile was used,which was made of 45CrNiMoV steel,and has a hardness of HRC45 and a yield strength of 1420 MPa.The projectile has a diameter of 25.3 mm,a length of 152 mm,an average mass of 428 g,and the caliber-radiushead(CRH)equals to 3.Since the recovered projectile shows slight deformation and negligible mass loss,it is considered as a rigid body and described by the MAT_RIGID model,the corresponding elastic modulus and Poisson’s ratio are 210 GPa and 0.3,respectively.The concrete panel is reinforced with a 6-mm-diameter steel rebar mesh,which is modeled by the Plastic Kinematic material model,and the yield strength,elastic modulus,and Poisson’s ratio are 400 MPa,210 GPa,and 0.3,respectively.The concrete panel has a plane dimension of 675×675 mm2and a compressive strength of 41 MPa.The related basic material properties of concrete are: ρ=2300 kg/m3,ft=3.6 MPa,G=12.8 GPa,and K=17.1 GPa.Besides,the other material parameters listed in Table 1 are used. The projectile and concrete are modeled by the 3D Solid 164 element.The ERODING_SURFACE_TO _SURFACE contact algorithm is adopted between the concrete target and projectile.The steel rebar is modeled by beam element with element size of 6 mm,and is coupled with the concrete panel through the keyword CONSTRAINED_LAGRANGE_IN_SOLID.To enhance the compute efficiency,a 1/4 finite element model is utilized considering the symmetry of the scenario.Fig.14 presents a typical finite element model of the perforation test on the 300-mm-thick panel. Fig.14.Finite element model of projectile perforation test on 300-mm-thick panel. Since the present model is a localized constitutive model,the element size of concrete panel affects both the penetration depth and crater diameter of concrete penal.The previous study of Wu et al.[41] shows that a 3 mm mesh size results in a stable simulation result for the ultrahigh toughness cementitious composites target strike by a 14.5 mm diameter projectile.Besides,both 2 mm and 3 mm element sizes were employed by Kong et al.[19,20] to simulate this perforation test.The mesh size sensitivity analysis is also conducted at present,in which the edge lengths of concrete elements are respectively selected as 1/12,1/10,1/8,and 1/6 of the projectile diameter,i.e.,2.1 mm,2.5 mm,3.2 mm,and 4.2 mm.The corresponding predicted (using erosion criterion value 0.28) residual velocities of projectile are presented in Fig.15(a),which indicates that a good convergence is achieved when the element size is less than 3.2 mm.To balance the computation efficiency,the element size of 2.5 mm is adopted in the central part of the concrete panel with a dimension of 300×300 mm2.Besides,for the rest part of concrete panel,the element has a max edge length of 5 mm. Fig.15.Influences of (a) concrete element size (H=300 mm, Vs=601 m/s) (b) erosion criterion value (H=300 mm). The erosion algorithm is necessary for the simulation of projectile penetrations using finite element model,due to the overdistorted target element near the projectile nose would disrupt the computation.LS-DYNA program provides the keyword MAT_-ADD_EROSION to define the material failure,which includes abundant selections,e.g.,the pressure,principal stress and principal strain.Some other constitutive models also define material failure according to the material damage [16,28] or the accumulated plastic strain[24,27].It is believed that the reasonable impact resistance and failure mode can be obtained if a proper erosion criterion is selected.At present,the maximum principal strain erosion criterion is adopted considering its stable performance[41].Two impact scenarios with the striking velocities of 737 m/s(perforation case) and 540 m/s (penetration case) are simulated,and the derived residual velocities and penetration depths of projectile corresponding to the maximum principal strain erosion criterion of 0.27-0.29 are shown in Fig.15(b).It can be derived that the impact resistance increases with increasing the maximum principal strain.To further balance the prediction accuracy of the present test,the erosion criterion 0.28 is adopted. Considering the framework of the present model is mainly taken from the KCC model,the predictions of the present model are compared with that of the KCC model in this section.The KCC model uses the auto-generated parameters and the identical element size with the present model.As for the erosion criterion,the maximum principal strain is determined as 0.15 through conducting sensitive analyses and comparisons with the test data.To show the cracking of concrete panel in the LS-PrePost software,the element is marked by a history variable HSV in the user defined material model,which is set as HSV=1 whenDt=1,otherwise HSV=0.Note that the HSV can be used to record the user assigned parameter in the subroutine UMAT and a total of 50 HSVs can be defined.Fig.16 presents the typical fracture failure patterns of concrete panel predicted by the present model,where the isosurface in the LS-PrePost is selected to show the fracture failure inside the panel.Note that those blank areas represent there no fracture failure,and only the fractured elements (Dt=1) are marked by the HSV variable.For the KCC model,it is assumed that the cracking appears when tensile strength reduces to 0.By conducting a single element test,it is observed that the corresponding scaled damage δ=2λ/(λm+λ)is 1.95.Therefore,the cracking of the KCC model is shown by setting the range of δ as 1.95-2.0. As for the total 5 shots on relatively thick concrete panel(H=300 mm),Fig.17 presents the predicted results by the present model and KCC model as well as the experimental observations[14],including the cracking damage contour,projectile residual velocity,normalized (simulation/test) spalling and scabbing diameters,as well as the projectile decelerations.It can be found from both the test photograph and simulated cracking damage contour that the 300-mm-thick concrete panel exhibits three typical damage modes,e.g.,the front spalling,penetration tunnel,and rear scabbing,with the perforation of the projectile.Besides,the present model predicts the spalling and scabbing dimensions of the panels with satisfying agreement with experimental observations.However,the KCC model tends to underestimate the tensile damage since it overestimates the dynamic fracture energy at high strain rate.Compared to the test data,the average deviations of the predicted spalling and scabbing diameters are 18% and 14% for the present model,while the corresponding deviations for KCC model are 41% and 55%,respectively.Besides,the predicted residual velocities are close to experimental observations for both two models,and the predicted projectile decelerations by the present model and KCC model are almost overlapped for the three shots.The reason lies in that the erosion criteria of both the present and the KCC models,i.e.,0.28 and 0.15,are carefully pre-determined by the test data. Fig.17.Comparisons between the test data and predicted results: (a) Cracking damage contour;(b) Residual velocity;(c) Normalized spalling diameter;(d) Normalized scabbing diameter;(e) Deceleration-time histories. As for the total 20 shots on relatively thin concrete panel(H=100 mm),the corresponding comparisons of the typical cracking damage contour and the residual velocities are shown in Fig.18.It can be found from Fig.18(a) that two typical damage modes,e.g.,the front spalling and rear scabbing,are reproduced by the present model for the relatively thin panel,which are in good agreement with experimental observations.However,the KCC model underestimates the spalling and scabbing crater dimensions severely,and is failed to reproduce the damage modes correctly.Besides,seven shots on the 100 mm-thick panel at impact velocities of 250-729 m/s are simulated by both the present model and KCC model,see Fig.18(b),which indicates that the projectile residual velocities predicted by the present model and KCC model are almost the same and agree well with test results.Moreover,in Fig.18(c)and Fig.18(d),by comparing with a total of 10 shots at Vsof nearly 300 m/s,475 m/s,540 m/s,640 m/s,and 730 m/s (two shots are compared at each Vslevel considering the fluctuations of test data),the average deviations between the test and simulated spalling and cratering diameter are 14% and 8% for the present model,58% and 40% for KCC model,respectively. The comparisons between the test and predicted damage distributions of concrete panels during the strain hardening and softening stages are presented in Fig.19,where the concrete panel thickness and striking velocity areH=200 mm andVs=641 m/s.The experimental residual velocity is 438 m/s,and the predictions of the present model and KCC model are 429 m/s and 428 m/s,respectively.For the present model,the damage variables 0≤ηh≤1 and 0≤D ≤1 correspond to the strain hardening and softening stages.For the KCC model,the scaled damage factor in the range of 0≤δ ≤1 and 1≤δ<2 correspond to the strain hardening and softening stages,respectively.For the strain hardening stage shown in Fig.19(a),the damage distribution area of KCC model is obviously larger than that of the present model,especially in the region far away from the penetration tunnel.It is because the present model considers strain hardening only in the compressive region,while the KCC model accumulates strain hardening damage in both the tensile and compressive regions.Since the strain hardening is negligible in the tensile region,a little plastic strain will cause δ to reach 1.Besides,it can be observed from Fig.19(b) that both the present and KCC models predicted strain softening damage are concentrated in the penetration tunnel,and widely spread on the concrete panel with a similar pattern.However,KCC model underestimates the softening damage near the concrete panel surfaces. Fig.19.Damage distributions of concrete panel during (a) strain hardening and (b) strain softening stages. Compared with the concrete models embedded in commercial program,the detailed damage variables distribution can be tracked and output according to the HSVs defined in the UMAT,which helps us deeply reveal the underline mechanism.For the identical concrete panel shown in Fig.19 and Fig.20 furthermore shows the damage distributions predicted by the present model.It can be observed that the damageDvcandDvtcaused by hydrostatic compression are mainly located near the penetration tunnel.Therefore,the spalling in the front surface and scabbing in the rear surface are caused by the deviatoric damage,among whichDtis dominative.Besides,Dcplays an important role in the formation of spalling,while it is subordinate to scabbing. Fig.20.Damage distributions of concrete panel during perforations: (a) Dt;(b) Dc;(c) Dvt;(d) Dvc. Generally,by comparisons with the projectile perforation test data on both the thick and thin concrete panels as well as the predictions of KCC model,the impact resistance and fracture failure modes of concrete panels are well reproduced,thus the established concrete model and the finite element analyses approach are validated. Whether the concrete panel can withstand the high velocity projectile impact and what the corresponding DOP and fracture failure pattern appear are the main concerns in the design of protective structures.In this section,the identical 25.3 mm-caliber projectile perforating on concrete panels with the thickness of 100 mm,150 mm,200 mm,and 300 mm are simulated with the validated concrete model and finite element analyses approach.Three critical limits,i.e.,the cracking,scabbing and perforation limits,as well as the projectile decelerations are discussed. For a given striking velocity,the minimum thicknesses of concrete panel required to prevent the scabbing and perforation failures appear near the rear surface refer to the scabbing limit thicknesshscaband perforation limit thicknesshper,respectively[45].However,to numerically determine thehscabandhper,it has to change the panel thickness for a given projectile striking velocityVs,and amounts of finite element models need to be established and analyzed.Comparably,it is more convenient to change the projectile striking velocity and keep the target thickness constant.Therefore,the following definitions are introduced to express the corresponding simulation results for a given target thickness: (i)Cracking limit velocityVcrackrepresents the minimumVsrequired to cause the formation of cracking in the rear surface;(ii)Scabbing limit velocityVscabrefers to the minimumVsrequired to cause the formation of scabbing near the rear surface;(iii) Perforation limit velocityVperis the minimumVsrequired to cause the perforation damage.Furthermore,the penetration depths at the striking velocity ofVcrack,Vscab,andVperare DOPcrack,DOPscab,and DOPper,respectively. Fig.21 presents the damage patterns of the 200-mm-thick concrete panel under varied projectile impact velocities.As can be seen,the damage degree near the rear surface becomes more serious with increasing the impact velocitiesVs,i.e.,from cracking,scabbing and perforation,and the correspondingVcrack,Vscab,andVperare 300 m/s,362 m/s and 375 m/s,respectively.Besides,at the impact velocity of 250 m/s,the spalling depth is identical to the DOP since the penetration tunnel is not obvious. Fig.21.Cracking of concrete panel under different impact velocities. Additionally,for the perforation limit scenario (H=200 mm,Vs=375 m/s),Fig.22 presents the simulated deceleration-time histories and the cracking contour of concrete panel at four critical time instants,respectively.It can be derived that,the 1st critical point appears when the projectile displacement reaches 50 mm,i.e.,nearly the length of projectile nose,before which the deceleration increases almost linearly and after which the penetration tunnel emerges;The 2nd,3rd and 4th critical points correspond to the initial of cracking,scabbing and perforation near the rear surface.By comparing with the corresponding simulation results at 1.6 ms presented in Fig.21,it shows the simulation results,e.g.,DOP,deceleration,and fracture failure,are stabilized after 1 ms. Fig.22.Simulation results of deceleration-time curve and cracking contour of concrete panel (H=200 mm, Vs=375 m/s). Furthermore,theVcrack,Vscab,Vperand the corresponding DOPcrack,DOPscab,DOPperof the 100 mm,150 mm,200 mm,and 300 mm thickness concrete panels are obtained,as shown in Fig.23.Generally,it seems that the scabbing dimension increases with the concrete panel thickness,and the spalling dimension increases with the impact velocity.Besides,when the impact velocity is less than 250 m/s,the spalling crater depth and DOP are almost the same,which is identical to the finding in Fig.21. Fig.23.Cracking contour of concrete panel at critical limit states: (a) 100 mm;(b) 150 mm;(c) 200 mm;(d) 300 mm. At the impact velocities ofVscabandVper,the panel thicknessHis the correspondinghscabandhper,respectively.Therefore,the relations ofhscab-Vsandhper-Vscan be obtained from Fig.23.By further conducting numerical simulations on the 300-mm-thick panel,the relation of DOP-Vsat the impact velocity of 100-500 m/s is determined.Based on these simulation results,some empirical formulas summarized in Ref.[45] can be evaluated,including the modified Petry I,Ballistic Research Laboratory(BRL),Army corps of engineers (ACE),modified National Defense Research Committee(NDRC),and Hughes formulas.Fig.24 shows the comparisons of DOP,hper,and hscabpredicted by the present model and empirical formulas.It can be found that the Modified Petry I,BRL,and Hughes formulae overestimate the hscabsignificantly when hperlarger than 200 mm,while the correspond deviations reduce as hperdecreases.This may be attributed to that the ratios of hscab/DOP and hper/DOP in these three formulae are summarized based on the relatively thinner concrete panels,thus are not applied to the thicker concrete panels.Comparably,the ACE and modified NDRC formulae predicted hscabagree well with the simulation results,despite that the DOP is slightly underestimated by these two formulas.In the design of protective concrete structure against the projectile impact,the scabbing of concrete target is strictly prohibited,thus the ACE and modified NDRC formulae are recommended. Fig.24.Comparisons of the DOP, hper,and hscab predicted by the present model and empirical formulas. In this study,the scabbing/perforation limits of finite-depth concrete panel under high velocity projectile impact is numerically studied based on an improved dynamic constitutive model.By verifying the proposed model with both the single element and projectile perforation tests,the perforation resistance,fracture failures,and scabbing/perforation limits of concrete panels are comprehensively assessed.The main work and conclusions are summarized as follows: (1) By proposing a new hyperbolic 3D failure criterion,an improved dynamic constitutive model is proposed based on the framework of KCC model.It takes both hydrostatic and deviatoric damage into consideration and treats the independently described dynamic tensile and compressive properties with a continued transition. (2) The parameters of the present model are comprehensively calibrated according to triaxial test data and validated by the single element tests under tensile and compressive loadings.The triaxial compression and dynamic tension properties of the present model satisfies with experimental findings and are superior to the KCC model.Besides,the difference of hydrostatic damage on the UUT and UUC strength is also well described by the present model. (3) Compared with projectile perforation test,the present model is further validated by predicting the fracture failures,projectile residual velocities and deceleration histories,while the KCC model underestimates the cratering dimensions severely.It derives from the distribution of damage variables that the front spalling crater is dominated by both the tensile and compressive damage,while the rear scabbing crater is dominated by only tensile damage. (4) Based on the fully validated concrete model and the finite element analyses approach,the cracking contours of finitedepth concrete panel with increasing projectile impact velocities are derived,and the corresponding cracking,scabbing and perforation limits are determined.By evaluating the validations of the existing five empirical formulae,both the ACE and modified NDRC formulae are recommended in the design of the protective concrete structure to avoid scabbing failure. Author statement Fei Zhou: draft writing,build constitutive model,numerical simulation work,funding;Hao Wu:propose the idea and revise the manuscript,funding;Yuehua Cheng: numerical simulation work. Declaration of competing interest The authors declare that they have no known competing financial interests or personal relationships that could have appeared to influence the work reported in this paper. Acknowledgements This study was supported by the National Natural Science Foundation of China (Grant No.52208500). Appendix The KCC model implements three independent strength surfaces on the compressive meridian plane,e.g.,the maximum failure surfaceYm,initial failure surfaceYi,and residual failure surfaceYr,as presented in Eq.(A1)-Eq.(A3),where the parameters ai,aiy,and aif(i=1,2,3)can be determined by the triaxial compressive test.The initial yield compressive strength is defined as fyc=0.45fc. where ψ denotes the ratio of tensile meridian to compressive meridian,and is determined by conducting linear interpolation between the following five critical points: Eq.(A5) presents the current failure strength surface,it is obtained by conducting linear interpolation between theYmandYiin the strain hardening stage,andYmandYrin the strain softening stage,respectively.r’ is the ratio of current meridian to the compressive meridian,which can be calculated by an elliptic function.η is the yield scale factor that is related the accumulated equivalent plastic strain λ,which is defined in Eq.(A6). where Δεpis the effective plastic strain increment,and b1,b2are damage constants that can be used for adjusting the compressive and tensile damage,respectively.The yield scale factor η increases from 0 to 1 with the λ increases from 0 to λm,which corresponds to the strain hardening stage.With λ further increases over λm,the η will decreases from 1 and finally to 0,corresponding to the strain softening stage. To account for the strain rate effect,a radial enhance approach is used in the KCC model,both the current strength surface and equivalent plastic strain λ are adjusted as follows,where the subscript rf represents the strength surface and pressure content the strain rate effect. To describe the inelastic volumetric compaction behavior of concrete,the KCC model uses a Tabulated compaction EOS (EOS_8 in the LS-DYNA),and the current pressure is determined by the volumetric strain μ,as shown in Eq.(A9),where theE0is the material internal energy per initial volume,γ meanings the specific heat ratio,andC(μ),T(μ)are functions of the μ that are the tabulated pressure and temperature,respectively.During loading the pressure and volumetric strain obeys the defined tabulated function when plastic volumetric strain generates.Besides,the unloading path and reloading path is determined by the unloading bulk modulus.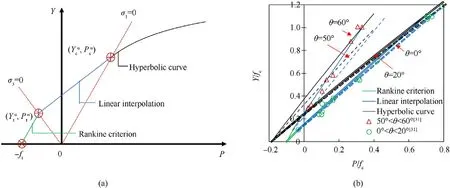
2.3.Damage accumulation
2.4.Equation of state
2.5.Plastic flow rule
3.Calibration of material parameters and model validation
3.1.Parameters calibration

3.2.Single element test
4.Numerical simulations of projectile perforation into concrete panel
4.1.Finite element model
4.2.Element size and erosion criterion
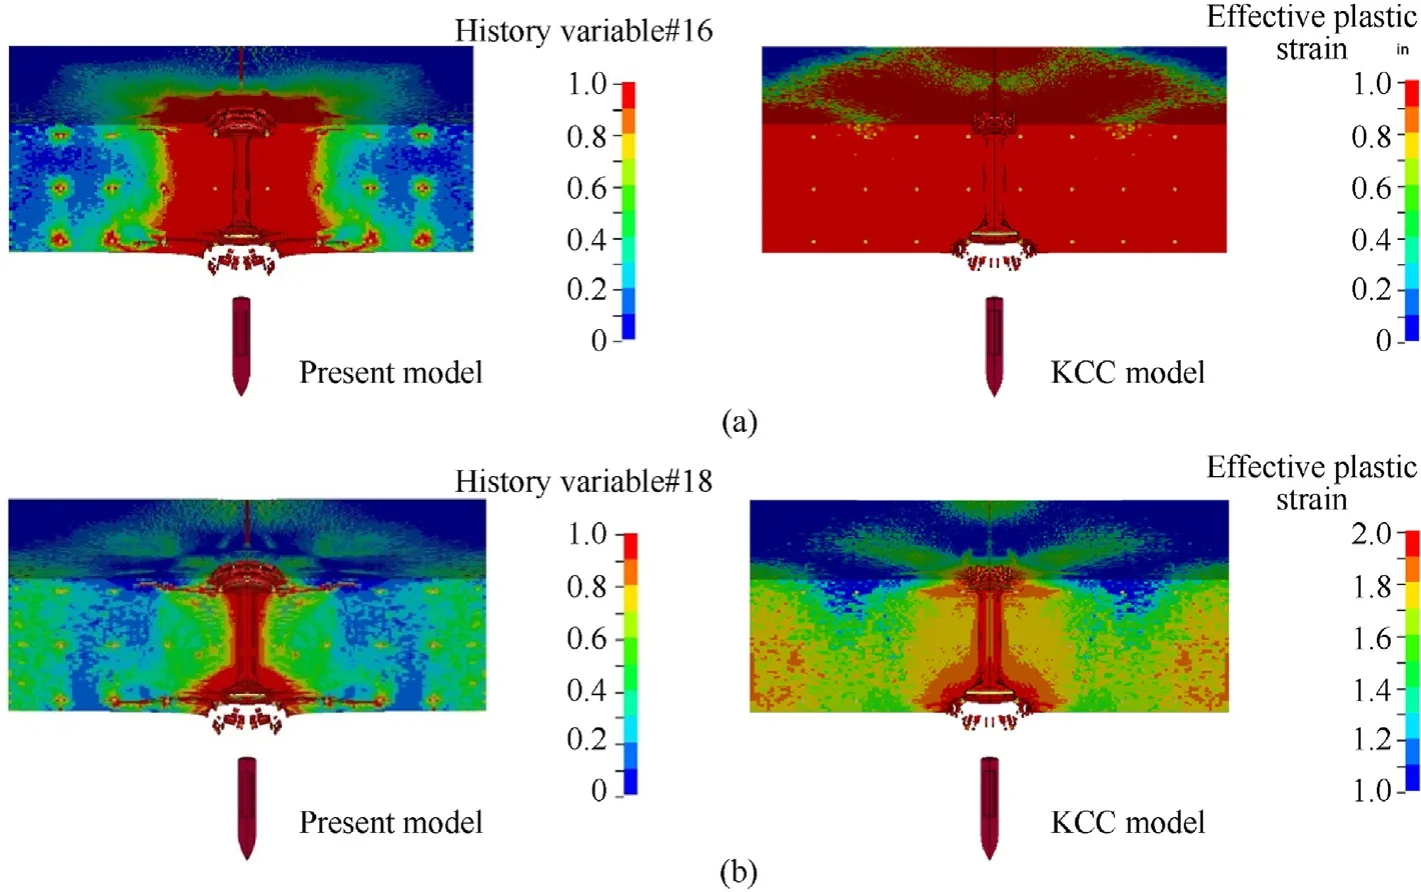
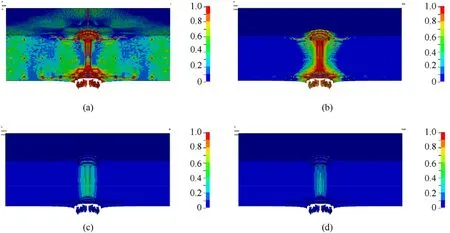
4.3.Comparisons
5.Further discussions

6.Conclusions
杂志排行
Defence Technology的其它文章
- An energetic nano-fiber composite based on polystyrene and 1,3,5-trinitro-1,3,5-triazinane fabricated via electrospinning technique
- Dynamic response of UHMWPE plates under combined shock and fragment loading
- Aerial multi-spectral AI-based detection system for unexploded ordnance
- Model-based deep learning for fiber bundle infrared image restoration
- Robust design and analysis for opto-mechanical two array laser warning system
- Combustion behavior and mechanism of molecular perovskite energetic material DAP-4-based composites with metal fuel Al
