Hail impact responses and residual tensile properties of CFRP T-joints
2023-09-05JinwuZHOUZhiinZHAOYoyoSHIXuWANGXiopengCHENChenweiSHAN
Jinwu ZHOU,Zhiin ZHAO,Yoyo SHI,*,Xu WANG,Xiopeng CHEN,Chenwei SHAN
a School of Mechanical Engineering, Northwestern Polytechnical University, Xi’an 710072, China
b School of Missile Engineering, Rocket Force University of Engineering, Xi’an 710038, China
c Northwest Institution of Nuclear Technology, Xi’an 710024, China
d School of Civil Aviation, Northwestern Polytechnical University, Xi’an 710072, China
KEYWORDS Acoustic emission;CFRP T-joint;Deltoid;Hail impact;Z-pin
Abstract Hail impact is a major challenge encountered by aircraft in flight,and thus is a key concern in the design of damage-tolerant composite T-joints in aviation.The study uses the Z-pinning technique (the pre-hole insertion technology) in combination with fillets of two radiuses to manufacture four types of Carbon Fiber Reinforced Polymers (CFRP) T-joints.The T-joints are then subjected to hail impact tests at two energy levels, as well as post-impact quasi-static tensile tests.The results show that increasing the size of the deltoid and Z-pin-induced reinforcement has a limited influence on the responses of the T-joints to hail impact, but a significant influence on their residual tensile strength after impact.These influences are not only dependent on the structural characteristics of the T-joints, but are also closely related to the degree of discrete damage within the T-joints caused by hail impact.Acoustic Emission(AE)technology is used to monitor the quantitative evolution of damage to the T-joints in a timely manner during the loading process,and helps characterize the characteristics of evolution of various types of damage over different periods.The research here can help design lightweight and damage-tolerant T-joints.
1.Introduction
The composite T-joint is an important structure for load transfer that is widely used in the fuselage, wing, and hatch covers of aircraft.1Previous studies2,3have shown that composite materials are prone to damage owing to low-velocity impact that affects their structural properties.But low-velocity impact usually occurs when the aircraft is on the ground,and thus can be successfully repaired.Nonetheless, it may suffer from hail impact during flight,4–6in which case the damage tolerance of its T-joints largely determines the fate of the aircraft.It is thus important to investigate the responses of composite Tjoints to hail impact as well as their residual properties.
Hail is an extreme weather phenomenon that can be very destructive.The risk of severe damage caused by the hail impact on airplanes has long been recognized,5but has assumed greater importance within the last 20 years owing to the significant use of composite materials, such as CFRP, in primary structural components of aircraft that are exposed to the elements.7Kim et al.8projected artificial hailstones onto the composite panels of an aircraft to determine the damage resistance of thin-walled composite structures and observe the resulting modes of damage over a wide range of velocities.Their experimental results showed a linear relationship between the thickness of the panel and the failure threshold energy that can be accurately determined by using a simple trigonometric scaling relationship.A corresponding numerical simulation9was also carried out, and the correlation between its results and the experimental data showed that it can adequately model the impact-induced behavior of ice and the elastic response of a thin composite panel.Similar research(experiments and simulations)10,11has been used to study the high-velocity hail impact on single-lap adhesive composite joints and composite tape laminates,and the conclusions have been refined by using advanced equipment.Many researchers have also examined the hail impact on various composite structures, including laminates,12sandwich panel,13stringer-stiffened curved panel,14and shell structure,15to obtain useful results.However, little research has been reported on the hail impact on more complicated composite structures, such as T-joints.
A typical T-joint consists of the skin,L-pieces,and deltoid,as shown in Fig.1.The poor performance of the bonding interface and the deltoid of T-joints compared with the other parts remains a problem.16–18A number of technologies have been developed to overcome such weaknesses, including (I) tufting,19(II) skeleton insertion,20(III) fastener installation,21(IV)stitching,22,23(V) bionic design,24,25and (VI) 3D weaving.26,27Nevertheless, these technologies are normally too expensive or complicated to apply on a large scale.28The Z-pin is widely used due to its advantages of easy operation and low cost.29–31Despite this,the overall performance of the structure does not increase with the increase in the area of the region enhanced by Z-pins.32While considerable research has been devoted to preventing the deltoid from failing too quickly during loading,33,34not enough attention has been paid to the influence of its size on the overall performance of the structure.The traditional method of Z-pin insertion uses an ultrasonic insertion gun to knock the Z-pins into specimens.Owing to interlaced fibers inside the specimen and the limited strength of the Z-pins,part of them are offset and split during insertion.Heat generated by ultrasonic vibrations of the Z-pin can improve the degree of curing of the resin close to it,which ultimately affects its reinforcement effect and consistency.35,36Z-pin pre-hole insertion technology was subsequently developed,37,38and is used here.

Fig.1 Schematic of T-joint structure.
The development of structural health monitoring technologies has greatly enriched the means of assessing the integrity of structures, and is important for research on the evolution of damage in composite materials.Farge et al.39carried out Electronic Speckle Pattern Interferometry (ESPI) to measure the full-field displacement along the edge of a cracked cross-ply graphite/epoxy laminate subjected to a tensile load and achieved satisfactory results.Ambu et al.40combined the holographic processing method with ESPI to significantly improve the signal-to-noise ratio of speckle measurements on composite laminates after low-velocity impact.Baek et al.41introduced the electrical resistance method to study the kissing bond defects in composite adhesive joints by measuring their electrical characteristics after the dispersion of Carbon Nanotubes (CNTs) in them, and used this to assess the shear strength of the lap.Moreover, the embedded MWCNT@WGF,42Lamb wave-based non-destructive detection of damage, fiber Bragg grating method,43and the GNAISPIN44have been used to monitor variations in the state of composite T-joints.However, almost all the above methods require complex preparation before experimentation,and are almost impossible to apply to aircraft in service.Acoustic Emission (AE) is a naturally occurring phenomenon that is the result of the propagation of transient elastic waves caused by a sudden release of energy due to damage inside the material.45,46It has been shown that tracking the AE events during the entire loading process can help evaluate the state of damage to the material,and is easy to use in experiments.47However, to the best of the authors’knowledge,little research to date has addressed the AE analysis of composite T-joints in the quasi-static tensile process.
This study provides a comparative examination of the damage tolerance of unpinned and Z-pinned Carbon Fiber-Reinforced Polymers (CFRP) T-joints with fillets of different radiuses by using the hail impact test and the quasi-static tensile test.The Z-pinned T-joints were reinforced only in the Bonding Region Between the Skin and the Flanges(BRBSFs).Moreover, a method of pre-hole insertion of Z-pins was used to improve the consistency of the specimens.The responses to hail impact and characteristics of damage of the T-joints were studied by using a high-speed camera, ultrasonic Cscan, Digital Image Correlation (DIC) technology, and AE technology.
2.Experimental procedure
2.1.Materials used and specimens manufacture

Fig.2 Four types of T-joint specimens.
Two types of T-joint specimens with fillets of different radiuses were manufactured, and each contained both unpinned and Z-pinned T-joint specimens (see Fig.2).The IM7/M91 (carbon/epoxy) unidirectional prepreg with a nominally cured ply thickness of 0.175 mm was used to manufacture the L-pieces and skin with corresponding stacking sequences of[45/0/-45/90]Sand [45/0/-45/90]3S, respectively.To prevent the formation of a weak resin-rich zone, the same material was used to fill the deltoid along an angle of 90°.Z-pins with a diameter of 0.3 mm were prepared from the S35/YH69 (PL/epoxy) prepreg fiber bundle by the pultrusion process.The Z-pins then were inserted in the BRBSFs at an interval of 4×4 mm.A total of 13×3 Z-pins were inserted on each side of the BRBSF of the T-joints.The Z-pins were in a state of about 80% curing before insertion.The ‘‘R5 specimens”and‘‘R10 specimens”represented T-joint specimens with fillet radiuses of 5 mm and 10 mm,respectively.Steps of the manufacture of the T-joint specimens, with a constant temperature of 25 °C and relative humidity of 40%, are shown in Fig.3.
The integrity of the Z-pins after insertion and error in their angle of insertion significantly influence the consistency of Tjoint specimens.48The study here proposes a method for the insertion of Z-pins by using improved equipment, and the specific steps are shown in Fig.4.
2.2.Preparation of artificial hailstones
Artificial spherical hailstones with a diameter of D = 25 mm were manufactured according to the methods in Ref.49The molds for manufacturing the hailstones are shown in Fig.5.Each contained two aluminum block cylinders with a hemispheric cavity.A hole was cut at the top of each mold to inject water into it and discharge redundant water from it during freezing.Boiled distilled water was used to avoid air bubbles and any impurity.It should be noted that since the hardness of ice was related to the frozen time, the time of all hailstones was controlled between 72 and 78 hours in this experiment.The hailstones were transparent and did not have any cracks.
2.3.Details of fixture and experiments
The T-joint specimen was fixed on a steel fixture, as shown in Fig.6.An air cannon was used to fire the hailstones so that they impacted the center of the skin.The compressed air was released into the barrel to increase the speed of hailstones which were embedded in a sabot.The sabot was made from plastic by using 3D printing.The sabotarrester at the exit of the barrel could catch it to prevent it from impacting the specimen.A laser velocimeter was used between the specimen and the sabot-arrester to measure the velocity of the hailstones before impact.The process of the hailstones striking the T-joint was captured by using a Phantom V711 high-speed camera at a frame rate of 25000 frames per second.Strain gauges were used to synchronously record the strain-related responses, and were fixed on the skin and stiffener of the T-joint, as shown in Fig.2.The rated resistance of the strain gauges was 120.6 Ω with a range of service temperature of -30°C to+80°C and a sensitivity coefficient of 2.22.Three tests were performed for each combination, and the specific arrangements are shown in Table 1.

Fig.3 Operational flowchart of T-joint manufacture.

Fig.4 Schematic of Z-pin pre-hole insertion process.

Fig.5 Artificial hailstone and corresponding mold.
The hail impact test involved a lot of instruments and equipment with complex operation, and had a certain risk,therefore it was necessary to pay special attention to various details in the test.For the hailstone, in order to avoid its fragmentation caused by friction at the moment of ejection,it was necessary to apply Vaseline in the groove of the sabot to ensure sufficient lubrication.For the specimen, we needed to check its installation position,the effectiveness of the strain gauges and their connection of the corresponding circuit.For the instruments and equipment, the distance and trigger effectiveness of laser velocimeter, as well as computer storage should be checked.At the same time, it should be confirmed that the strain data acquisition instruments and the highspeed camera were in the state to be triggered and the barrel was free of foreign matter.For the test site, we needed to ensure that the target area was clear and especially nobody was there before firing.The implementation of the above precautions could guarantee the smooth development of the test.

Fig.6 Entire platform for hail impact test.
Table 1 Hail impact test arrangements of T-joint specimens (±s).

Table 1 Hail impact test arrangements of T-joint specimens (±s).
Test Fillet radius (mm) Air pressure(MPa)Repeated times Impact energy(J)Initial contact velocity (m/s)Unpinned R5-50.5 J 5 0.06 3 50.9 ± 0.8 116.9 ± 1.0 Z-pinned R5-50.5 J 50.6 ± 1.3 116.6 ± 1.5 Unpinned R10-50.5 J 10 50.3 ± 0.7 116.3 ± 0.9 Z-pinned R10-50.5 J 50.2 ± 0.3 116.1 ± 0.3 Unpinned R5-115.4 J 5 0.13 115.9 ± 2.9 176.5 ± 2.2 Z-pinned R5-115.4 J 116.9 ± 1.8 177.3 ± 1.4 Unpinned R10-115.4 J 10 114.7 ± 0.6 175.6 ± 0.5 Z-pinned R10-115.4 J 114.0 ± 1.0 175.1 ± 0.7 Note.The abbreviation ‘‘(images/BZ_444_1174_1740_1194_1789.png±s)”means the average and standard deviation of the values of the three repeated tests for each combination.
The quasi-static tensile tests were conducted on intact specimens and those that had been damaged after hail impact at a tensile rate of 0.5 mm/min according to ASTM D3039.As in the case of hail impact, three tests were performed for each combination.All specimens were tested by a CRIMS DDL100 tensile testing machine.During the entire tensile process,(A)a CCD camera operating at a frame rate of 1 fps was used to record the displacements of speckles on one side of the specimens to analyze their strain-related behavior by using DIC technology, and (B) the DS5-16 AE monitoring system,manufactured by Beijing Soft Island, was used to record the AE events generated by the evolution of damage in the specimens.An AE sensor was fixed at each end of the specimen,Vaseline was used as the coupling agent between them, and its performance was verified by using the pencil-lead break procedure.The gain in the preamplifier was 40 dB, the sampling rate was 3 MHz,and the direct pass mode with a threshold of 10 mV was used.The entire platform is shown in Fig.7.
2.4.Processing and characterization of AE signals
An original signal can be decomposed into an approximate signal and several detailed signals by using multi-scale Discrete Wavelet Transforms (DWTs).The detailed signals are then processed by a specific threshold and denoising is completed by stepwise reconstruction.A kind of wavelet base function,i.e., db10, was used here.It determined the corresponding filtering function, and the original signal was decomposed into three levels.Because the BayesShrink threshold can be adjusted according to the noise,the soft threshold method with the BayesShrink threshold was used.

Fig.7 Entire platform for quasi-static tensile test.
The AE events included the amplitude, energy, rise time,duration, counts, and other parameters.The counts and energy reflected the number of oscillation and strength of the signal, respectively.Several measures, including the dual AE sensors and the short monitoring distance, had been taken to ensure the attenuation of the AE signal within an acceptable range.Therefore, these two parameters of the AE events were analyzed after denoising by k - means clustering to characterize the damage to the specimens.It was defined as50

3.Results and discussion
3.1.Responses to hail impact
Typical frames of the hail impact on the T-joints are shown in Fig.8.The results show that the hailstones had almost the same physical characteristics except for the response rate under different impact energies(velocities).A pair of hailstones were almost transparent before contact with the specimen, indicating that they were intact.However,they lost their transparency for an instant after contact, with cracks all over them indicating that they had broken up.As the hailstones moved forward,they gradually dispersed into tiny fragments that scattered indiscriminately in all directions.
The typical curves of strain-related responses (see Fig.9)show that the strain on the skin and the stiffener did not exhibit prominent periodicity during impact, likely because the hailstones continuously fed stress waves into the specimen during contact.The stress waves propagated very quickly (about 4000 m/s) inside the specimen to induce a much higher strain rate.The curves of the strain-related responses were thus dominated by a large number of coupled stress waves (including tensile and compression waves) that did not exhibit clear periodicity.The strain-related response on the stiffener occurred sooner than that on the skin in the initial period and had a larger amplitude, because the strain gauge-2 (on the skin) was located along the direction of the hail impact and the direct conduction of in-plane stress waves caused deformation to occur earlier than otherwise.However, the strain gauge-1 (on the stiffener) was not located along the direction of the hail impact, and the specimen underwent almost no deformation in the early stage of impact due to the weakly coupled inplane stress waves on the skin and the effect of inertia.With the continuous impact of fragments of hailstones, a sudden increase in the strain finally occurred because the deformation of the specimen was dominated by stretching on the back of the skin in concert with enhanced in-plane stress waves.Furthermore, as the high-velocity hail impact was a kind of soft impact, defined as impact in which the stress generated far exceeds the strength of the projectile but is far below that of the target,5the hailstones appeared to be in an approximate state of flow.The tensile deformation on the back of the skin was thus limited, and led to a small value of strain gauge-1.This is also why the impact energy did not dominate the strain rate of the specimen,except its degree of strain,but the sizes of the deltoid and Z-pin could not dominate the degree of strain of the specimen.
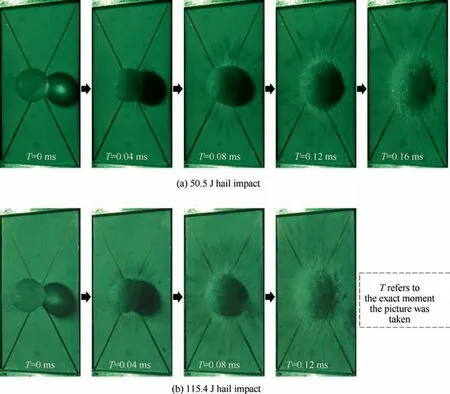
Fig.8 Typical damage process of artificial hailstone at 50.5 J and 115.4 J.

Fig.9 Typical strain–time responses during hail impact.
Ultrasonic C-scan equipment produced by physical acoustics corporation was then used to detect the inter-laminar damage in each specimen after hail impact.Three categories of damage—‘‘intact specimens”(after 0 J hail impact), ‘‘specimens with minor damage”(after 50.5 J hail impact), and‘‘specimens with major damage ”(after 115.4 J hail impact)—were used to classify the specimens as shown in Fig.10.The results show that the regions of damage due to hail impact were discrete in all specimens, and most of the damage was concentrated at the Junction of the Skin and the Deltoid (JSD).In case of 50.5 J hail impact, the damage at the JSD was limited and the rest of the region was nearly intact.In case of 115.4 J hail impact, the damage at JSD was aggravated and overflowed into the other parts of the specimen.Parts of the damage at the JSD even expanded into a whole, and this phenomenon was more prominent in R5 specimens than R10 specimens.Damage was also identified in some regions of Z-pin-induced reinforcement, mainly because the hailstones broke after impacting the specimen and their fragments impacted different regions of the skin.Furthermore,although there was still a large amount of residual kinetic energy after the hailstones impacted the central region of the skin, the direction of impact of their fragments was parallel to the skin.Therefore, damage to the specimen was limited except in the region of impact and in certain weak parts, such as the deltoid, the JSD, and the region penetrated by Z-pins.
3.2.Residual tensile performance
The typical load–displacement responses of the specimens are illustrated in Fig.11.The tensile stiffness of the intact specimens was nearly constant while that of the specimens with minor damage slightly decreased when the load was close to its ultimate value.Moreover, neither class of specimens showed initial failure points during the entire tensile process.However,initial failure points were monitored in all specimens with major damage, and the tensile stiffness significantly degraded in them.Furthermore,the tensile stiffness of all specimens improved due to reinforcement by Z-pins, especially in case of major damage.The slope of each curve was calculated by linear fitting using an initial segment as long as possible(R2≥0.995)to quantify the initial tensile stiffness of the specimens, as shown in Table 2.

Fig.10 Typical results of C-scan of intact specimens and specimens after hail impact.

Fig.11 Typical tensile load–displacement curves.
Table 2 Quasi-static tensile test results of T-joint specimens (±s).

Table 2 Quasi-static tensile test results of T-joint specimens (±s).
Note:The abbreviation UL,RUL-1st,and RUL-2nd mean the Ultimate Load,the first Region Ultimate Load,and the second Region Ultimate Load, respectively; (±s)means the average and standard deviation of the values of the three repeated tests for each combination.
RUL-2nd(kN)Unpinned R5-0 J 2.77 ± 0.04 2.58 ± 0.10 6.74 ± 0.13 / /Unpinned R10-0 J 2.91 ± 0.05 3.46 ± 0.15 9.32 ± 0.33 Z-pinned R5-0 J 2.88 ± 0.03 2.66 ± 0.48 6.69 ± 0.18 Z-pinned R10-0 J 3.07 ± 0.01 3.23 ± 0.19 9.14 ± 0.22 Unpinned R5-50.5 J 2.64 ± 0.02 4.11 ± 0.65 7.03 ± 0.12 Unpinned R10-50.5 J 2.81 ± 0.02 3.90 ± 0.15 9.89 ± 0.13 Z-pinned R5-50.5 J 2.70 ± 0.03 3.52 ± 0.16 7.04 ± 0.20 Z-pinned R10-50.5 J 2.90 ± 0.03 3.58 ± 0.12 9.86 ± 0.15 Unpinned R5-115.4 J 2.05 ± 0.02 4.75 ± 0.18 5.03 ± 0.09 Unpinned R10-115.4 J 2.21 ± 0.02 4.25 ± 0.19 6.27 ± 0.12 Z-pinned R5-115.4 J 2.17 ± 0.02 6.63 ± 0.30 5.56 ± 0.23 3.28 ± 0.11 2.73 ± 0.11 Z-pinned R10-115.4 J 2.34 ± 0.02 6.54 ± 0.11 7.10 ± 0.16 3.53 ± 0.06 2.85 ± 0.10 Test Slope Displacement (mm) UL(kN)RUL-1st(kN)
The typical distributions of the equivalent von Mises strain of the intact specimens and the specimens with minor damage near the critical failure-inducing load are shown in Fig.12.They were obtained by the DIC technique.The results show that a larger deltoid increased the region of concentration of strain, which in turn weakened the effect of stress concentration per unit of the region (see (b1)vs.(b2)and(b3)vs.(b4)in Fig.12).This is the key factor for why the ultimate tensile load of the R10 specimens was always larger than that of the R5 specimens under the given control variables.A phenomenon contrary to common sense was noted whereby the ultimate loads of the specimens with minor damage were slightly greater than those of the intact specimens(see (a) vs.(b) in Fig.11 or Table 2).This is because the hail impact at lower energy led to a large number of discrete points of micro-damage in the specimen (especially in the deltoid).The results of DIC showed that the effects of strain concentration in the deltoid and the skin of the specimens with minor damage were weaker than those of the intact specimens under the same load (see (b1)vs.(b3)and (b2)vs.(b4)in Fig.12).This indicates that the micro-damage in the structure weakened the effect of stress concentration during the tensile process, thus increasing the ultimate load of the structure.A similar phenomenon was reported by Zhang et al.52

Fig.12 Typical distributions of equivalent von Mises strain.
For all Z-pinned specimens with major damage, the tensile load underwent two prominent stages of recovery after reaching the ultimate value,and the recovering loads were sustained over a certain displacement once they had reached their regional ultimate values, as shown in Fig.11(c).This suggests that the tensile load was not large enough to cause the instantaneous failure of the remaining region owing to a large amount of energy dissipation because of significant and progressive damage within the specimen.During this, the Z-pins performed well to stabilize the severely damaged T-joints.A detailed discussion of this is provided in Section 3.3.
The results for the intact specimens and specimens with minor damage show that the Z-pin-induced reinforcement had a limited influence on the ultimate tensile load.This is because the former exhibited almost no damage propagation in the early stage of loading while the latter weakened the effect of stress concentration owing to discrete micro-damage within the structure.As a result, both could withstand extremely high tensile loads before significant damage occurred.However, when the stress reached its critical failure value,the damage propagated rapidly from the deltoid.The strength of separation between layers of the region reinforced by Z-pins was far greater than the bonding strength.Therefore, failures of the region reinforced by Z-pins and other regions were almost synchronous, and could not reflect the Z-pin-induced reinforcement.By contrast, because of the significant initial damage, especially the inter-laminar damage of the bonding interface, caused by the higher impact energy, the Z-pin had a significant reinforcement effect on specimens with major damage.The propagation of damage was suppressed by the bridging effect of the Z-pins, and led to a slower reduction in the tensile stiffness of the specimens in the later stage of loading as well as a significant increase in the ultimate tensile load.
In contrast to the Z-pin-induced reinforcement, the influence of the deltoid on the ultimate load of the T-joints decreased with increasing degrees of damage at the JSD, as shown in Fig.13.This is due to the fact that the specimens improving the structure tensile strength by means of the larger size of the deltoid lost more structure strength.In extreme cases, the deltoid and skin were completely separated when delamination-related damage in the specimens had propagated to the region reinforced by Z-pins, and the deltoid lost nearly all influence on the tensile properties of the structure.This is also why the ultimate tensile load was sensitive to the size of the deltoid while the regional ultimate tensile load was not,as shown in Fig.11(c).

Fig.13 Growth rates of the ultimate load of specimens based on Z-pin and deltoid respectively.
3.3.AE-based examination of damage mechanisms
The Davies–Bouldinindices corresponding to different numbers of clusters (k) are shown in Fig.14, and illustrate that the best effect of clustering was obtained when k = 3 in most cases,as shown in Fig.15,where each point represents an independent AE event.There were clear boundaries and almost no overlap among the clusters so that the types of damage could be distinguished.There were significantly more AE events in the damaged specimens than in the intact specimens because the hail impact led to many discrete points of damage.The continuous propagation of damage then caused a large number of AE events during loading.A mass of invalid AE events occurred owing to the weak connection between the L-pieces and the skin of some specimens after complete failure(a typical case is shown in Fig.16).As a consequence,only effective AE events were counted based on the actual time of failure of the specimens as shown in Table 3.

Fig.15 Typical cluster results distribution of (a)–(d) intact specimens and specimens after (e)–(h) 50.5 J hail impact, (i)–(l) 115.4 J hail impact.

Fig.16 Typical weak connection between L-pieces and skin of specimen after complete failure.
The AE events and the corresponding energy statistics were linked with the tensile load–displacement curves because of the constant rate of tensile loading,as shown in Fig.17.The entire loading process can be divided into three stages according to the characteristics of distribution of the three clusters, viz.,stage I (mainly including the AE events of cluster 1), stage II(from a surge in the AE events of cluster 2 to that in the AE events of cluster 3),and stage III(the rest of the region).There was a prominent sequence of the AE events in all specimens,namely Tcluster1<Tcluster2<Tcluster3(T represents the time of the first occurrence of AE event).The time of the first occurrence of the three types of the AE events was also advanced with the increase of the degree of damage caused by the hail impact.This was closely related to the strengths of different materials and interfaces within the specimen.According to the characteristics of the time of occurrence and energy distribution of the three types of AE events,events of cluster 1 were mainly caused by damage to the matrix,those of cluster 2 were mainly caused by the damage to the interface between the matrix and the fiber, and the AE events of cluster 3 were mainly caused by fiber damage.This is also why a majority of AE events belonged to cluster 1,which was the most widely distributed in the time domain regardless of whether the specimens had been damaged.
The statistical results show that a larger deltoid reduced the frequency of AE events but had a limited influence on their total number and proportion in case of different types of damage,as shown in Table 3.This is because the same type of AE event was related only to the performance of the material,and a larger deltoid reduced the local stress of the T-joint under the same load to reduce the rate of damage propagation.In other words, the corresponding AE events occurred as long as the local stress exceeded the critical strength of the material.In particular in specimens with minor damage, the ratio of AE events caused by interfacial damage(i.e.,cluster 2)to the total number of AE events was significantly higher than those of the other two types of specimens,as shown in Table 3.The reason is that almost no interfacial damage propagation occurred in the intact specimens until the tensile load had reached about 65%of the ultimate load.The structure then completely failed instantly after reaching the ultimate load,and largely featured fiber damage at this time as shown in Figs.17(a)–(d).On the contrary,fiber damage in specimens that had undergone majordamage was more serious than that in the other specimens.AE events caused by fiber damage were thus more likely to occur during the loading process, which reduced the proportion of AE events caused by the interface damage to a certain extent,as shown in Figs.17(i)–(l).
Table 3 k - means clustering results of AE events of T-joint specimens during quasi-static tensile tests (±s).

Table 3 k - means clustering results of AE events of T-joint specimens during quasi-static tensile tests (±s).
Range 3)(%5.0–8.1 4.1–9.8 6.7–10.1 Percentage3 0.4 0.8 0.4 0.4 1.6 1.5 1.1 1.0 0.7 0.2 1.3 1.4)(%5.4 ±7.2 ±5.8 ±6.9 ±6.2 ±6.6 ±8.7 ±6.7 ±7.6 ±7.5 ±8.5 ±8.2 ±Total number of cluster 3 5736 4646215127117263 22±24±23±23±212 ±269 ±188 ±386 ±366 ±432 ±415 ±Range 2)(%3.0–4.5 14.7–17.0 198±6.5–9.1 0.6 0.6 0.1 0.40.9 0.4 0.8 0.4 0.8 0.4 0.2 1.0 Percentage2)(%3.9 ±3.5 ±4.3 ±3.6 ±15.9 ±15.8 ±15.7 ±16.0±7.9 ±7.1 ±6.8 ±7.7 ±3234530 number 27 64 38 17 13 53 Total of cluster 2 11 ±16 ±12 ±511 ±489 ±444 ±348 ±341 ±391 ±Range 1)(%88.7–90.9 16 ±73.6–80.0 511 ±83.1–86.0 398±Percentage 1 0.3 0.4 0.5 0.7 2.1 1.8 1.9 1.1 0.9 0.2 1.0 0.9)(%90.7 ±89.3 ±89.9 ±89.5 ±77.9 ±77.7 ±75.6 ±77.3±84.5±85.4±84.7±84.2±Total number of cluster 1 79497073211 158 268 266 208 66 173 119 368 ±294 ±348 ±300 ±2515 ±2518 ±2370 ±2135±4288±4189±4278±4291±Range 255–484 3487 5344 83 201 2243–180 number 288 865777 379 195 4797–71222 91 Total of AE events 405 ±329 ±387 ±335 ±3225 ±3242 ±3128 ±2768±5072±4903±5051±5098±Test Unpinned R5-0 J Z-pinned R5-0 J Unpinned R10-0 J Z-pinned R10-0 J Unpinned R5-50.5 J Z-pinned R5-50.5 J Unpinned R10-50.5 J Z-pinnedR10-50.5 J UnpinnedR5-115.4 J Z-pinnedR5-115.4 J UnpinnedR10-115.4J Z-pinnedR10-115.4J Note: x-±s()means the average and standard deviation of the values of the three repeated tests for each combination.
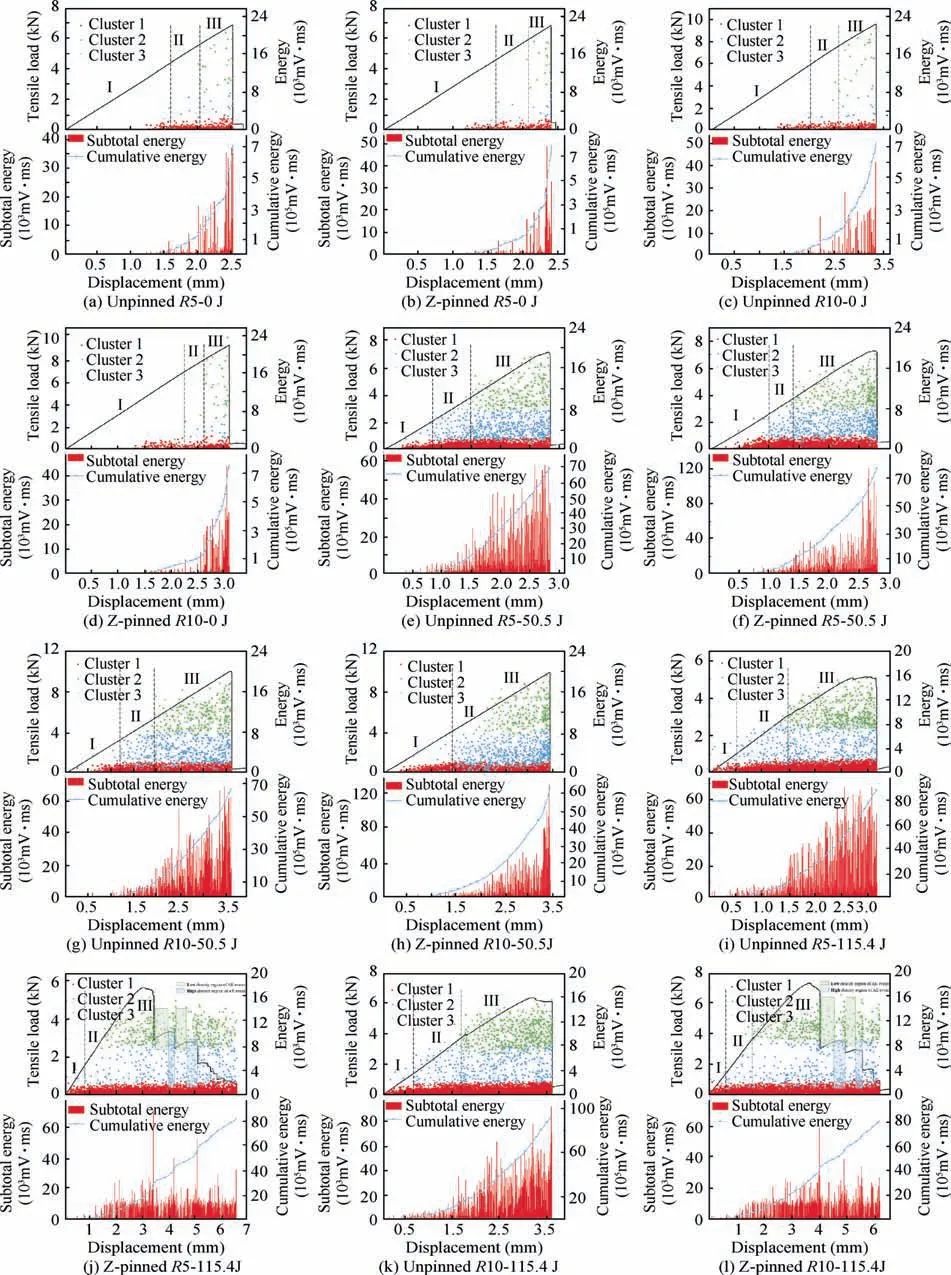
Fig.17 Typical distribution of AE events and energies with displacement(time)of(a)–(d)intact specimens and specimens after (e)–(h)50.5 J hail impact, (i)–(l) 115.4 J hail impact.
The Z-pin reinforcement inhibited damage propagation in specimens with major damage to a large extent.The energy released by the AE of the specimens was significantly more uniform during the entire tensile process, as shown in Figs.17(j) and (l), indicating that the Z-pins played an important role in inhibiting the rapid propagation of damage in the later stage of tensile loading.Furthermore, cracks were temporarily suppressed, especially when they propagated to the region of Zpin reinforcement.This was subsequently reflected in the stage of load recovery of the load–displacement curve.In this period, the AE events caused by fiber damage decreased significantly in number, as shown in green region of Figs.17(j) and(l).Stress concentration at the tip of the crack continued to increase, and led to the continuous damage to the matrix as well as interfacial damage prior to the fracture of the Z-pin because of the weaker resin and interface.This was reflected during load stabilization in the load–displacement curve.In this period, the AE events caused by damage to the resin and the interface increased significantly in number, as shown by the blue region of Figs.17(j) and (l).Finally, the Z-pins near the deltoid were the first to fail, and the local stress was redistributed once it reached the limit of fracture or pull-out of the Z-pins.This led to multiple stages of load recovery and stabilization.The characteristics of energy release and the distribution of damage in the time domain in the entire process support the above analysis.
4.Conclusions
This study reported an experimental investigation of Z-pinned CFRP T-joints to better understand their mechanism of damage tolerance.The following conclusions can be drawn:
(1) The influence of the deltoid and the Z-pin on the structural performance of the T-joints could not be reflected in the process of hail impact.However, this impact led to prominent and discrete points of damage in the specimens,and differences in the degrees of damage had the opposite effects on the residual properties of the Tjoints.Specifically, major discrete damage significantly reduced the ultimate tensile load of the T-joints and minor discrete damage helped increase it.This was closely related to the influence of discrete damage on the stress distribution of the specimens during loading.
(2) The tensile properties of the T-joints improved due to Zpin reinforcement in BRBSFs and a larger deltoid.The former had a limited influence on the ultimate tensile load of the intact specimens and specimens with minor damage, while the effect of reinforcement was better reflected in specimens with major damage.The latter significantly improved the ultimate tensile load of specimens in various states (including intact and damaged specimens), but led to the side-effect of a quicker decrease in the ultimate tensile load under the same degree of damage.In particular, once the deltoid had been completely separated from the skin due to interlaminar damage,its beneficial effect on the tensile properties of the T-joints was lost.
(3) AE technology can be used to monitor the evolution of damage to composites during the quasi-static tensile process and distinguish among the types of damage.This is conductive to a detailed analysis of the mechanisms of damage.Although the AE events of T-joints were largely caused by damage to the matrix before tensile failure, the hail impact-induced differences in the degrees of damage had a significant influence on the ratio of AE events caused by different types of damage.Furthermore, a larger deltoid and Z-pin reinforcement had a limited influence on the number of AE events caused by different types of damage, but helped reduce their frequency.
Declaration of Competing Interest
The authors declare that they have no known competing financial interests or personal relationships that could have appeared to influence the work reported in this paper.
杂志排行

CHINESE JOURNAL OF AERONAUTICS的其它文章
- Improving surface integrity when drilling CFRPs and Ti-6Al-4V using sustainable lubricated liquid carbon dioxide
- A hybrid chemical modification strategy for monocrystalline silicon micro-grinding:Experimental investigation and synergistic mechanism
- Analysis of grinding mechanics and improved grinding force model based on randomized grain geometric characteristics
- Experimental and modeling study of surface topography generation considering tool-workpiece vibration in high-precision turning
- Collaborative force and shape control for large composite fuselage panels assembly
- Ultrasonic constitutive model and its application in ultrasonic vibration-assisted milling Ti3Al intermetallics