榆林景观生态完整性的地统计分析
2023-04-29石玉琼王宁练
石玉琼 王宁练
摘要 景觀生态完整性是一种区域化变量,具有异质性,其异质性随时间发生变化,且在不同年份受不同因素的驱动。利用地统计学方法,运用GS+9.0软件对榆林市景观生态完整性(LEI)的各向同性和各向异性变异进行了研究。在各向同性条件下,2000年、2005年、2010年和2015年由随机因素引起的空间异质性分别占总空间异质性的7.30%、45%、43.5%和30.7%,主要表现在10 km范围内。而在这4年中,由空间自相关因子引起的空间异质性分别占92.7%、55%、56.5%和69.3%,主要表现在10 km和54.6 km、153.6 km、181.8 km以及 119.4 km之间,榆林这几年空间异质性主要由空间自相关因素引起。LEI的块金值与基台值之比从0.073 变化到0.45,反映了LEI具有中度到强度空间相关性。景观生态完整性的空间格局越简单,空间依赖性越强。各向异性条件下,2000年、 2005年、 2010年和2015年以空间结构性变异为主, 分别占到总空间变异的71.84%、70.00%、71.85%和85.80%。景观生态完整性的空间格局是景观特征的综合反映,并受随机因素和结构性因素的共同作用,地统计学可以很好地表达景观生态完整性的空间异质性。
关键词 景观生态完整性;地统计学;半方差分析;各向同性变异;各向异性变异
中图分类号:Q149 DOI:10.16152/j.cnki.xdxbzr.2023-01-003
Geostatistics analysis of landscape ecologicalintegrity in Yulin,China
SHI Yuqiong1,2,3, WANG Ninglian1,2
(1.College of Urban and Environmental Science, Northwest University, Xian 710127, China;
2.Shaanxi Key Laboratory of Earth Surface System and Environmental Carrying Capacity, Northwest University,
Xian 710127, China; 3.College of Forestry, Shanxi Agricultural University, Jinzhong 030801, China)
Abstract Landscape ecological integrity is a regionalized variability and has heterogeneity. Its heterogeneity varies over time and is driven by different factors in various years. In this paper, Geostatistical methods were used for isotropic variation and anisotropic variation of landscape ecological integrity (LEI) in Yulin using GS+9.0 software. Under isotropic conditions, the spatial heterogeneity caused by random factors accounted for 7.30%, 45%, 43.5% and 30.7% of the total in 2000, 2005, 2010 and 2015 respectively, mainly within the range of 10km. In these four years, the spatial heterogeneity caused by spatial autocorrelation factors accounted for 92.7%, 55%, 56.5% and 69.3% respectively, mainly between 10 km and 54.6 km, 153.6 km, 181.8 km and 119.4 km. Spatial heterogeneity was generated by spatial autocorrelation factors principally in recent years in Yulin. The ratio of nugget value to base value of LEI varied from 0.073 to 0.45, reflecting a moderate to strong spatial correlation of LEI. The simpler the spatial pattern of landscape ecological integrity, the stronger the spatial dependence. In anisotropic situations, the spatially structured variance dominated in ratio of 71.84%, 70.00%, 71.85% and 85.80% of the total independently in 2000, 2005, 2010 and 2015. The spatial pattern of Landscape ecological integrity is a synthetic expression of landscape characteristics influenced by random factors and structural factors. Geostatistics can be well used to express the spatial heterogeneity of landscape ecological integrity.
Keywords landscape ecological integrity; geostatistics; semi-variance analysis; anisotropic variation; isotropic variation
景观生态完整性(LEI)是指景观在结构和功能上保持其自组织能力、稳定性和多样性的能力[1]。生态完整性强的景观具有结构复杂、自组织能力强、稳定性强3个特征[1]。在其他条件相同的情况下,景观生态系统的结构越复杂,生境越多样,自组织能力越强,越稳定,其景观生态完整性越强。
景观生态完整性是综合的概念,受多种因素影响,并随内因或外因的变化而变化。内因变化属于景观的自然变异,外因是附加在景观上的外在因素。地统计学可以区分这两种变异来源[2]。
地统计学是以区域化变量理论[3]为基础,以半方差函数为工具,对同时具有随机结构和空间结构的自然现象进行研究的一种方法。地统计学在数据处理中整合区域化变量的空间坐标,并可以对空间格局进行描述和建模[4]、进行空间自相关分析[5]。空间信息使这种方法成为处理空间变异的一种强有力技术[6]。在景观尺度上,地统计学在评估参数的空间依赖性和变异性方面替代了传统统计学,并更具有优越性[7]。由于地统计方法可利用相邻观测值之间的空间相关性来预测无样本区域的属性值,所以越来越受到青睐[5]。地统计学在环境方面的应用很广泛,如在土壤、空气质量、气候变化及林业等方面,从理论到应用[8]。它被用于解释土壤性质及其相关变量的空间格局[9-14],以及温度[15]、降雨[16]、NDVI[17]、景观生态服务[18]、小麦需水量[19]、土地退化[20]等空间格局分析。
生态完整性受到生态学家和环境学家们的广泛关注[21]。然而,对LEI的地统计分析研究还很有限。笔者曾就景观生态完整性评价的框架进行了讨论,并评价了榆林市2000年到2015年景观生态完整性[1],本文是榆林景观生态完整性评价研究的拓展和延伸。
榆林属于生态脆弱区,采矿、城镇化等人类活动强烈,是陕西省退耕还林[22]和“三北防护林”[23]的重点实施区域之一。因此,为了更进一步认识榆林景观生态完整性的空间分异特征,本文基于之前对榆林景观生态完整性评价[1],研究了LEI的空间变异性及其尺度,分析空间变异性因素。
1 数据与方法
1.1 研究区概况
榆林位于陕西省北部介于31°42′~39°35′N, 105°29′~111°15′E之间,面积43 578 km2。境内包括两大地貌单元:毛乌素沙地南部的风沙草滩区和黄土丘陵沟壑区,分别属于鄂尔多斯高原和黄土高原。气候上属温带大陆性半干旱季风气候,四季分明,雨季主要集中在夏季。年平均气温10 ℃,年平均降水量400 mm。榆林是陕西省境内唯一一个兼有内流河水系和外流河水系的地域,位于毛乌素沙地与黄土高原的过渡地带以及农牧交错带,是实施退耕还林还草工程地区之一。
1.2 研究方法
为了更好地理解LEI与环境因子之间的复杂关系,必须研究LEI空间变异。景观生态完整性因内在或外在来源的变异而发生变化。内在变异性是景观的自然变化,而外在变异性是由强加在立地上的因素造成的[2,24]。地统计学可以区分这两种变异。
为分析景观生态完整性的空间特征,采用10 km×10 km栅格将榆林划分为527个单元(见图1),计算各栅格的景观生态完整性指数(ILEI)。每個指数的空间位置在其网格的中心。ILEI是一个没有量纲的标准化值,其计算方法见参考文献[1]。
2 结果与讨论
2.1 景观生态完整性的各向同性变化
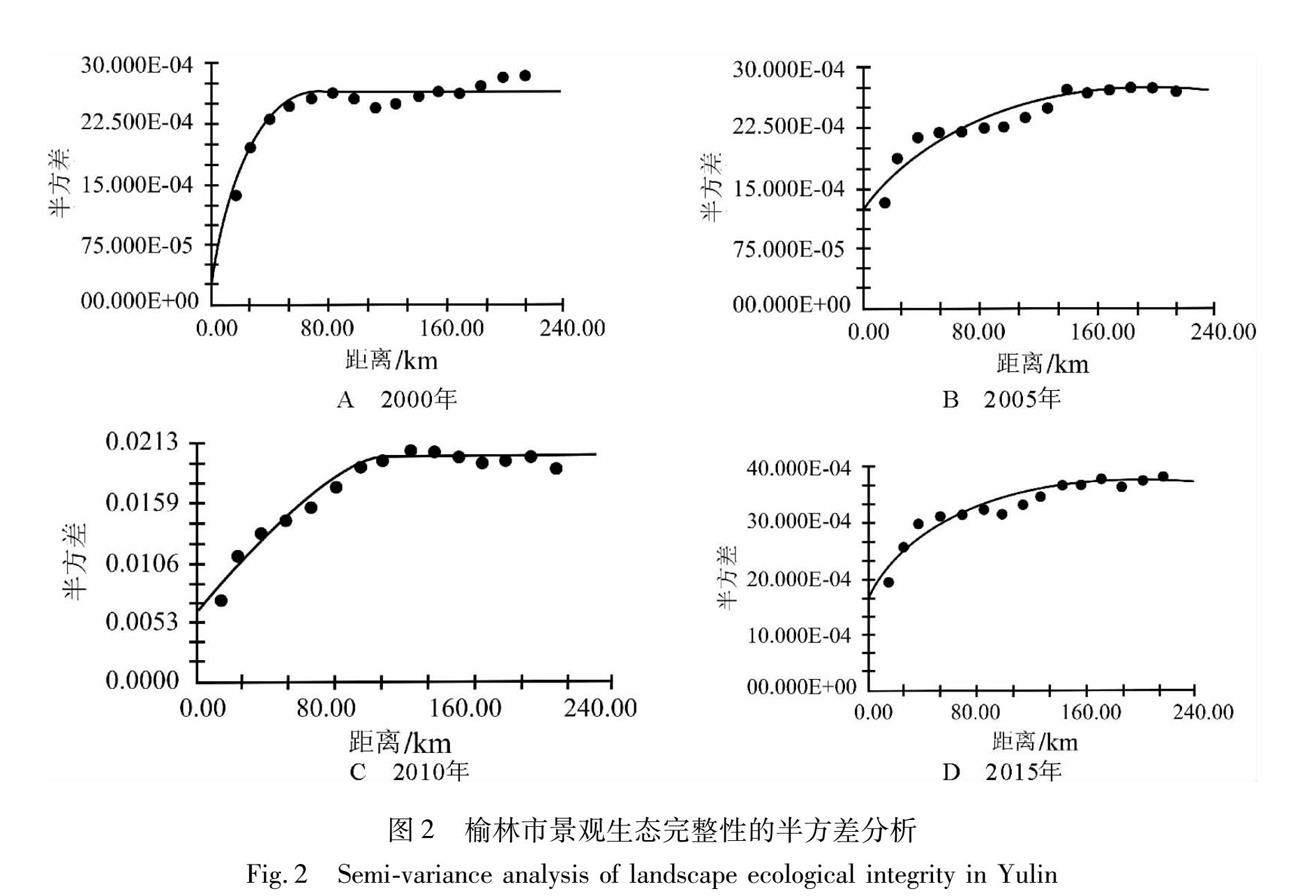
地统计中,用理论半方差函数模型拟合经验半方差函数,得出变异函数模型参数,如在Y轴上的截距,称为块金值或块金方差(C),反映的是最小抽样尺度以下变量的变异性、测量误差、采样误差和样本间误差等[30]。榆林在2000—2015年间,LEI的块金值为0.000 196~0.006 36,表明由样本间误差引起的空间变异较小,其误差值可用于分析LEI的空间变化。
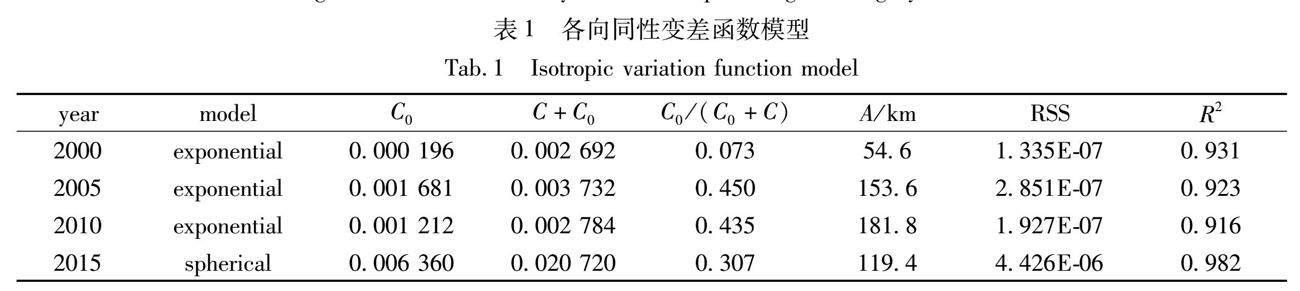
对景观生态完整性指数进行半变异函数拟合,以揭示相邻单元之间景观生态完整性的空间变异程度。榆林市2000年、2005年和2010年的半变异函数与指数模型拟合良好,2015年的半变异函数以球形模型拟合最好。
块金值能够反映变量空间变异的一些信息,表示空间独立变异和随机部分的空间异质性[31],以及小于最小抽样尺度变异采样上的局部变异[2]。从2000—2005年以及从2010—2015年,榆林市的景观生态完整性的块金值增大(见图2,表1),表明这两个时期景观生态完整性的局部异质性增大。2005—2010年,景观生态完整性的块金值呈下降趋势。这表明2005—2010年景观生态完整性方差呈下降趋势,其异质性在同一时期呈下降趋势。
变程是变异函数达到其基台值的距离[31-32]。2000年的变程比其他年份小得多。表明2000年的景观生态完整性空间变异范围远比其他年份小。
基台值或基台方差(C+C)表示总变异,包括空间结构变异和随机变异。2015年榆林景观生态完整性的基台值最大,表明其总变异最大。块金值与基台值的比值C/(C+C)为空间相关度,表示可度量空间自相关的变异所占的比例。一般来说,基台比C/(C+C)≤25%表示空间相关性强,而基台比≥75%表示空间相关性很弱或不存在空间依赖性。基台比在25%和75%之间,空间相关性为中等[14,17,33-34]。2000年、2005年、2010年和2015年,由随机因子引起的的空间变异分别占总空间变异的7.3%、45%、43.5%和30.7%,主要集中在10 km以内。而由结构性因素引起的的空间变异分别占到总变异的92.7%、55%、56.5%和69.3%,主要集中在10 km ~ 54.6 km、10 km ~ 153.6 km、10 km ~181.8km和10 km ~ 119.4km之间,因此,2000年的空间依赖性较强,2005年、2010年和2015年的空间依赖性中等。可见,与土壤水分[14]、土壤有机质[7]等其他区域化变量一样,LEI也具有空间依赖性。
与2000年相比,2005年随机过程(即外部因素)产生的空间变异增加了。2005—2010年,由随机过程引起的空间变异略有下降,而由结构性因素引起的空间变异略有增加。2010—2015年,随机过程引起的空间变异减小,结构性过程引起的空间变异增大。由此可见,LEI具有空间变异,并且在不同年份,主要由随机因素即外在因素引起的空间变异和主要由结构因素即内在因素引起的空间变异是不同的。
这表明,在小尺度下,人类活动等随机因素是影响景观生态完整性空间变异的主要因素。在大尺度上,内在因素是影响其空间变异性的主要因素。这里的小尺度是在10 km以内,大尺度是在10 km以外。因为讨论的是景观生态完整性,所以研究尺度和采样尺度都是景观。这与土壤属性等其他地统计学分析不同,在土壤属性分析中,采样间隔只有几米到几百米[35-36]。尽管如此,基本结果是一致的,即随机因素在小尺度上影响空间变异,而内在因素在大尺度上影响空间变异。
Morans I值大,表示空间自相关强[37]。根据Morans I(见表2),可知2015年LEI的空间自相关性最强,而2010年最弱。总体上,景观生态完整性的空间自相关性为中度。
分维数可以在沒有特征尺度的情况下表征自相似结构,用于说明自相关变量分布格局的复杂性[38]。分维数越大,空间分布格局越简单,空间依赖性越强,空间结构越好。分维数越小,空间分布格局越复杂,由随机因素引起的异质性越大。基于方差函数分析,计算各向同性分维数 (见表3、图3)。4年的分维数均大于1.830,总体上较大,说明这4年LEI的空间依赖性较强。2000年分维数为1.905,为4年来最大,说明2000年LEI空间分布格局简单,空间依赖性强,空间结构良好。
2.2 景观生态完整性的各向异性变化
各向异性有带状异向性和几何异向性。GS+计算的是几何各向异性,其中范围随方向变化,但各方向的基台值和块金值相同。在各向异性条件下,块金值的变化分为3个阶段,2000—2005年、2010—2015年,块金值增大,而2005—2010年块金值减小(见表3)。2000、2005、2010、2015这四年随机因素引起的变异分别占总变异的28.16%、30%、28.15%和15.20%,占比比较小,而由结构性因素引起的变异占主导地位,占比均在70%以上。各向异性比在2000年、2005年、2010年和2015年分别为1.96、1、1和1。不同年份的各向异性特征如图4所示。不同方向的半方差明显表现出不同的行为特征。2000年、2010年和2015年,在50 km范围内4个方向的半方差变化趋势基本相同,2005年在100 km范围内的半方差变化趋势基本相同(见图4)。
因此,无论是从景观生态完整性的各向同性还是各向异性变化来看,景观生态完整性的异质性在不同年份是由不同因素引起的。景观生态完整性的空间格局是景观受随机因素和结构性因素影响的综合表现。随机因素造成的空间异质性在2000年较小,而在2015年较大,这与2015年人类活动强度远高于2000年的情况相一致。
3 结语
LEI是一种区域化变量,具有区域特征和空间依赖性。地统计学可以很好地用来分析景观生态完整性的空间异质性。结果表明,不同年份、不同距离下LEI的空间异质性是由不同因素造成的。总体上,榆林市景观生态完整性的空间自相关性为中等。在大尺度上,LEI的空间异质性主要受空间结构因子的控制。无论是各向同性还是各向异性条件下,结构性因子引起的LEI空间变异主要表现在10 km以外。
参考文献
[1] SHI Y Q, WANG N L, LI T S, et al. Evaluation of landscape ecological integrity in the Yulin region, China[J].Sustainability,2018(10): 4300-4313.
[2] WANG J M, YANG R X, BAI Z K. Spatial variability and sampling optimization of soil organic carbon and total nitrogen for Minesoils of the loess plateau using geostatistics[J].Ecological Engineering,2015(82): 159-164.
[3] GOOVAERTS P. Geostatistics in soil science: State-of-the-art and perspectives[J].Geoderma,1999(89):1-45.
[4] GOOVAERTS P. Geostatistical tools for characterizing the spatial variability of microbiological and physico-chemical soil properties[J].Biology and Fertility of soils,1998(27):315-334.
[5] GOOVAERTS P. Geostatistical approaches for incorporating elevation into the spatial interpolation of rainfall[J].Journal of Hydrology,2000(228):113-129.
[6] YOST R S, UEHERA G, FOX R L. Geostatistical analysis of soil chemical properties of large land areas. I. Semi-variograms[J].Journal of the Soil Science Society of America (USA),1982,46:1028-1037.
[7] CAMARGO L A, MARQUES J J, PEREIRA G T,et al. Spatial correlation between the composition of the clay fraction and contents of available phosphorus of an oxisol at hillslope scale[J].CATENA. 2013(100):100-106.
[8] GMEZ-HERNNDEZ J J, HORTA A, JEANE N. Geostatistics for environmental applications[J].Spatial Statistics,2013(5):1-2.
[9] YOST R S, UEHARA G, FOX R L. Geostatistical analysis of soil chemical properties of large land areas.Ⅱ. Kriging 1[J].Soil Science Society of America Journal,1982(46):1033-1037.
[10]WEBSTER R, OLIVER M A. Optimal interpolation and isarithmic mapping of soil properties. Vi. Disjunctive kriging and mapping the conditional porbability[J].Journal of Soil Science,1989(40):497-512.
[11]WEBSTER R, OLIVER M A. Geostatistics for environmental scientists[M].New York: John Wiley & Sons Inc,2007.
[12]SYAM T. Spatial variability of soil nutrients content related to rice yield[J].Jurnal Tanah Tropika,2010(15):153-157.
[13]STEVENS F, BOGAERT P, WESEMAEL B. Detecting and quantifying field-related spatial variation of soil organic carbon using mixed-effect models and airborne imagery[J].Geoderma,2015:259-260, 93-103.
[14]YANG J, CHEN H, NIE Y,et al.Spatial variability of shallow soil moisture and its stable isotope values on a karst hillslope[J].Geoderma(Part A),2016(264): 61-70.
[15]WU T T, LI Y R. Spatial interpolation of temperature in the united states using residual kriging[J].Applied Geography,2013(44): 112-120.
[16]SARANGI A, COX C, MADRAMOOTOO C. Geostatistical methods for prediction of spatial variability of rainfall in a mountainous region[J].Transactions of the ASAE,2005(48): 943-954.
[17]YANG Y, ZHU J, ZHAO C, et al. The spatial continuity study of NDVI based on kriging and BPNN algorithm[J].Mathematical and Computer Modelling,2011(54): 1138-1144.
[18]UUGARO F, ZASADA I, PIORR A. Mapping landscape services, spatial synergies and trade-offs. A case study using variogram models and geostatistical simulations in an agrarian landscape in north-east germany[J].Ecological Indicators,2014(46): 367-378.
[19]NAZARIFAR M H, MOMENI R, KANANI M H. Comparison of spatial interpolation methods for wheat water requirement and its temporal distribution in hamedan province (iran)[J].Journal of Urban and Environmental Engineering,2014(8):218-224.
[20]ABDELRAHMAN M A E,NATARAJAN A,et al. Assessment of land degradation using comprehensive geostatistical approach and remote sensing data in gis-model builder[J].The Egyptian Journal of Remote Sensing and Space Science,2019(22): 323-334.
[21]RAMESH S, KAPLANA K. Ecological integrity and environmental protection for vijayawada region-scattered eastern ghats[J].International Journal of Sustainable Built Environment,2015(4):109-116.
[22]CAO S, XI C, CHEN L, et al. Attitudes of farmers in chinas northern shaanxi province towards the land-use changes required under the grain for green project, and implications for the projects success[J].Land Use Policy,2009(26):1182-1194.
[23]CAO S, SUO X, XIA C. Payoff from afforestation under the three-north shelter forest program[J].Journal of Cleaner Production,2020(256):120461.
[24]RAO P S C, WAGENET R J. Spatial variability of pesticides in field soils: Methods for data analysis and consequences[J].Weed Science,2017(33): 18-24.
[25]GOOVAERTS P. Study of spatial relationships between two sets of variables using multivariate geostatistics[J].Geoderma,1994(62): 93-107.
[26]OLIVER M A, WEBSTER R. A tutorial guide to geostatistics: Computing and modelling variograms and kriging[J].CATENA,2014(113): 56-69.
[27]THOMPSON E S, SAVEYN P, DECLERCQ M, et al. Characterisation of heterogeneity and spatial autocorrelation in phase separating mixtures using Morans I[J].Journal of Colloid and Interface Science,2018(513): 180-187.
[28]KUMARI M,SARMA K,SHARMA R.Using Morans I and GIS to study the spatial pattern of land surface temperature in relation to land use/cover around a thermal power plant in singrauli district, madhyapradesh, India[J].Remote Sensing Applications: Society and Environment,2019(15): 100239.
[29]TILL Y, DICKSON M M, ESPA G, et al. Measuring the spatial balance of a sample: A new measure based on Morans I index[J].Spatial Statistics,2018(23): 182-192.
[30]PICCINI C,MARCHETTI A,FRANCAVIGLIA R. Estimation of soil organic matter by geostatistical methods: Use of auxiliary information in agricultural and environmental assessment[J].Ecological Indicators,2014(36): 301-314.
[31]YAN W, MAHMOOD Q, PENG D, et al. The spatial distribution pattern of heavy metals and risk assessment of moso bamboo forest soil around lead-zinc mine in Southeastern China[J].Soil and Tillage Research,2015(153): 120-130.
[32]CHEN T, LIU X, ZHU M,et al. Identification of trace element sources and associated risk assessment in vegetable soils of the urban-rural transitional area of Hangzhou, China[J].Environmental Pollution,2008(151): 67-78.
[33]ZOLFAGHARI Z, AYOUBI S, MOSADDEGHI M R. Spatial variability of some soil shrinkage indices in hilly calcareous region of western iran[J].Soil and Tillage Research,2015(150): 180-191.
[34]BITENCOURT D G B, BARROS W S, TIMM L C, et al. Multivariate and geostatistical analyses to evaluate lowland soil levelling effects on physico-chemical properties[J].Soil and Tillage Research,2016(156): 63-73.
[35]RANJBAR F, JALALI M. The combination of geostatistics and geochemical simulation for the site-specific management of soil salinity and sodicity[J].Computers and Electronics in Agriculture,2016(121): 301-312.
[36]GHOLAMI S, SAYAD E, GEBBERS R,et al. Spatial analysis of riparian forest soil macrofauna and its relation to abiotic soil properties[J].Pedobiologia,2016(59):27-36.
[37]HHO X N, LI H, SUN D F, et al. Combining geostatistics with Morans analysis for mapping soil heavy metals in Beijing, China[J].International Journal of Environmental Research and Public Health,2012(9): 995-1017.
[38]WU Y L, CHEN L, WEI Z, et.al. Spatial heterogeneity of plant species of stipa breviflora desert steppe under different grazing intensities[J].Journal of Arid Land Resources and Environment,2012(26): 110-115.
(編 辑 亢小玉)