Driver-Centric Velocity Prediction With Multidimensional Fuzzy Granulation
2023-03-09JiLiQuanZhouXuHeandHongmingXu
Ji Li,,Quan Zhou,,Xu He,and Hongming Xu
Dear Editor,
This letter deals with a real-world problem regarding chaotic time series prediction,where a driver-centric velocity prediction model is presented for vehicle intelligent control and advanced driver assistance,i.e.,multi-dimension fuzzy predictor.Inspired by fuzzy granulation technology,a finite-state Markov chain (MC) is reinforced to capture probabilities of the transitions between velocity and acceleration and present signals that vary in a continuous range.The predictability of the multi-dimensional fuzzy predictor is examined by comparing two existing MC-based predictors over the two laboratory cycles and one virtual driving cycle,both of which have high accuracy.
There are idiosyncrasies in the driving behavior of drivers.Different drivers differ in using the accelerator,brake pedal,and steering wheel [1].Given these differences,energy management based on individual driving habits can be more efficient [2].In order to successfully implement this differential energy management,one approach is to control the vehicle by analyzing a representative driver model to help each driver [3].Individual driver models or models under a subset of driving behavior categories can be trained offline or online.For supporting the target driver efficiently,a vehicle controller chooses a suitable driver model by differentiating drivers or assigning a model appropriate to their driving behavior.
Unlike previously,Augustynowicz divided the driver behavior into the region (−1,1);within 1,0,and −1 mean offensive,moderate,and mild separately [4].This is usually calculated based on fuel consumption,and the operating efficiency of vehicles reflected the aggressiveness level of driver behavior.Manzoniet al.[5] calculated the percentage of excessive consumption reflected the additional cost by comparing the estimated fuel consumption during the trip and a benchmarked consumption.Neubauer and Wood [6] calculated the vehicle efficiency to represent the driving behavior by using fuel consumption.Cortiet al.[7] introduced a cost function faced to energy to assess the driving behavior and predict fuel overconsumption.However,the feasibility of implementing this continuous index or discrete class-based classification approach for HEV energy management needs to be further analyzed and validated.
Related work:Considering the related algorithms for driver recognition,the driver torque demand is assumed to be exponentially varying over the predictive horizon based on the empirical formula [8].In contrast,the RB algorithmlimits the number of managed parameters.The RB algorithm can produce redundant and complex rules when dealing with larger data sets of variables.Fuzzy logic (FL) graphs are used instead of RB algorithms to address this situation.Syedet al.[3] introduced an FL algorithmto optimize the application of pedals in hybrid vehicles.Liet al.[9] introduce type-2 fuzzy sets to describe the driving style used for driver-oriented energy management.Based on these two algorithms,the results are simplistic and uniformin an acceptable way,but the classification quality is closely related to the threshold value.
The RB algorithmthreshold defines the resulting robustness and needs a huge number of data to be analyzed.Unsupervised algorithms can work efficiently without a clear understanding of the underlying process.Miyajimaet al.[10] implemented a Gaussian mixture model by analyzing the vehicle-following behavior and the signal spectrum of pedal operation.In the work of Liet al.[11],the spectrum-informed long short-termmemory networks have been developed that achieve the real-time recognition of drivers under the same driving scenario.The Markov model has also proven to be suitable for driving behavior recognition.Therefore,the driving behavior representation can be generated from the randompatterns of previous data.
Fuzzy granulation for Markov chains:Firstly,the velocity and acceleration of vehicles are expressed as a finite state MC [12].The state spaces of these two parameters are represented asV={vi|i=1,...,M}⊂X⊂R andW={aj|j=1,...,N}⊂Y⊂R .VandWdenote the state space of velocity and acceleration,separately;MandNdenote the sample numbers of velocity and acceleration,separately.Meanwhile,XandYdenote the finite set of variables,and R denotes the set of real numbers.Considering the balance of accuracy and computational efficiency,the collected samples of vehicle speed with the range of 0−135 km/h are uniformly discretized as 135 elements.The collected samples of vehicle acceleration with the range of −6 to 3 m/s2are uniformly discretized as 90 elements.The frequencies of its transition could be evaluated based on the possibilities of transition observation as follow:
wherevmeans the velocity;a+means the acceleration of the next time step;pijmeans the transition probability betweenvitoaj;Hijdenotes the number of transitions fromvitoaj;Himeans the number of total transitions fromvi;the matrixrepresents the transition probability matrix which is occupied withpij.Followed by (2),the probability vector of the next step is obtained as:
where λT(v)=[0...1...0] means a multi-dimensional probability vector with thejth element to denote a discontinuous stateajin disjoint zonesI j,j=1,...,N;means thejt h row of the matrixXandYare subdivided into finite groups,respectively,with fuzzy subsets Φi,i=1,...,Mand Φj,j=1,...,Nwhen using fuzzy granulation technology.The fuzzy subset Φiand Φjare pairs of(X,µi(·))and (Y,µj(·)),wherein µi(·),µj(·) are Lebesgue member functions which can be measured to satisfy the following equation:
where µi(v) displays the membership degree ofv∈Xin µi;µj(a)denotes the membership degree ofa∈Yin µj.Followed by the theory of approximate reasoning [13],the transformation assigned a multi-dimensional probability vector for eachv∈Xas:
This transformation is applied to develop the fuzzy norms and map velocity in theXto vector in multi-dimensional probability vector space.Furthermore,the elements in the probability vector∼O(v)are summed as 1.The next step’s probability distribution inis calculated from (5) and gathered with member function µ(a) to decode the vectors inYback to the spaceYas
where in the transition probability matrix,pijis explained as a transition probability between Φiand Φj.The member function µ(a) is applied to encode the probability vector of the next step in spaceY.
The centroid and volume of the membership function µ(a) are expressed as
Multi-dimensional fuzzy granulation:The multi-dimension fuzzy predictor (MDFP) with multi-dimensional fuzzy granulation is introduced to enhance the prediction performance of vehicle velocity by considering the driver behaviors for look-ahead steps.By using cluster algorithms,the original samples are classified into the personalized Markov chain models and then aggregate their outputs to improve sensitivity of the prediction model to sudden change of driving behaviors.Here,two types of clustering algorithms are explored,i.e.,fuzzy C-mean (FCM) with soft margin and support vector machine (SVM) with hard margin.
The auto-regression (AR) model is an efficient tool for generalizing the signal’s mean-time regressive pattern and predicting by the following dynamically.The applied AR model follows the structure displayed as [14]:
where ϑrare the AR model coefficients;Kis the order of the AR model;ϵkreflects theith noise;v(k) means the vehicle speed at stepk.In this research,the sample period τ is 0.1 s.
As real-world driving involves frequent transitions of the driving behavior,the AR models are applied to obtain driver speed information in moving horizontal lines,where parameters measure the length of these lines and the orderRof the models.According to the Corrected Akaike Information Criterion [15],the second-order AR models with a 200-second horizontal line showed a consistent advantage.The results are related to the data vector γrof speed interval samples,which includes four information sets as
where the AR coefficient set ϑ displays the tendency of sample speed change;mean acceleration ratioar_avgmeasures the mean state and the maximum acceleration ratear_maxRmeasures the range of acceleration changes.
Markov chain models with five layers show efficient computational efficiency and high predictive performance through training[14].The AR model coefficient sets are divided into five groups reflecting different acceleration statuses to represent specific driver states in this research.The five groups are fuzzified to display the acceleration range relationship for different driver behaviors.These behaviors are marked as Over mild;Mild;Moderate;Offensive and Over offensive.Given the unknowability of a priori information about vehicle performance and driving behavior preferences,two clustering algorithms of FCM and SVM in the unsupervised learning process are used to classify information with inaccurate internal boundaries as well as unknowable external boundaries [16],[17].
The results show the data member distributions for all of the groups.Based on the driving behavior classification,the transition probability matrixin (2) is detailed to be five specific transition probability matrixes as follows:
The acceleration probability distribution with different driving behaviors can be obtained more exactly by these detailed transition probability matrixes.Based on these matrixes,the next one-stepahead accelerations by driver groups can be displayed as
Here,the weighted sum coefficient is the member criterion aggregating acceleration prediction from five driver MC models.Equation(12) shows the next one-step-ahead velocity calculated as
where the member criterion vector ωn(v) reflects the data vector γrof the speed zone sample obtained by FCM;but the weights obtained by SVM,which only has 0 or 1 due to its binary classification,are introduced to replace ωn(v).
Experiments:In this study,the experiments are based on a cockpit package where five drivers are invited as observation subjects for 8000 s of virtual driving [18].The entire route consisted of a mix of highways and local roads with multiple stop signs,traffic lights and speed limit changes provided by IPG Car Maker.A Thrust master T500RS cockpit package and a host PC with I5-6500 3.2 GHz processor and 8 GB RAM are connected by a 3.0 USB cable to provide a static system experience platform driving simulators to human drivers.
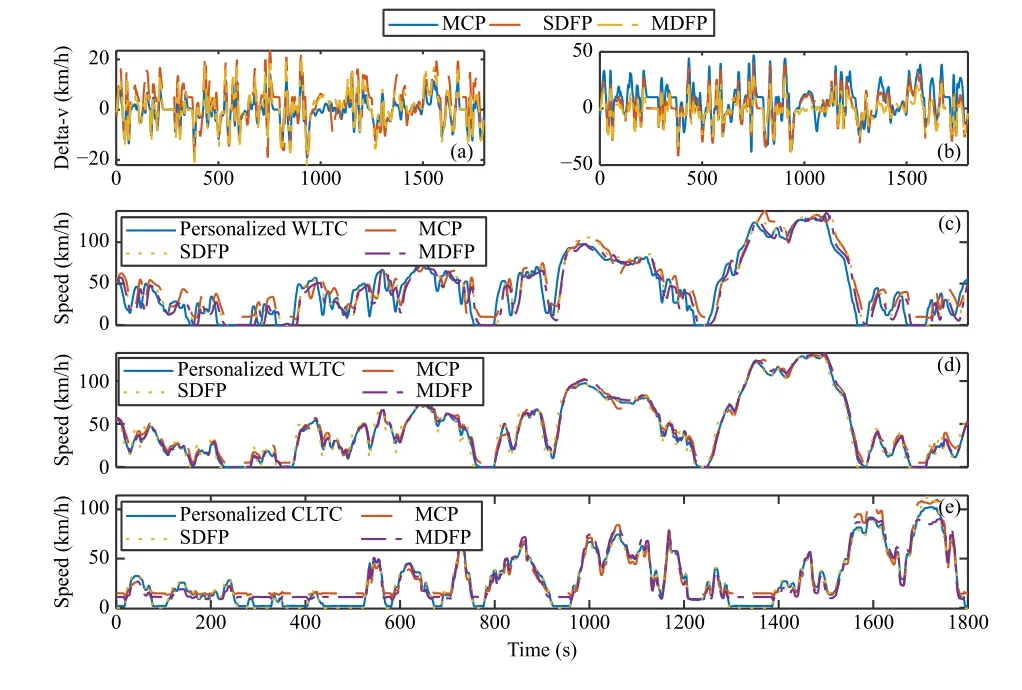
In this letter,existing MC-based predictors are introduced for analysis,including the Markov chain predictor (MCP) [19] and the single-dimension fuzzy predictor (SDFP) [20].Fig.1 shows the prediction speeds obtained by three predictors based on the personalized Worldwide harmonized light vehicles test cycles (WLTC) and personalized China light-duty vehicle test cycle (CLTC) by using FCM and SVM.MCP is proven with weak prediction performance in the low-speed zone because of the minute transition probability calculated by using one discrete MC model in this zone.The fuzzy granulation helps the SDFP fix the problem above in the low-speed zone.However,maintaining uniformity in the handling of different driving habits makes the predictability unsatisfied in the medium-high-speed zone.Due to the training dataset of the predictive model is continuously updating during virtual driving,MDFP displays a better prediction performance compared to the other two predictors mentioned above.More details about the comparison are shown in Table 1.Compared to FCM,SVM helps MDFP to reduce 98.4% of ITAE and 76.3% of maximumerror.

Fig.1.Speed prediction results of three MC-based predictors: The speed prediction errors by (a) using SVM;and (b) by using FCM;the speed prediction results under WLTC by (c) using FCM;and (d) using SVM;(e) the speed prediction results by using SVM under CLTC.

Fig.2.Online prediction results over virtual driving by SVM.
Fig.2 shows the driving simulation results of the DiL experiment with human drivers operating in a simulated driving scenario,where the absolute errors between prediction and reference speed are displayed.After 600 s of initialization,the MDFP begins to generate a 10 s look-ahead horizon,and its prediction model is updated in real-time every 5 s.The MDFP relies on the last driving step independent of the driver change while predicting speed,which helps the model to adaptively adjust speed based on the new pedal action if the individual driver’s driving behavior changes dramatically.It needs to be emphasized that the data recorded by the MDFP will be completely overwritten within 600 s.Therefore,the required cool downtime after a new driver replaced is 10 ms.
Conclusions:This letter presents a driver-centric velocity prediction model for vehicle intelligent control and advanced driver assistance,i.e.,multi-dimension fuzzy predictor.Its predictability is proven and examined with existing MC-based predictors.Two laboratory cycles and one virtual driving cycle are implemented for vehicle performance validation.The proposed multi-dimension fuzzy predictor has an ability to distinguish driving behaviors in real time.
杂志排行
IEEE/CAA Journal of Automatica Sinica的其它文章
- A Survey on Negative Transfer
- Three-Way Behavioral Decision Making With Hesitant Fuzzy Information Systems:Survey and Challenges
- Data-Driven Control of Distributed Event-Triggered Network Systems
- Driver Intent Prediction and Collision Avoidance With Barrier Functions
- Distributed Nash Equilibrium Seeking for General Networked Games With Bounded Disturbances
- Position Measurement Based Slave Torque Feedback Control for Teleoperation Systems With Time-Varying Communication Delays
