Tourism Route Recommendation Based on A Multi-Objective Evolutionary Algorithm Using Two-Stage Decomposition and Pareto Layering
2023-03-09XiaoyaoZhengBaotingHanandZhenNiSenior
Xiaoyao Zheng,,Baoting Han,and Zhen Ni, Senior
Abstract—Touris mroute planning is widely applied in the smart tourism field.The Pareto-optimal front obtained by the traditional multi-objective evolutionary algorithm exhibits long tails,sharp peaks and disconnected regions problems,which leads to uneven distribution and weak diversity of optimization solutions of tourism routes.Inspired by these limitations,we propose a multi-objective evolutionary algorithm for tourism route recommendation (MOTRR) with two-stage and Pareto layering based on decomposition.The method decomposes the multi objective problem into several subproblems,and improves the distribution of solutions through a two-stage method.The crowding degree mechanism between extreme and intermediate populations is used in the two-stage method.The neighborhood is determined according to the weight of the subproblem for crossover mutation.Finally,Pareto layering is used to improve the updating efficiency and population diversity of the solution.The two-stage method is combined with the Pareto layering structure,which not only maintains the distribution and diversity of the algorithm,but also avoids the same solutions.Compared with several classical benchmark algorithms,the experimental results demonstrate competitive advantages on five test functions,hypervolume (HV) and inverted generational distance (IGD) metrics.Using the experimental results of real scenic spot datasets from two famous tourism social networking sites with vast amounts of users and large-scale online comments in Beijing,our proposed algorithm shows better distribution.It proves that the tourism routes recommended by our proposed algorithm have better distribution and diversity,so that the recommended routes can better meet the personalized needs of tourists.
I.INTRODUCTION
WITH the rapid development of Internet technology,information overload has become an important problem.Determining how to quickly find useful information is a challenge.A personalized recommendation system[1] is an effective tool to alleviate the problem of information overload.It can help users make appropriate choices or recommend interesting items to users.The traditional travel recommendation system will consider the suggestions of experts or the opinions of experienced users,and provide the same place or trip to different users,ignoring the user’s personalized preferences.Users can plan their own itinerary by obtaining detailed information from the Internet,such as geographical features,scenic spot attributes,and other travelers comments on the location,but this will take a lot of time.At present,there are many electronic technology products in the market,such as mobile phones,GPS navigation systems and other location aware devices [2],which promote the wide application of location services.In particular,due to the popularity of location-based social networks (LBSNs) [3],navigation assistance and location sharing have become popular.These LBSN services build a bridge between the real world and virtual networks,as a tourist usually wants to visit a city with many scenic spots in a few hours.According to tourists preferences,each point of interest (POI) has a certain attraction,and each POI has a specific tour cost [4].In addition,tourists can choose different transportation facilities and modes,and the transfer cost and time are also different.In this case,many aspects need to be considered [5] : the potential utility and cost of accessing each POI,and the travel cost and transportation time between POIs.Therefore,we need to consider many factors to meet the personalized needs of users to provide route recommendations.
Tourism route recommendation is subject to a variety of constraints,and the expected objectives of tourists are often not single.As we all know,these tourists’ objectives contain many potential conflicts.Therefore,tourism route recommendation should be solved by applying the multi-objective optimization algorithm[6].Generally,there are four common approaches to solve multi-objective problems: Pareto optimization [7]−[9],heuristic algorithms [10],[11],weighted scoring mechanism[12],[13],and multi-objective algorithms based on decomposition [14],[15].Multi-objective problems have different shapes of Pareto optimal fronts (POF): concave,convex,line,separation and so on.The inferiority of Pareto optimization lines in the fact that it is challenging to find well distributed Pareto fronts for each shape.Heuristic algorithms also exhibit some weaknesses.For example,it is difficult to establish a series of heuristic rules in line with the actual problem and it is easy to fall into a local optimum.As for the weighted scoring mechanism,the weight determination of the weighted scoring mechanism is complex,and the quality of the solution can not be guaranteed.Multi-objective evolutionary algorithm based decomposition (MOEA/D) divides a multi-objective problem into multiple subproblems and optimizes multiple subproblems simultaneously.Each solution on the POF corresponds to the solution of each sub-objective.The MOEA/D algorithm generates a better diversity of solutions by crossing and mutating between adjacent domains.Thus,it can avoid the local optimal solution generated by the sub-objective.Based on the multi-objective decomposition algorithm,this paper focuses on the distribution and diversity of the tourism route to improve the quality of route recommendation,so as to meet the multi-objective needs of users.
The MOEA/D method has achieved some research and application results in solving multi-objective problems[16]−[19].Jianget al.[20] proposed an improved decomposition based modified multi-objective evolutionary algorithmto study the efficient distributed job shop scheduling problem based on minimum completion time and energy consumption.Galindres-Guanchaet al.[21] proposed a mathematical model considering both economic and work objectives,and used an accurate method based on the decomposition method to solve the vehicle routing problem.Geeet al.[22] combined the diversity loss selection method of local search with the multi mode mutation heuristic to update the MOEA/D method.Then,under the constraints of the available time window and capacity,the multi-objective vehicle routing problem with randomdem and is solved.Gaoet al.[23] proposed a multi objective estimation of the distribution algorithm based on decomposition,which combined MOEA/D with the multi objective traveling salesman method based on probability model.This algorithmcan optimize all subproblems by the cooperation of adjacent subproblems.Thus,it can find the approximate value of the original multi-objective traveling salesman problemin one run.However,the MOEA/D method can not play a good role when multi-objective has a complex POF,such as with discontinuous POF,POF with sharp peak or POF with long tail.For the complex POF mentioned above,if the MOEA/D method is adopted to solve this problem,its solutions are often unevenly distributed and do not have good diversity.Tourism route recommendation is a complex multi objective optimization problem whose solution is a complex POF.In order to improve the quality of tourist routes recommendation,the shortcomings of the solutions generated by the MOEA/D method must be overcome.
In order to solve this problem,we propose the multi-objective evolutionary algorithm for tourism route recommendation (MOTRR) method,which decomposes the multi-objective probleminto multiple neighborhood subproblems.Then,it uses the two-stage method to update the neighborhood weight through the weight vector initial method,so as to obtain better solution uniformity,and the crossover mutation between neighborhood subproblems increases the diversity of solutions.The Pareto layering structure can improve the distribution of the optimal solution by removing the worst solution.This paper verifies the distribution and diversity of the algorithm on the test function,and the results on the real datasets verify the effectiveness of the proposed algorithm,which can meet the personalized needs of users and improve user satisfaction.
The main contributions of this paper are as follows:
1) In order to solve the problem of uneven distribution of solutions in tourism route recommendation,a two-stage method is adopted in our proposed MOTRR model.The two stage method determines the boundary region and the intermediate solution by the crowding degree mechanism,and then uses the inverse scalar subproblem to complete the extreme distribution optimization,so as to avoid the same solutions in the offspring.Therefore,our proposed method can effectively improve the solution’s distribution of tourism route recommendation.
2) The existing Pareto layering structure in MOEA/D has the problem of premature convergence in the optimization of discrete objectives,resulting in poor quality and insufficient diversity of generated solutions.In this paper,several subregions are divided in the Pareto layering structure,and the penalty-based boundary intersection (PBI) values in the subregions are calculated at the same time.A new screening strategy for sub-region solutions according to the PBI is designed to improve the quality of generated solutions and enhance their diversity.
3) We use five test functions for the diversity and distribution of solutions,and two distribution and diversity metrics,IGD and HV respectively.Extensive experiments have been carried out on real tourism datasets in Beijing.The experimental results demonstrate that our proposed MOTRR method is superior to the comparative algorithms in both diversity and distribution of solutions.This shows that our proposed method can better meet the personalized needs of tourists.
The rest of this paper is organized as follows.Section II describes the related work of this paper.Section III describes the algorithm framework and principle of this paper.The experimental setup and comparative experiment are shown in Section IV and summarized in Section V.
II.RELATED WORK
A.Tourism Route Recommendation
Tourism route recommendation generally refers to generating several tourist routes that meet users’ needs by learning users’ interests according to constraints provided by users.The usual constraints are total travel price,travel time,hotel and other conditions.Kotilogluet al.[24] proposed an filter first,tour-second framework to solve the problem of user personalized multi-time window travel route recommendation.Caoet al.[25] proposed a keyword-aware optimal route search system covering various types of POI.When users provide POIs,the system is used to generate optimal routes for users.When users have little know ledge about POIs of a city,the system cannot generate routes in line with users’ preferences.Gunawanet al.[26] proposed a mathematical model for a tourist trip,and extended the team orienteering problem with the time windows constraint by introducing more realistic factors,such as total travel time,route starting point and end point.Duganiet al.[27] presented an adaptive and sequential recommendation method for travel routes,which took factors such as different locations,cost of each theme,visit time and distribution of visit seasons into account,so as to bridge the gap between users’ travel preferences and travel routes.Padiaet al.[28] proposed an improved sentimentaware personalized tour plan that considered each tourist’s interests based on his/her sentiments on specific categories relative to his/her overall preferences.Luanet al.[29] proposed a personalized trip recommendation method based on maximum extreme correlation,which considered the correlation and diversity of trips in route planning.Duanet al.[30]introduced a personalized travel route recommendation framework,which took into account the user’s travel restrictions,such as time limits,starting attraction restrictions,and destination attraction restrictions.
B.Evolutionary Multi-Objective Optimization
One way to solve the multi-objective problem is to transform the multi-objective problem into a single objective problem and solve it by an a priori preference connection method[31].This method uses a weighted combination of each objective function to create a single objective function that contains all the standard information.However,this type of method requires the user to determine the relative importance of each objective before knowing the solution set.Subjective weight settings lead to poor recommendation accuracy and low user satisfaction.Multi-objective optimization based decomposition [32] uses the co-evolution mechanism between subproblems to optimize multi-objective subproblems at the same time.This method can avoid falling into a local optimal solution.Several classical multi-objective evolutionary algorithms are introduced below.
1) Multi-Objective Optimization Based on Decomposition(MOEA/D):MOEA/D [33] is a general evolutionary algorithm framework for processing the multi-objective problem.MOEA/D starts from the initial population of candidate solutions,generates some new candidate solutions in each iteration,and chooses the most appropriate solution for the next iteration.It repeats this process until certain termination conditions are met.MOEA/D decomposes a multi-objective problem into a set of scalar objective subproblems and optimizes these subproblems at the same time.Based on the distance of the subproblem weight vector,the neighborhood relationship between subproblems is defined.New solutions are generated by solution cooperation within the neighborhood.The new solutions only update old solutions within the same neighborhood.Since two adjacent subproblems have similar optimal solutions,the optimization of the subproblem takes advantage of the current information of the adjacent subproblems.
2) Multi-Objective Algorithm Based on Two-Stage Niche Technology (MOEA/D-TPN):Aimed at addressing the problem of uneven distribution of Pareto,[34] extended the MOEA/D framework to overcome this shortcoming by introducing a new two-phase scheme and a niche guidance scheme.The MOEA/D-TPN method divides the whole optimization process into two stages according to the crowding degree of the solution on POF,and helps the population to find points on the boundary of POF in the second stage.When there are multiple disconnected regions in POF.It employs the niche guidance scheme to maintain population diversity.
3) Multi-Objective Algorithm Based on Dominant and Decomposition (MOEA/DD):A unified multi-objective optimization paradigm is proposed in this article [35],which combines the advantage of the decomposition-based method.The purpose of this method is to exploit the merits from both of dominance and decomposition-based approaches to balance the convergence and diversity of the evolutionary process.A set of weight vectors are used to specify several sub-regions in the objective space,and each weight vector also defines a subproblem of fitness evaluation.The parent population is updated in the steady-state scheme,and only one offspring solution is considered at a time.The population is updated in a layering manner,which successively depends on Pareto dominance,local density estimation and scalar function.In addition,in order to further improve population diversity,a second opportunity is provided for the worst solution in the last non-dominated level to prevent association with isolated subregions.
III.MULTI-OBJECTIVE TOURISM ROUTE RECOMMENDATION METHOD BASED ON TWO-STAGE AND PARETO LAYERING
A.Tourism Route Recommendation Processing Steps
The purpose of this paper is to solve the problem of uneven distribution and weak diversity of multi-objective optimization solutions fort ourismroute planning,and we propose a tourism route recommendation method based on the multi objective evolutionary algorithm,namely MOTRR,and its processing step is shown in Fig.1.MOTRR decomposes the multi-objective problem into several subproblems and improves the distribution of solutions through a two-stage method.In the first stage,the crowding degree of the intermediate population is taken as the threshold.If the crowding degree of the marginal population is less than the threshold,it enters the second stage.In the second stage,the inverse scalar subproblem is used to find the boundary solution and optimize the distribution of the solution.The neighborhood is determined according to the weight of the subproblems for crossover mutation.Finally,Pareto layering is used to improve the renewal efficiency and population diversity of the solution.
B.Problem Definitions and Symbols
The essence of the problem solved in this paper is the multi objective route optimal solution.According to the model algorithm,the main related definitions are as follows.
Definition 1:Subproblem.The multi-objective optimization problem is decomposed into a set of scalar objective problems,and each objective problem is called a subproblem.The optimal solution of thei-th subproblem depends on the Pareto optimal set of the initial problem.
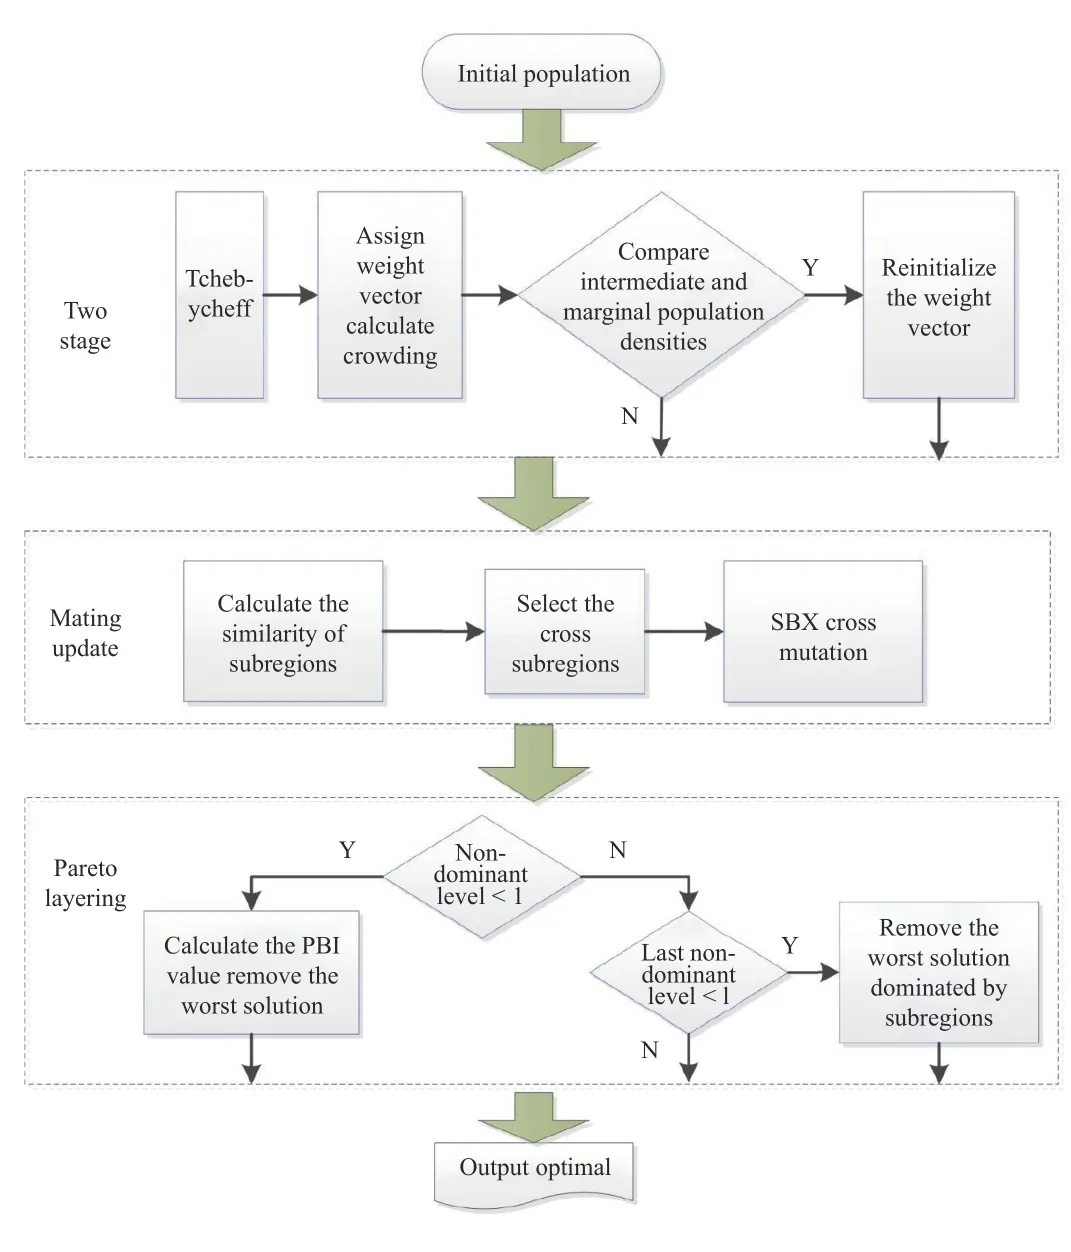
Fig.1.Tourism route recommendation processing steps.
Definition 2:Neighborhood.The neighborhood relationship between subproblems is defined based on the distance of the weight vector of the subproblem.The neighborhood of thei-th subproblem contains the index of similar subproblemj.For example,in adjacent fields,subproblemiis similar to subproblemj.
The problem definitions and symbols are shown in Table I.

TABLE I PROBLEM DEFINITIONS AND SYMBOLS
C.Uniform Distribution Two-Stage Method
There are two main problems with MOEA/D.One is the inhomogeneity of approximate solutions along the convex POF,which has sharp peaks and complex shapes with long tails,where small changes on one objective lead to large gaps on the other.In this case,MOEA/D provides dense solutions in the intermediate region of POF,while it is difficult to get uniform solutions in the extreme region of POF although it provides a consistent set of weight vectors.MOEA/D does not have this defect in concave MOPs (multi-objective problems)[36].Therefore,it is feasible to obtain a uniform solution of a convex MOP by solving the scalar optimization subproblems in a reversed form.
This method divides the whole evolution process into two stages.The two-stage method is conditional.When there are fewer boundary solutions than intermediate solutions in the population,the two-stage method will be activated,which helps the algorithm allocate computing resources to find boundary solutions.
1) Stage 1 — Judge Crowding Degree:The first stage is for MOEA/D to decompose the scalar subproblem using the formula Tchebycheff [37] decomposition method,focusing on convergence and diversity.The density of solutions in the intermediate region and extreme region of POF is evaluated by using the crowding degree.If the crowding degree of the solution in the intermediate region is greater than that in the extreme region,it means that the multi-objective problem may be convex,and it would be more appropriate to use a form of inverse scalar subproblem in the remaining second optimization stage.The crowding degree calculation of the solution of the intermediate region and the extreme region is introduced below.
where Ωλis the set ofNweight vectors.0.5 is adopted because it can achieve classification inW sandW c.
According to the sum of weight subsetsW sandW c,the population can be divided into two sub populations: intermediate populationPcand extreme populationPs.The crowding degree of the two sub populations can be expressed as
whereDcenandDsuis the crowding degree value of the intermediate population and extreme population.κ(i) quantifies the crowding degree of thei-th solution in a sub population,which is defined as follows:
whered(i,j) is the distance between the solutioniandj,B(i)andZis the neighborhood number and neighborhood size of the solutioni.κ(i) measures the approximation of thei-th solution to theZneighborhood solution.
It should be noted that the second stage is an alternative stage,i.e.,if there is little difference betweenDcenandDsu,the second stage can be removed from the evolution process,while the first stage will continue the whole evolution process.
2) Stage 2 — Inverse Scalar Subproblem to Optimize the Extreme Distribution:At the end of the first stage,a crowding-based method is used to assess whether MOEA/D has achieved a set of consistent solutions.The crowding-based method evaluates the decryption of the intermediate and extreme regions of the POF.If the solution of the intermediate region is more dense than that of the extreme region,the POF may be convex,and the inverse scalar subproblem is used in the remaining optimization stages.The lowest point in the second stage formula is constructed by the Pareto optimal solution obtained in the first stage.
wherer∗is the lowest point,which is composed of the worst solution of the whole Pareto optimal solution.
At the beginning of the second stage,the weight vector needs to be reinitialized because the form of the scalar subproblem(i.e.,the search direction) changes.In a sense,the second stage can be regarded as a stage of refining the solutions obtained in the first stage,because the second stage is expected to find a well distributed solution.Therefore,in the second stage,the final population of the first stage is used as the initial population instead of reinitializing the population.In addition,this does not interrupt the evolution process,which is very important for the convergence performance of any MOEAs.
D.Mating Update
Another issue with MOEA/D is that it will produce many similar solutions due to neighborhood crossover and update strategies.Neighborhood crossover is an important component in MOEA/D,and simulated binary crossover (SBX) is used in this paper,which may result in similar solutions in each generation when a MOP has disconnected sub-regions at the POF.Similar solutions result in reduced population diversity,so selection of mating ranges is important for the performance of solution generation.
Next,the similarity function scheme is used to select the crossover/update range.The scheme calculates the number of similarities of each individual to itsTneighbors,but not all members of the population.The number of similarities of each individualiis counted asn(i),which is calculated by summing up the sharing functions of itsTneighbors.
It refers to the distancedi jbetweeniandj,andsmis the sharing function of the similarity betweeniandj.
where γniis the predefined neighborhood distance,andαis a constant [38].
If the similarity of an individual exceeds a given threshold,it indicates that the individual is similar to the adjacentTindividual.Select an individual outside the neighborhood as the crossover parent,otherwise the neighborhood is crossover updated.
E.Pareto Layering
When updating the offspring of the population,only one offspring is considered at a time.If multiple offspring solutions are generated,the update process will be performed multiple times.Therefore,when a new population is introduced into the population,it is time-consuming if all the updates are initialized each time,so this paper will use Pareto layering.
If the resulting solution has only one Pareto layering,the individuals in the offspring will not dominate each other.At this point,we have to look for other measures,such as density estimation and scaling functions,to distinguish the decomposition.Since each solution is associated with a sub-region,we can estimate the density of the sub-region by calculating the number of solutions associated with it.We determine the maximum crowded sub-region,that is,the sub-region with the largest number of neighborhoods.If multiple subareas have the same maximum number of neighborhoods,we will select the subareas with the largest sum of P BI values
whereSis a set of sub-regions with the same maximum neighborhood.Finally,we define the worst solution with the maximum PBI value and remove the worst solutionx′.
If the generated solution exceeds a non-dominated population,the decision process needs to start from the last nondominated layerL.WhenL=1,the density of the sub-region is calculated first,and if there is more than one solution in the sub-region,the worst solution cause is removed if it cannot provide useful information.Otherwise,when there is only one solution in the sub-region,the sub-region is not utilized,and the solution most important to population diversity will be retained.Then,the PBI value of the worst solution in the current non-dominated level will be calculated,and then the worst solution will be removed.WhenL>1 andLcontains more than one solution,the sub-region to which the solution belongs is calculated first.If there is more than one solution in the sub-region,the worst solution with the maximum PBI value is removed.Otherwise,if the sub-region has only one solution,it indicates that the sub-region is independent and should be reserved for the next stage,and the worst solution in the current dominant level should be removed.
F.Algorithm Design
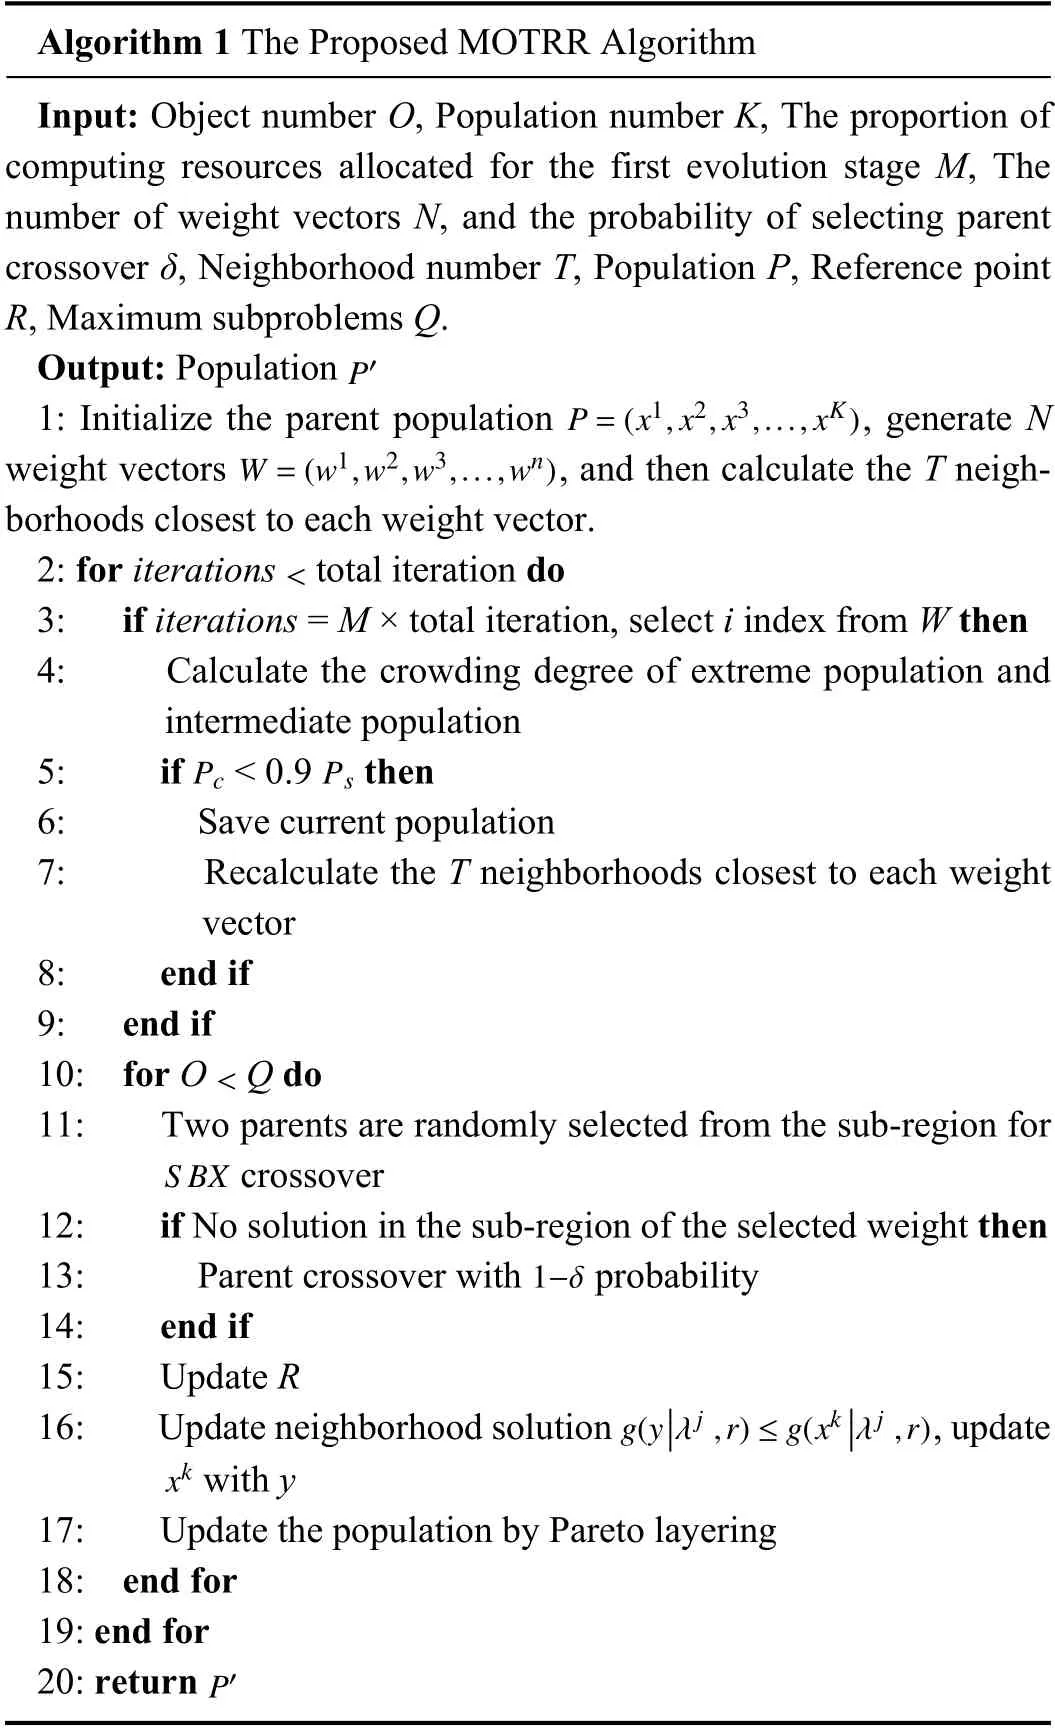
In the proposed algorithm,we use the SBX operator to generate offspring.The process is shown in Algorithm1.Firstly,the initialization process generates the parent population,the number ofTneighborhoods andNweight vectors.When the iteration termination conditions are not met,for each weight vector,the crossover selection program is used to select the parents for the offspring,and then the offspring is used to update the parent population.The detailed process of the algorithm is given below.
1) Initialization.Initial parent populationP,identify nondominated structure ofP,generation of weight vector and distribution of neighborhood.The detailed process is in Step 1.
2) According to the relationship between the density of extreme population and intermediate population,when comparing the crowding degree of the two regions,90% of the intermediate population and extreme population are compared,and the two-stage method is used to optimize the distribution density of extreme population.The detailed process is in Steps 2−9.
3) For the current weight vector,the relevant solution can be selected from adjacent sub-regions.If there is no relevant solution in the selected sub-region,the mating parents are randomly selected from the whole population.This paper usesS BXcrossover.The detailed process is in Steps 10−14.
4) After the generation of offspring,the parent is updated with offspring,and only one offspring is considered at a time.If multiple descendant solutions are generated,the update process will achieve multiple rounds.Determine the non-dominated structure of the solution generated after the crossover mutation of the parent population.When the parent population produces offspring,it does not want all Pareto structures to change.Use the layering structure to update the non-dominated structure of the offspring and remove the worst solution in the sub-region.The detailed process is in Steps 15−20.
The complexity of updating the neighborhood of the population during initialization (Step 1 of Algorithm1) is the squareO(K2) of the population numberK.The complexity of the two-stage method (Steps 2−14 of Algorithm1) is the product of computing resourcesM,weight vectorsN,and number of neighborhoods isO(MNT).The complexity of Pareto layering (Step 17 of Algorithm1) is mainly the complexity of updating the population and the complexity isO(N).The whole updating process complexity (Steps 15−17 of Algorithm1) isO(N).Thus,the complexity of the whole algorithmisO(K2+MNT+N).
IV.EXPERIMENT AND ANALYSIS
A.Experimental Setting
1) Dataset:This paper collects the real data information of 6114 scenic spots,8171 restaurants and 2528 hotels in Beijing before August 2017 from the two famous tourism online social networking sites of Public Comments and Ctrip.After screening,data from 120 scenic spots in Beijing are used as the test dataset [39].The score of scenic spots is processed by the crowd-sensing score,and the result is a weight score including scenic spot location score,social score and public score.The real datasets of the experiment is composed of the comprehensive score of crowd-sensing perception and the cost of scenic spots.
2) Test Function:Test functions F1,F2,F3 and POL are quoted from [34].Each instance has a non concave POF shape.In addition,the experiment also includes the commonly used test function UF4 [35].UF4 is a double-objective function with complex shape.f1 andf2 shown in Table II in each row represent two objection of the test function separately.
3) Benchmark Models:In this paper,we choose four well known methods to compare with our proposed method,and the details are as follows.
i) MOEA/D [33]:The MOEA/D method decomposes a problem into a set of scalar sub objective problems and optimizes these problems at the same time.Starting from the initial population of candidate solutions,MOEA/D method generates some new candidate solutions in each iteration,selects the most suitable solution for the next iteration,and repeats this process until the termination conditions are met.
ii) MOEA/D-TPN [34]:The method adopts a two-stage strategy and divides the whole optimization process into twostages.According to the crowding degree of the solution found in the first stage,the algorithm determines whether fine computing resources are needed to deal with the unresolved subproblems in the second stage.In addition,the niche scheme is introduced to guide the selection of mating parents and avoid repeated solutions.

TABLE II FUNCTION DESCRIPTION
iii) MOEA/DD [35]:The method proposes a unified paradigm,which combines dominance and decomposition based methods for multi-objective optimization,and uses a set of weight vectors to specify several sub-regions in the objective space.In addition,each weight vector also defines a sub problem of fitness evaluation.The parent population is updated in the steady-state scheme,and only one offspring solution is considered at a time.The population is updated in a hierarchical manner,which successively depends on Pareto dominance,local density estimation and the scalar function.
iv) MOEA/D-HP [40]:The method proposes a systematic method to incorporate the decision maker’s preference information into a decomposition-based evolutionary multi-objective optimization algorithm.The preference information (preference point) is decomposed into several scalar optimization problems by a new hierarchical reference point generation method.
v) MOTRR:The method decomposes the multi-objective problem into several subproblems,and improves the distribution of solutions through a two-stage method.The crowding degree mechanismbetween extreme and intermediate populations is used in the two-stage method.The neighborhood is determined according to the weight of the subproblem for crossover mutation.Finally,Pareto layering is used to improve the updating efficiency and population diversity of the solution.The two-stage method is combined with the Pareto layering structure,which not only maintains the distribution and diversity of the algorithm,but also avoids similar solutions.
4) Parameter Setting:We use the WS-trans formation scheme [41] to initialize the vector weight for the crossing mutation between subsequent neighborhoods,and set theMdefault value as 0.5 and γnias 0.005 after some comparative test experiments.The neighborhood default value is set to 20.δis a a randomnumber.The population size in each algorithm is set to 100 for two objective instances.Each algorithm is on a computer configured with an Intel Core 2 dual core processor,1.80 GHz processor and 4 GB memory.The maximum number of iterations of all test instances is set to 500.
5) Performance Metrics:The following two widely used performance metrics are used in our experiments.
i) IGD:The IGD metric can provide reliable information on the diversity and convergence of solutions.LetPbe a group of solutions uniformly sampled from the real POF,andQbe the approximate solution in the objective space.This index measures the gap betweenPandQ.The calculation method is as follows:
IGDevaluates the comprehensive performance of the algorithm by calculating the average value of the minimum distance from the point set on the real Pareto surface to the obtained population.The smaller theIGDvalue is,the better the convergence performance of the algorithm is.
ii) HV:HV metric is the volume of the region in the objective space surrounded by the non-dominated solution set and reference points obtained by the algorithm.The larger theHVvalue is,the better the comprehensive performance of the algorithm is
whereLebis Lebesgue measure.
B.Experimental Comparison
1) Experiments on F1,F2 and F3 Function:F1 and F3 are functions with complex POF shapes like sharps and long tails.The F2 function has several disconnected areas in the POF.Therefore,we use F1,F2 and F3 functions to verify the performance of MOEA/D,MOEA/DD,MOEA/D-TPN,MOEA/D-HP and MOTRR methods under different POF shapes.

Fig.2.Experimental results on the F1,F2 and F3 functions.
The results shown in Fig.2 demonstrate the approximate POF of the solution of MOEA/D,MOEA/DD,MOEA/DTPN,MOEA/D-HP and MOTRR methods in the F1,F2 and F3 test cases.It can be concluded that only a small part of the solutions is found on the POF generated by MOEA/D method under the F1,F2 and F3 functions.The performance of the MOEA/DD,MOEA/D-HP and MOEA/D methods on F1 and F3 functions shows that there are fewer solutions in the long tail region of the extreme and the distribution of solutions is not uniform.The solutions generated by our proposed MOTRR method have the best distribution on the sharp and long tails of POF shape under F1,F3.From the performance of the F2 function,the MOTRR method performs better than MOEA/D method,and the MOTRR method produces more solutions.According to the above comparison,the MOTRR method performs better than the other four methods.The reason is that in the second stage,the weight vector needs to be reinitialized,resulting in the change of search direction,so as to increase the population distribution.
2) Experiments on UF4 Function:UF4 is a concave function.In this case,the proposed two-stage method will not be activated,which helps us focus on the impact of the neighborhood method.In addition,UF4 also has strong variable dependence.Therefore,in order to obtain a good approximation of this problem,the algorithm must be able to maintain population diversity.
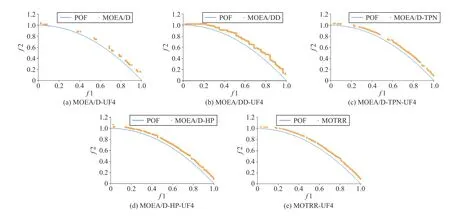
Fig.3.Experimental results on the UF4 function.
The results of Fig.3 demonstrate that the solution distribution obtained by MOEA/D-TPN,MOTRR,MOEA/D-HP and MOEA/DD methods is similar,while the MOEA/DD and MOEA/D-HP methods do not use the two-stage method,and the MOEA/D-TPN and MOTRR methods use the two-stage method.It indicates that in the UF4 test function,the MOEA/D-TPN and MOTRR’s two-stage method were not activated,so the MOEA/DD algorithm generated a better explanation for the neighborhood similarity scheme,thus verifying the effectiveness of the neighborhood method.MOEA/DD,MOEA/D-TPN and MOTRR methods using the neighborhood similarity scheme obtained more solutions and better solution distribution than MOEA/D without the neighborhood strategy.The MOEA/D-HP method also does not use the neighborhood similarity scheme,and the generated solution is discontinuous.Because the neighborhood scheme takes into consideration the similarity of relevant regions,if the similarity of neighborhood sub-regions is high,another subregion is selected for mating,so the diversity of generated solutions is better.
3) Experiments on POL Function:The POL function is discontinuous and has a long tail,which can simulate a discontinuous POF shape.This function is used to test the distribution and diversity of POF solutions.
The results of Fig.4 demonstrate that the MOEA/D,MOEA/D-TPN,MOEA/D-HP and MOTRR methods converge to the POF.The solution distribution of the MOEA/D,MOEA/D-TPN and MOEA/D-HP methods in the extreme region is more scattered,because the three algorithms do not use Pareto layering structure.Their worst solution of the corresponding level is continued.The distribution and diversity of solutions generated are poor,while the MOTRR method uses Pareto layering to delete the worst solution in the region where the current solution is located and reserves a high-quality solution for the next generation,resulting in better solution distribution.Therefore,the effectiveness of the Pareto layering structure can be verified.
4) Experimental Results on IGD and HV :TheIGDvalue can verify the distribution of the algorithm.The smaller theIGDvalue is,the better the effect is.The percentage refers to the grow th rate of MOTRR compared with other algorithms.The percentage refers to the reduction rate of the algorithm results compared with other algorithms.The smaller the percentage is,the better MOTRR is compared to other algorithms.The better performance values have been bolded in black,and the specific values are shown in Table III.
TheHVvalue can verify the diversity of the algorithm,where the greater theHVvalue is,the better the diversity is.The percentage refers to the grow th rate of the MOTRR method compared with other methods.Compared with other algorithms,the larger the percentage,the better the MOTRR method.The best performance values have been bolded in black,and the specific values are shown in Table IV.
Tables III and IV show the results forIGDandHVindicators.Best,Worst and Median in each cell of Table III and Table IV represent the maximum,minimum and median ofIGDandHVindicators separately.The smallerIGDis,the better the convergence is.The largerHVis,the better function diversity is.9 of the 15IGDresults of MOTRR method are smaller than MOEA/D,MOEA/DD,MOEA/D-HP and MOEA/D-TPN methods,indicating that our proposed MOTRR method has good convergence.12 of the 15HVvalues of MOTRR method are greater than the other four algorithms,indicating that MOTRR method has better convergence than MOEA/D,MOEA/DD,MOEA/D-HP and MOEA/D-TPN methods.The reason for the smallIGDvalue is that in the two-stage method,the value of the extreme region is optimized to make the generated solution distribution better.The reason for the good performance of theHVvalue is that in the crossover mutation stage,we use the subregions with low similarity for crossover mutation.Thus,the diversity of generated solutions is better.

Fig.4.Experimental results on the POL function.
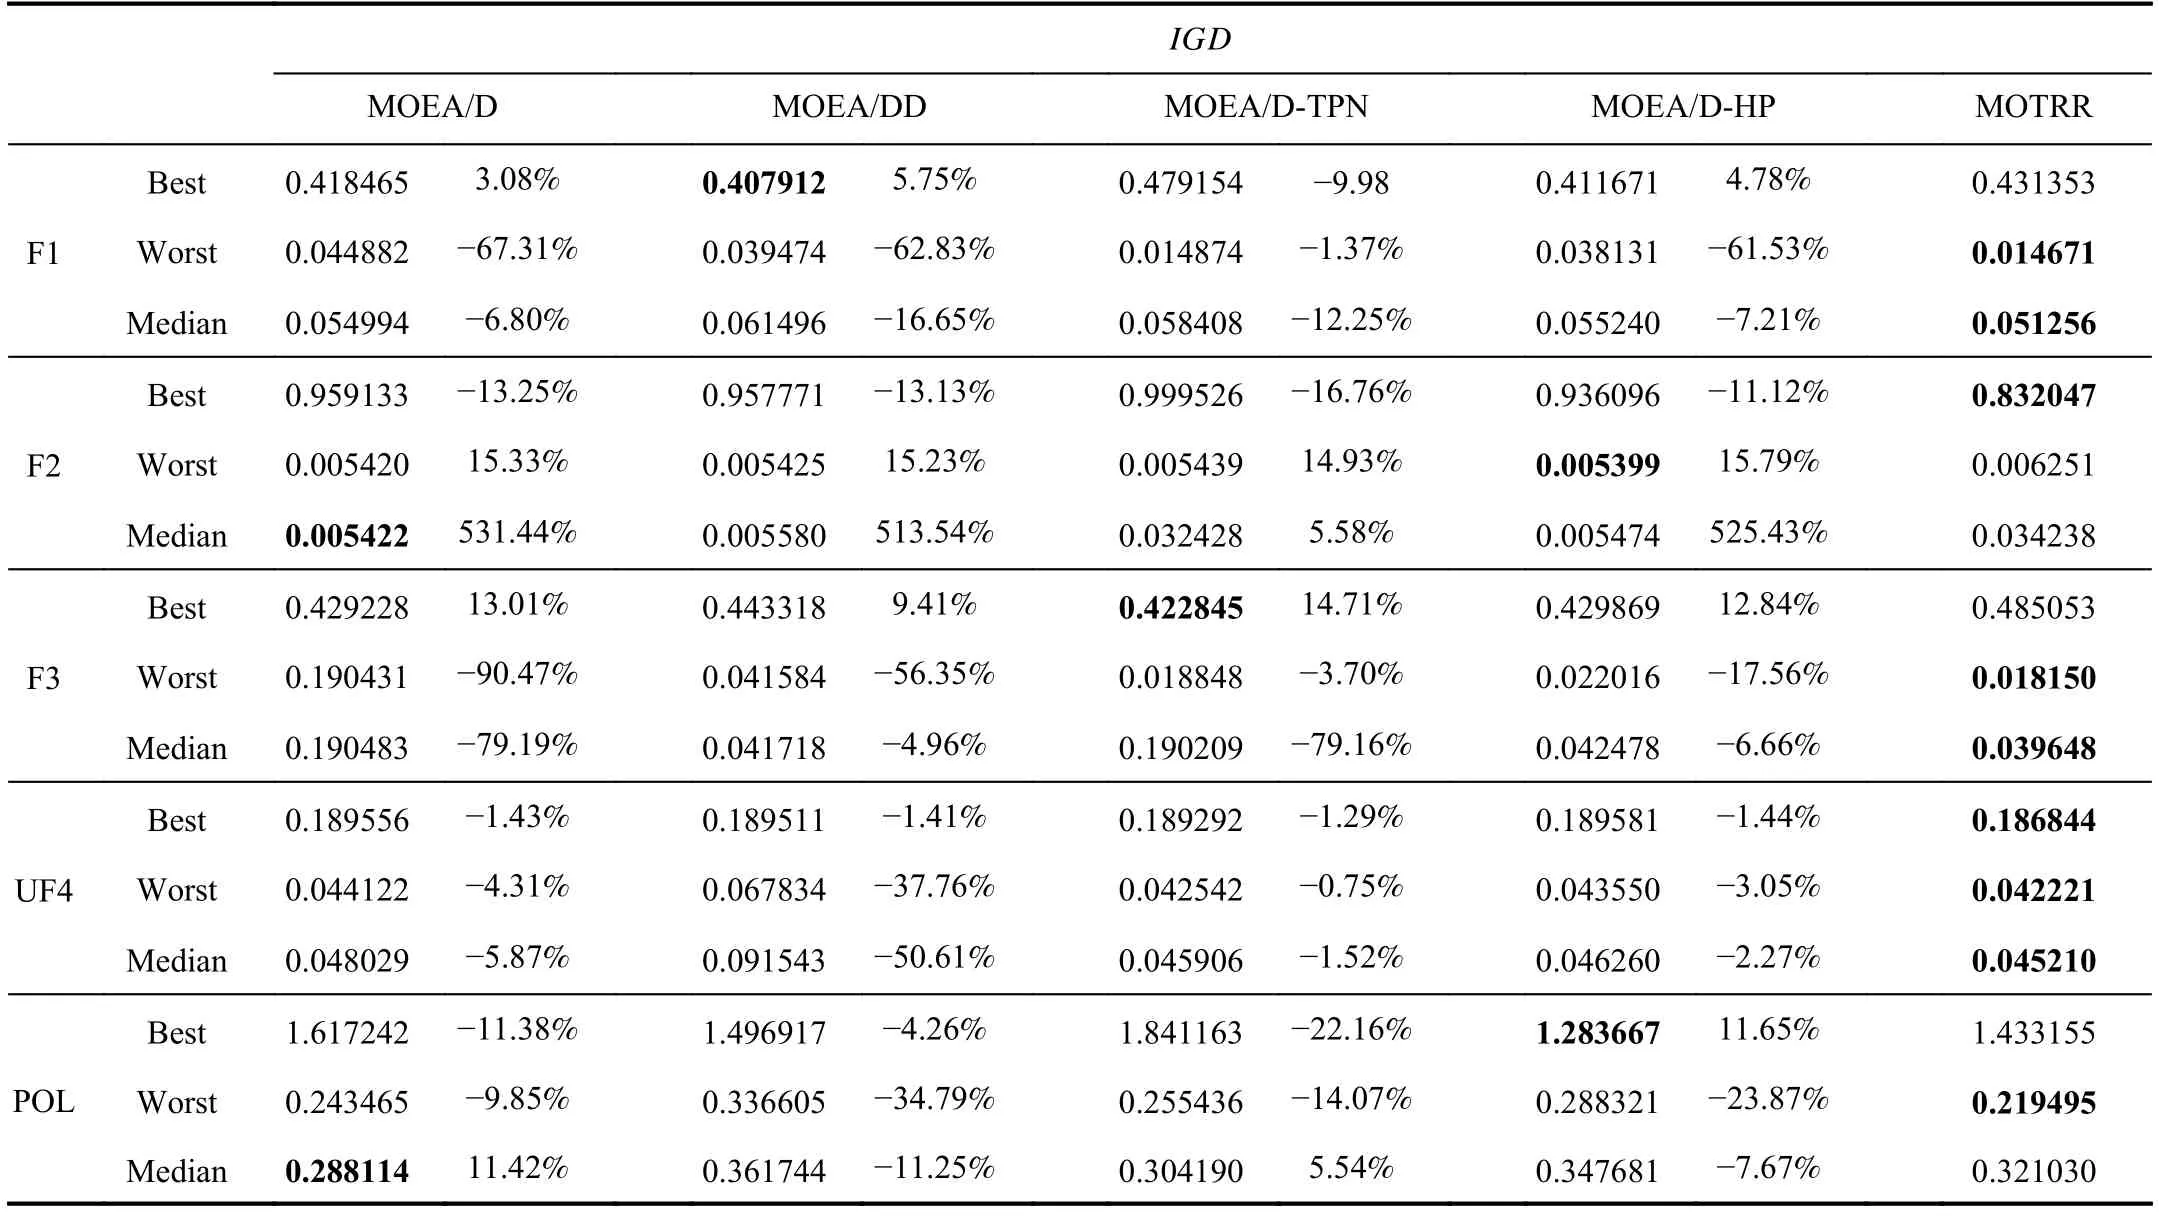
TABLE III IGD VALUES
5) Ablation Studies:In this Section,we conduct ablation experiments with the Pareto layering structure and two-stage method.As shown in Table V,wherePLrepresents Pareto layering,TSrepresents the two-stage method,PL+TSrepresents the combination of Pareto layering and two-stage method in MOTRR.11 of the 15IGDresults of the MOTRR method are smaller thanTSandPL,10 of the 15HVresults of the MOTRR method are greater thanTSandPL.From the ablation experimental results,it can be seen that the Paretolayering and the two-stage methods improve our proposed method.The effectiveness of the MOTRR method can be verified from the above comparison results.
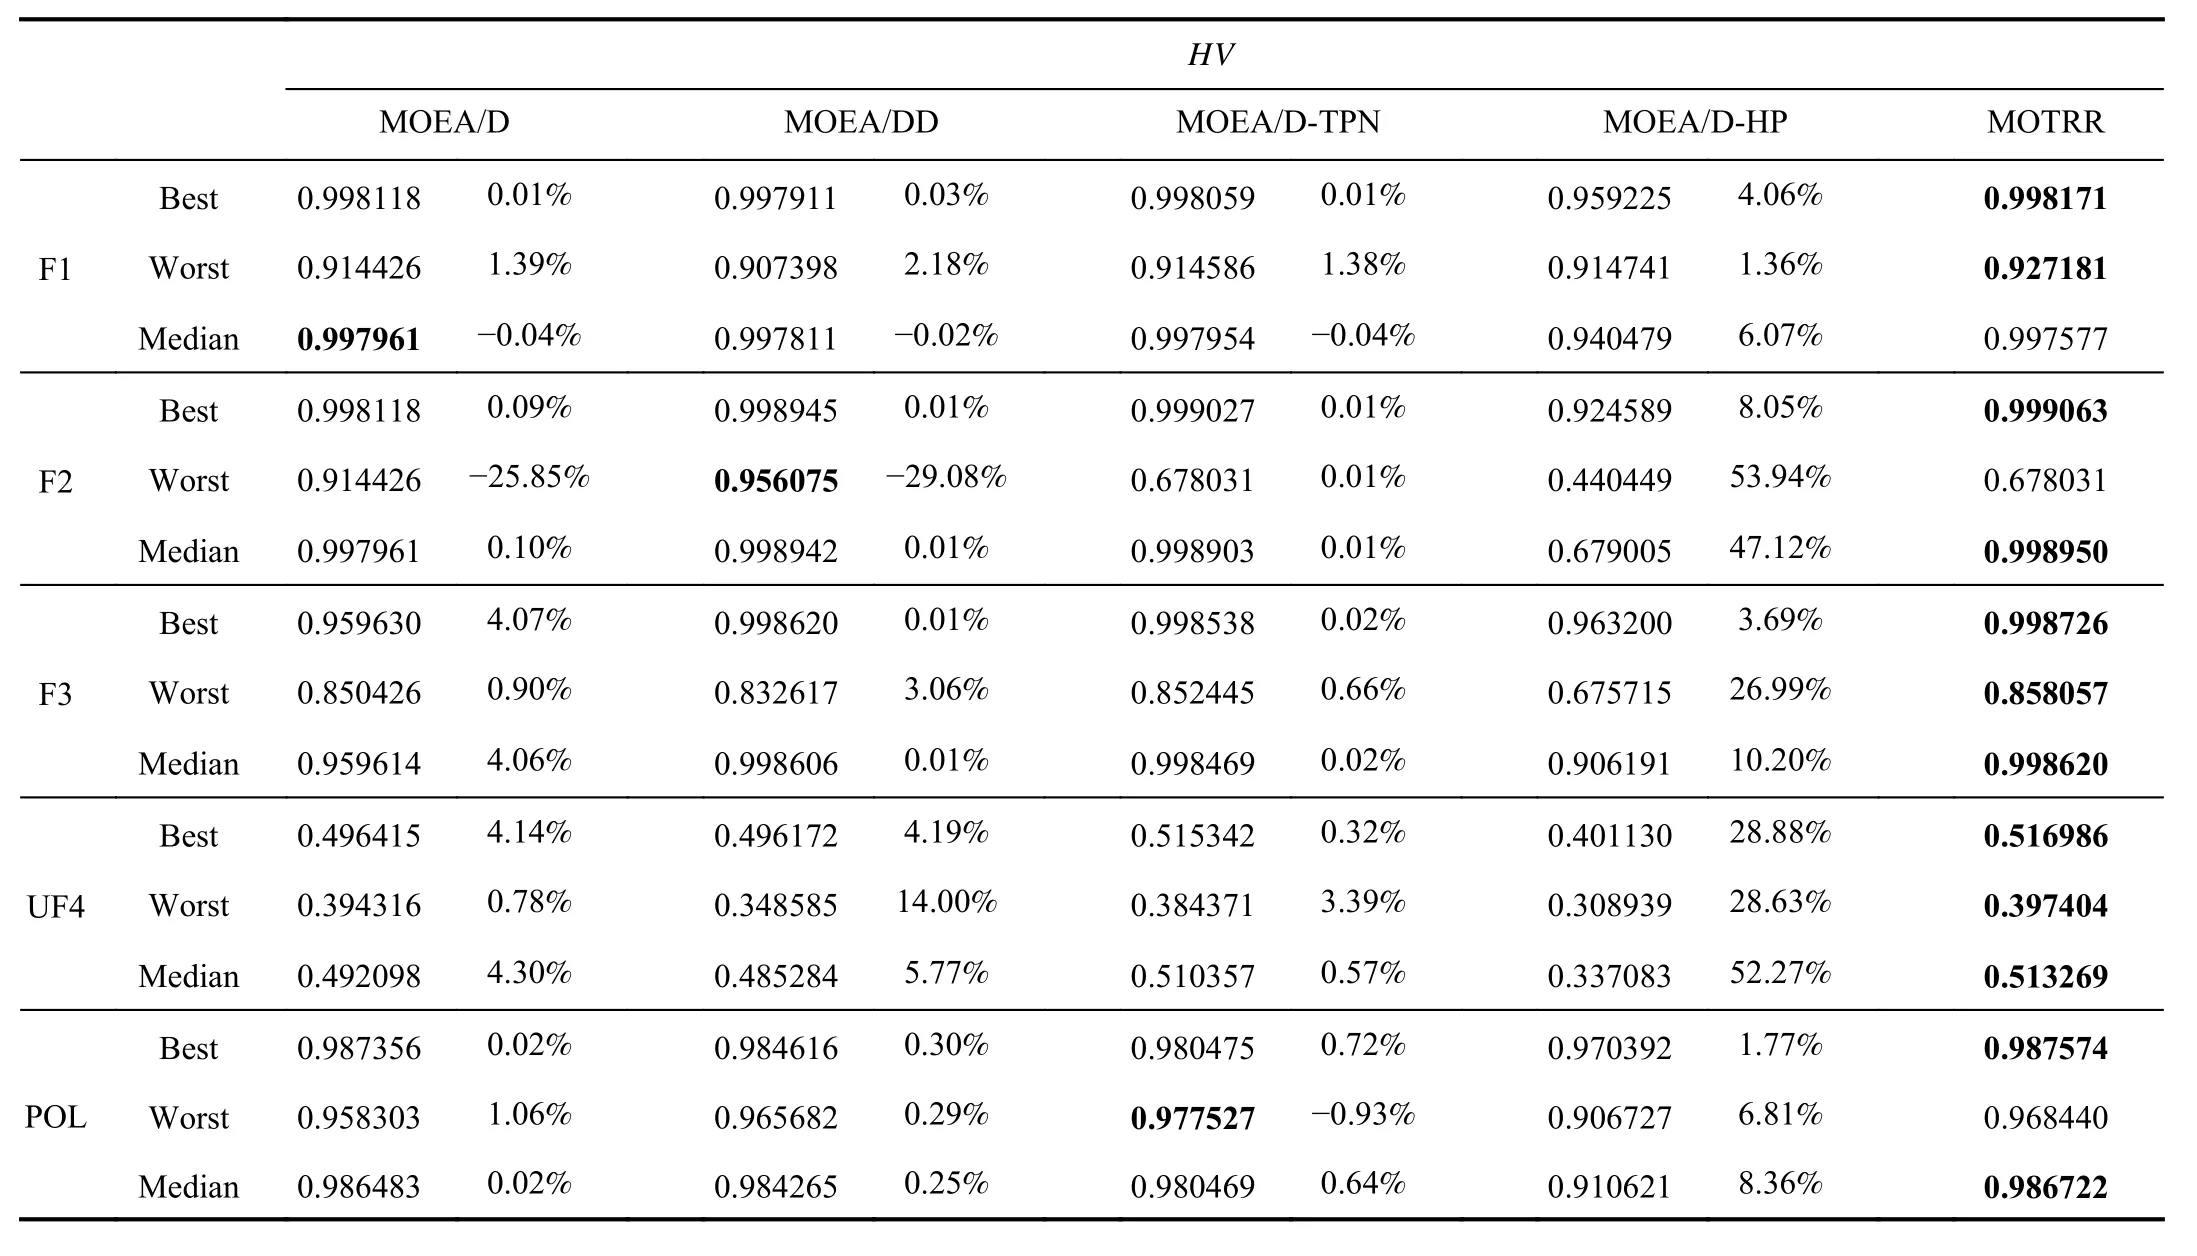
TABLE IV HV VALUES
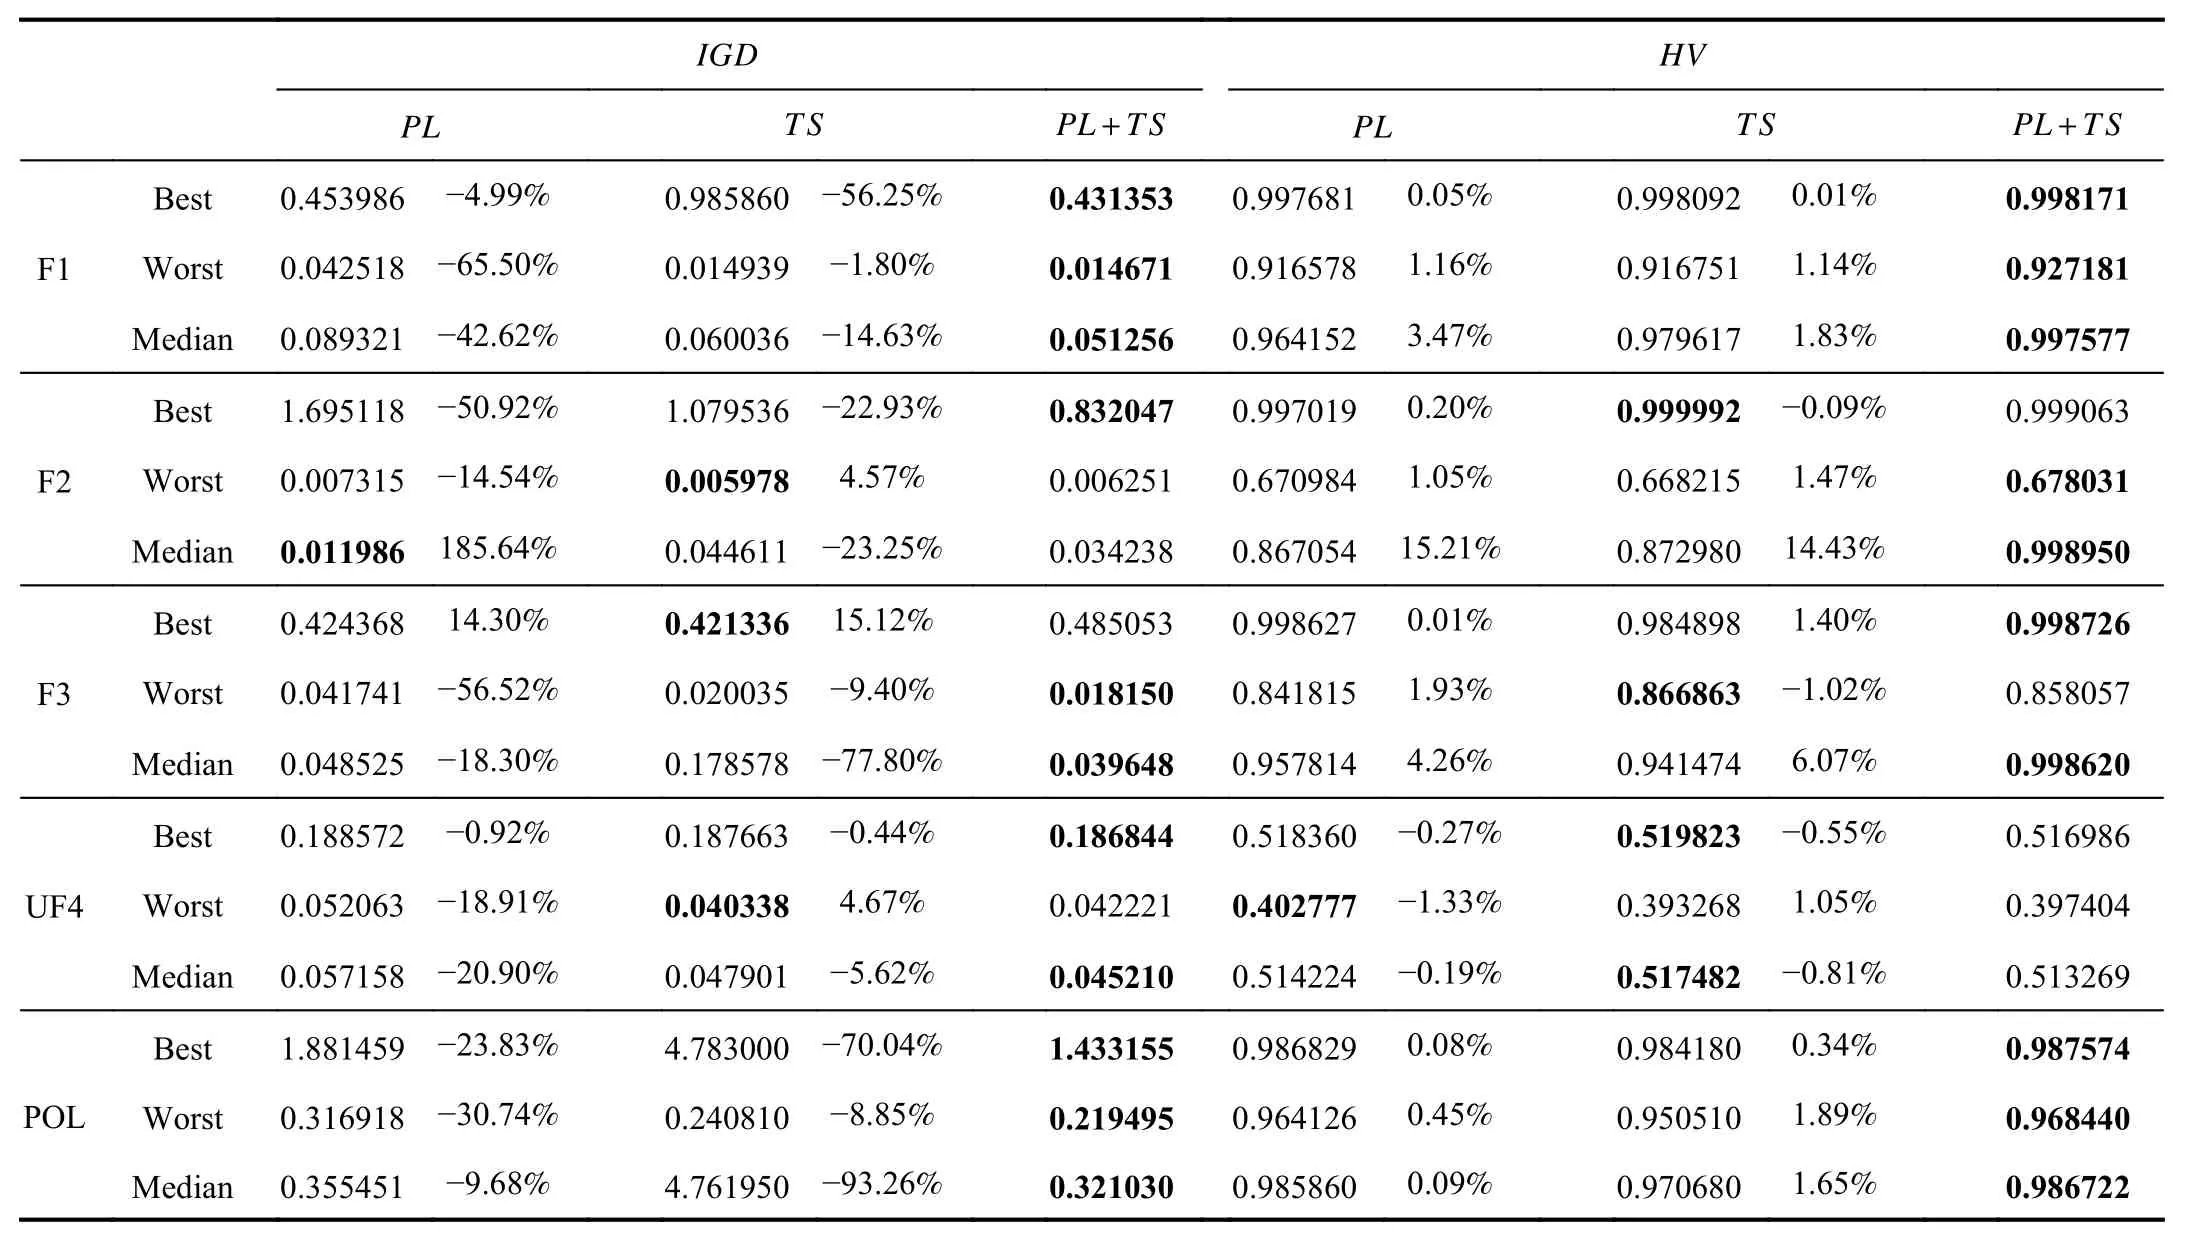
TABLE V IGD HV AND VALUES
C.Experimental Comparison on Real Datasets
1) Pareto Distribution: f1 andf2 shown in the Fig.5 represent the cost objective and crowd-sensing objective separately.In the case of the real dataset,the MOEA/D method used neither the two-stage method nor Pareto layering,and the solutions generated were scattered and on the extreme during fitting.The MOEA/D-HP method generated fewer points i.e.,only three points.Although MOEA/D/-TPN uses a two-stage method,the number produced is small and the distribution is uneven during fitting.The MOEA/DD method used the Pareto layering structure to produce many points,but the points were too scattered and did not tend to the POF.The distribution of the solution generated by the MOTRR method during fitting still converges to the POF.Although the number of solutions is small,the overall distribution is still uniform.Because the extreme solution is optimized when using the two-stage method,and the worst solution is removed when using the Pareto layering structure.The MOTRR method performs better and verifies the effectiveness of the two-stage method and Pareto layering on real datasets.
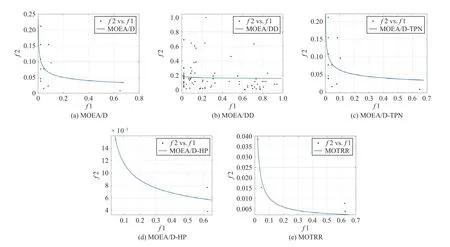
Fig.5.Real datasets.
2) Running Time:Fig.6 shows the running time of five methods in ms,in which red represents the running time of MOTRR method.Because the preference information is decomposed into several scalar optimization problems in the MOEA/D-HP method,the complexity of the algorithm is increased.Our proposed MOTRR method combines the twostage method and Pareto layering structure,the running time of MOTRR method is approximately equal to the sum of the running time of MOEA/DD and the running time of MOEA/D-TPN.

Fig.6.Running time.
3) Route Simulation in ArcGIS:In this experiment,we use ArcGIS to simulate the real tourism route recommendation scenes.The above four comparative methods are selected to realize the generation of routing routes in accordance with Pareto distribution.The route starts from the Beijing Train Station and ends at Beijing West Railway Station.In Fig.7(a),scenic spots generated by the MOEA/D method is discontinuous and the generated routes are repeated,the round-trip distance and time between arriving at scenic spot 6 after passing scenic spot 3 and returning to the terminal are long.In Fig.7(b),the distance between scenic spots generated by the MOEA/D method is too far,and the route is not smooth enough,and the round trip is repeated,which will increase the travel distance and time.In Fig.7(c),the number of scenic spots in MOEA/D-TPN method is too small to meet the needs of users with high scores of tourist attractions.In Fig.7(d),the number of scenic spots generated by the MOEA/D-HP method is small.In Fig.7(e),scenic spots in the route generated by MOTRR method are concentrated and the order of scenic spots is reasonable.Because the solutions generated by the MOTRR method are more in line with Pareto distribution,while the solutions generated by the other four methods have difficulty in meeting the requirements of Pareto distribution,MOTRR method can better meet the multi-objective travel needs of users.

Fig.7.ArcGIS route simulation.
V.SUMMARY
Tourismroute recommendation involves many factors,and the set of object by users often conflict with each other,it is a typical multi-objective optimization problem.Aimed at the multi-objective optimization problem for tourism routes,the MOTRR method is proposed in this paper.We use a set of weight vectors to specify several sub-regions in the objective space.In terms of solution distribution,we adopt a two-stage method to divide the whole optimization process into two stages.The algorithm decomposes the multi-objective problem into several subproblems,and improves the distribution of solutions through a two-stage method.The crowding degree mechanism between extreme and intermediate populations is used in the two-stage method.The neighborhood is determined according to the weight of the subproblem for crossover mutation.Finally,Pareto layering is used to improve the updating efficiency and population diversity of the solution.Combining the two-stage method with Pareto layering structure,the distribution and diversity of the MOTRR method can be improved and the same solutions can be avoided.The MOTRR method is applied to tourism route recommendation and can optimize the diversity and distribution of recommended routes.Moreover,the generated solution can better meet the personalized needs of tourists.
杂志排行
IEEE/CAA Journal of Automatica Sinica的其它文章
- A Survey on Negative Transfer
- Three-Way Behavioral Decision Making With Hesitant Fuzzy Information Systems:Survey and Challenges
- Data-Driven Control of Distributed Event-Triggered Network Systems
- Driver Intent Prediction and Collision Avoidance With Barrier Functions
- Distributed Nash Equilibrium Seeking for General Networked Games With Bounded Disturbances
- Position Measurement Based Slave Torque Feedback Control for Teleoperation Systems With Time-Varying Communication Delays
