实验室条件下不同盐度水体去分层试验
2023-01-16韩宇宁李乐洲
张 琨,韩宇宁,李乐洲,周 玮
实验室条件下不同盐度水体去分层试验
张 琨1,韩宇宁1,李乐洲2,周 玮2※
(1. 大连海洋大学海洋与土木工程学院,大连 116021;2.大连海洋大学水产与生命学院,大连 116021)
水产养殖中水体分层在水中形成屏障,阻碍质量和能量交换,进而导致水质恶化,影响水体中生物的生长。针对此问题,该研究在实验室条件下对玻璃水槽中2种不同盐度水体(淡水和4% NaCl溶液)染色,仅依靠浮力作用,观测水体去分层过程的准备、起动、混合和均匀4个阶段;在压力差的驱动下,形成“上升流”式的上涌对流,发现流体上浮至分层界面发生混合并使跃层增厚,最终引起分层水体失稳破坏。依据试验结果总结出水体分层破坏过程分为准备、起动、混合和均匀4个阶段,在给定工况下,100 L/h输水流量混合作用最强且完全混合的时间最短,25 L/h输水流量混合作用最弱且完全混合的时间最长。该文发现在一定盐度差异下,水体去分层起动时间和完全混合时间的变化规律对水产养殖产业有促进作用。
环境;养殖;水质;水体去分层;盐度分布;混合时间
0 引 言
水产养殖工程中,自然界的水体分层是困扰生产者的一大难题。水体分层是指天然水体随深度的增加而呈现密度变化的现象,分层的发生通常引起环境的破坏、经济的损失、安全的隐患[1]。研究发现在湖泊、水库、富营养化水塘等水域中,在盛夏季节出现明显分层,热力学分层效应会阻碍表层和底层水体间物质交换,形成难以控制的水华,严重危害湖水环境及人类用水安全[2-3]。海水分层还会引起“海水断崖”,使潜艇失去控制,如1963年的“长尾鲨”号核潜艇失事[4]。此外,养殖池塘中的水体分层,常常造成重大的生产损失,养虾池水分层引起底热导致虾病爆发[5]。因此,自然界中的水体分层是亟待解决的环境问题之一。
水体分层形成的主要原因是对流不畅,无法打破各层之间的密度差异[6-7]。水体分层会在水中形成一种类似“屏障”作用,阻碍水体质量和能量交换,进而引起水质恶化[8]。因此,为了保证水体品质、环境和谐,必须对分层的水体进行破坏、消除。水体去分层,即强制干预密度不均的水体充分混合为密度均一的水体[9-10],途径通常分为三类:1)遮光降低表层水温,缩小水体温差而达到混合,但其效果较差且人为遮光成本较高。2)风力扰动强制分层水体发生混合,但极易受环境因素制约。3)通过人为充气、搅水等手段强化水体对流作用,是目前的主流人工去分层技术。
随着海洋学的发展,“上升流去分层技术”逐渐走入人们视野。机理是将分层水体中的低密度水送至高密度水中,借助浮力作用无需额外的动力源,即可形成上升对流,实现混合水体的目的,理论上可以突破水体深度的限制[11-12]。世界著名的“秘鲁渔场”就是上升流混合水体去分层的代表,沿岸强大的秘鲁寒流在东南信风的吹拂下形成上升流,底层冷水携带大量营养物与表层水混合,消除了海洋跃层的同时为鱼类繁殖、生长提供了良好的生存条件[13]。Tsubaki等[14]在解决海洋跃层问题时提出,根据“盐指”现象(分层界面处,高温、高盐的水向下呈指状分布)在海洋中插入竖管并提供初始的管涌作用,就可依靠上升流消除海洋跃层,能量消耗低且环保,但该方法作用较为局限。
池塘分层具有短期性、间歇性、局部性等特点,因而在实验室条件下采用替代溶液并添加染色示踪剂是观察流体运动过程的最直接、最有效的手段。本试验用淡水-氯化钠溶液制造盐度分层,采用彩液示踪法,选取高锰酸钾溶液作为示踪剂将上层淡水染色。在外界作用下,强制向下层水体输送染色淡水,观察记录水体的运动状态及分层水体失稳过程,探究强制对流去分层的机理。
1 材料与方法
1.1 系统设置
试验材料选取亚克力管1根(长55 cm、内径2.5 cm),亚克力连通器1个(管内径2 cm、入水口管长13 cm、出水口管长19 cm),分流器1个(4孔分流、内径4 mm),塑料软管4根(长2 m、内径4 mm)、塑料薄膜若干(长200 cm、宽200 cm),精制盐若干(GB/T5461),高锰酸钾粉末若干(KMnO4化学纯度≥99%),自来水若干。
玻璃水槽1个(长113 cm、宽32 cm、深48 cm),标本瓶1个(内径17 cm、高20 cm),小型潜水泵1台(8 W功率),摄像机1台(红米note8 pro),白光灯带1条(长2 m,24 W功率),自吸泵2台(220 W功率),YSI 1台(ProPlus),塑料桶2个(容量300 L)。
增加盐度在线监测系统,包括盐度传感器5支(0~7%盐度测量范围、准确度±1、分辨率1 s),盐度控制器5台(0~7%盐度测量范围、确度±1、分辨率1 s)。盐度传感器分别垂直、等间距设置在试验水槽后壁中轴线0、10、20、30、40 cm处,监测各水层盐度变化数据并传输至盐度控制器。
同等温度条件下300 L塑料桶中将40 g高锰酸钾加入200 L自来水中配制成1:5 000的KMnO4溶液,将8 kg精制盐加入200 L自来水中配制成盐度4%NaCl溶液,两种溶液分别充分搅拌。
1.2 试验方法
试验系统由玻璃水槽、回水收集槽、回水部分组成。回水收集槽由标本瓶组成,水平位置上沿与试验水槽一致;注水部分由小型潜水泵、分流器、塑料软管、亚克力管构成,工作时小型潜水泵在回水收集槽抽水经分流器、塑料软管输送到试验水槽预定水层;回水部分由亚克力连通器构成,入水口位于实验水槽表层,出水口位于回水水槽底层,工作时通过虹吸作用保持试验水槽水位稳定。
在回水收集槽中加入染色水体(1∶5 000 KMnO4溶液),用亚克力连通器与试验水槽建立虹吸关系。高锰酸钾溶液用于染色上层水体分层,NaCl溶液属于透明盐水分层。试验所用注水部分为1根塑料软管,供水流量分别为25 L/h、50 L/h、75 L/h、100 L/h;亚克力管出水口设置于实验水槽水平中心处、垂直试验水槽底部,距底1 cm处。
用水泵将盐水层(4% NaCl溶液)吸入试验水槽至20 cm处;然后用塑料薄膜覆盖;再用水泵将淡水层(1∶5 000 KMnO4溶液)吸入塑料薄膜上方,至40 cm处;最后从一侧将塑料薄膜缓慢拉出。此时,水槽20 cm以下为无色透明的盐水层,20~40 cm为紫红色清水层。
试验装置如图1所示。在距离水槽2 m处的中轴线位置处放置摄像机,先开启录像,后接通潜水泵电源,完整记录试验过程。实验过程中通过水层界面颜色观察记录水体波动、混合过程及相关现象。
2 去分层现象观测
通过输水管向水槽底层输送清水形成垂直方向对流方式的混合作用,图2用染色的方法记录了在流量为25 L/h的静压力条件下,垂直对流混合的去分层过程,图中水色的浸染反映了混合过程中水体的运动状态,水色的深浅则反映了表底层水体混合程度。从稳定分层开始到水体混合均匀,混合过程可分为准备阶段、起动阶段、混合阶段、混匀阶段。
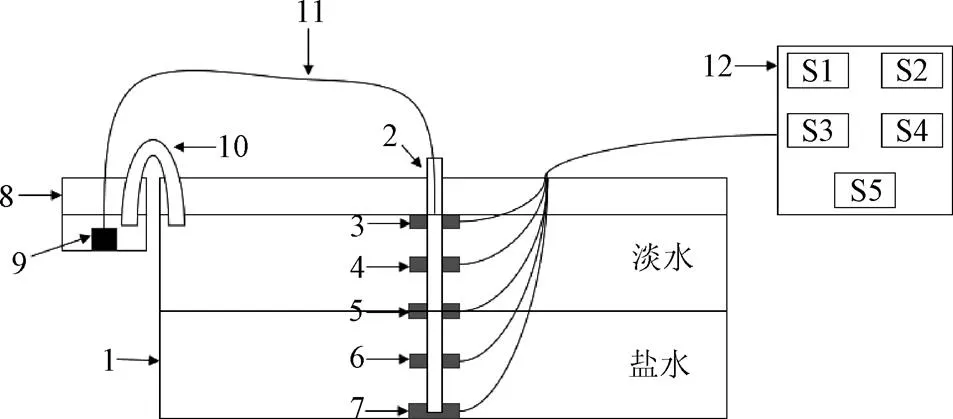
1.试验水槽;2.亚克力管;3.盐度传感器S1;4.盐度传感器S2;5.盐度传感器S3;6.盐度传感器S4;7.盐度传感器S5;8.标本瓶;9.小型潜水泵;10.连通器;11.塑料软管;12.盐度控制器
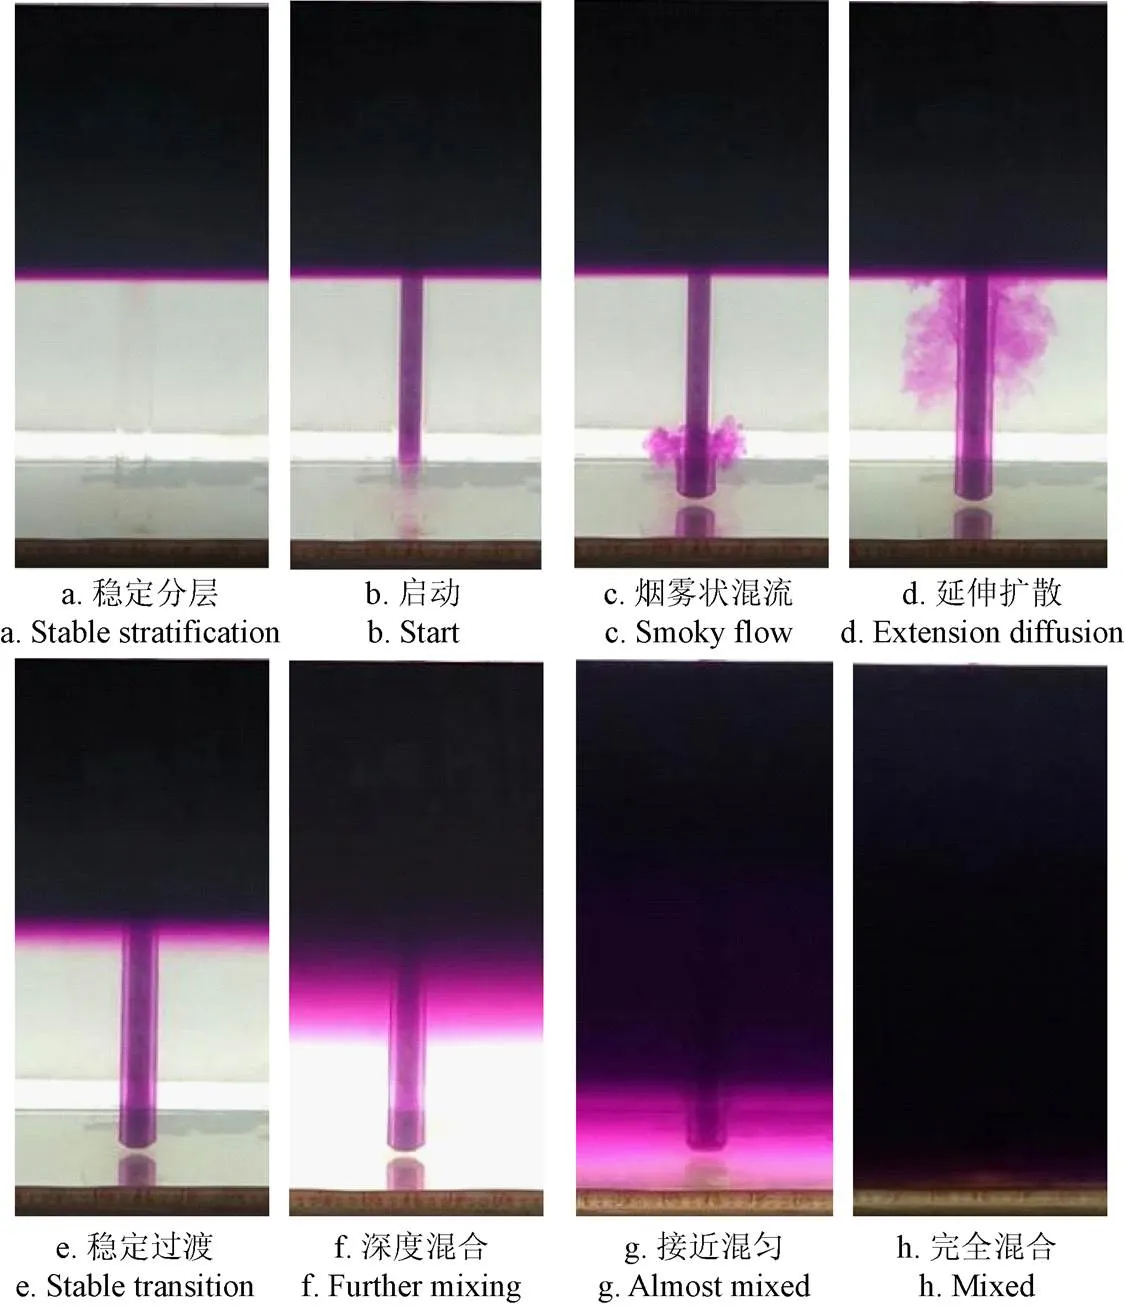
图2 去分层现象全过程
准备阶段:试验开始,输水管垂直于水平面,贯穿水槽内分层水体(上层红色清水,下层无色盐水),输水管内外的分层水体(水色)保持一致(见图2a)。随着输水管上端注入清水(红色),输水管内外的分层水体(水色)发生变化,输水管内的分层水体(水色)界面发生下移,直到分层水体(红色)界面位于输水管下端开口处,此时输水管内充满清水(红色),但未溢出(见图2b)。

起动阶段:随着输水管上端继续注入淡水(红色),输水管内的淡水(红色)开始从输水管下端开口处溢出,溢出的淡水(红色)立刻与高盐水(无色)混合,呈烟雾状态沿垂直和水平两个方向同时扩散。垂直方向上,淡水(红色)从输水管下端开口处开始,围绕输水管壁外侧栩栩上升;水平方向,淡水(红色)从输水管下端开口处开始,围绕输水管以同心圆的形式呈烟雾状向周围扩散(见图2c)。当烟雾状的混合水体上升到中层水槽水体分层界面(上层红色淡水,下层无色盐水)时,垂直方向上停止扩散,继续维持水平方向扩散继,直到覆盖水槽水体分层界面(见图2d)。
图2c中形成垂直方向上浮水,这与Walsh等[18-20]等试验模拟的上升流相同。分析上升流形成的原因在于管口垂直向下,溢出的淡水重力远小于周围盐水浮力,在浮力的作用下产生向上的加速度,这与Middleton等[21-23]等学者报道流体在密度差环境下形成上升流的原因一致,因而形成图2c中垂直方向上升的红色水团。其次,由牛顿第二定律可知,红色水团上浮做加速直线运动,随着流速加快,水团会由规则的层流状态变为紊流状态[20],由于紊流流动具有随机性,红色水团无规则流动,因此,上浮呈现出图2c“烟雾状”。另外,上浮水达到中层界面时,由于上层为淡水,下层为盐水,造成上浮水在液面处停止上升,也无法向下流动,Stacey等[24-25]也在试验研究中证实分层的存在明显阻碍水流上下运动,因此上浮水只能在水平界面方向上继续延伸扩散,如图2d所示。
混合阶段:当烟雾状的混合水体沿水平方向扩散至覆盖水槽水体分层界面(上层红色淡水,下层无色盐水)时,水槽水体分层界面开始出现混合水体形成的过渡区域(红色烟雾状)(见图2e)。随着输水管上端淡水(红色)的继续注入,混合水体的垂直和水平不断扩散,水槽水体分层界面混合水体形成的过渡区域(红色烟雾状)向下扩散的同时厚度不断增加,过渡区域(红色烟雾状)呈现自上而下红色逐渐变浅的现象(见图2f)。
图2e中形成明显的过渡带,这与海洋中的温跃层(变温层)类似[26],Maxworthy等[27-28]学者在试验研究中将这种现象定义为分层过渡区。随着试验的进行,上浮水团不断水平扩散后堆积,造成跃层的厚度()逐渐增厚,结合浮力强度[25]公式(1)分析,浮力频率越小,跃层强度越弱,即跃层越不稳定。因此,跃层厚度从试验开始(约0 cm)不断增厚(图2f),混合阶段内越来越小,跃层变得越来越不稳定。
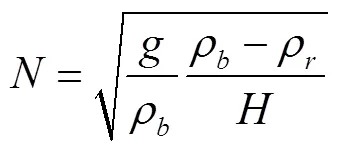
式中是重力加速度,取9.8 m/s2;ρ为跃层上边界密度,近似为1.0×103kg/m3;ρ为跃层下边界密度,近似为1.029×103kg/m3;为跃层厚度,cm。
混匀阶段:随着过渡区域(红色烟雾状)的不断增厚并下沉,仍然可见过渡区域明显的自上而下红色逐渐变浅的现象(见图2g),直到达到水槽水体的底层开始,过渡区域(红色烟雾状)明显的自上而下红色逐渐变浅的现象开始减弱,最终过渡区域(红色烟雾状)消失,水槽水体全部呈现一致的颜色(见图2h)。
该阶段是混合阶段的延续,过渡区域逐渐向下增厚直至达到下端开口高度处,该阶段过渡区域内相邻水层密度逐渐趋于一致,因此,表现出水色逐渐均匀、分层彻底消失的现象。另外,当中层与底层水体密度接近时,上浮的淡水只得不断堆积于中层以上,以此类推直至表层完全混匀,但受限于上层淡水染色,无法观察到混合过程,后期可通过盐度在线监测数据反映混匀程度。
消除水体分层的手段,其本质均是水体对流作用所引起的传质现象,不同的对流方式所产生的去分层混合过程也有差异[29-31]。本试验在稳定的分层水体中向盐水(高密度)区输送淡水(低密度),在压力差的作用下,形成“上升流”式的上涌对流作用[32-33],上升流可以促进不同水层的水体交换[34],流体上浮至分层界面发生混合并使得跃层增厚,最终造成分层水体失稳破坏。
3 结果与分析
3.1 流量对水层盐度分布的影响
图3显示了输水管向水槽底层输送不同流量的淡水时,5组在线监测传感器记录的表层、次表层、中层、次底层、底层盐度变化过程。由试验数据比较可知,输水流量对槽内水体的去分层作用有明显的影响:100 L/h流量混合作用最强,完全混合的时间最短,25 L/h流量混合作用最弱,完全混合的时间最长。
3.2 流量对水层起动和混合时间的影响
根据图3的4组流量下各水层(除中层外)起动的观测时间数据做图4a,显示了静压力下各组垂直对流引发水体启动混合作用的层次顺序均为:次底层、底层、次表层、表层;调用传感器存储的大数据,拟合输水量各水层启动混合影响的幂函数曲线关系式如下:
()次底层=(2.82 ± 0.19) + (81.33 ± 10.55)×
(0.93 ± 0.01)R2=0.999 62 (2)
()底层=(9.67 ± 0.92) + (459.78 ± 150.44)×
(0.91 ± 0.01)R2=0.999 09 (3)
()次表层=(11.28 ± 1.02) + (169.18 ± 14.47)×
(0.95 ± 0.00)R2=0.999 47 (4)
()表层=(23.63±2.27)+(299.03±23.47)×
(0.96 ± 0.00)R2=0.999 44 (5)
式中()代表混合时间,min;代表流量,L/h;2代表决定系数。
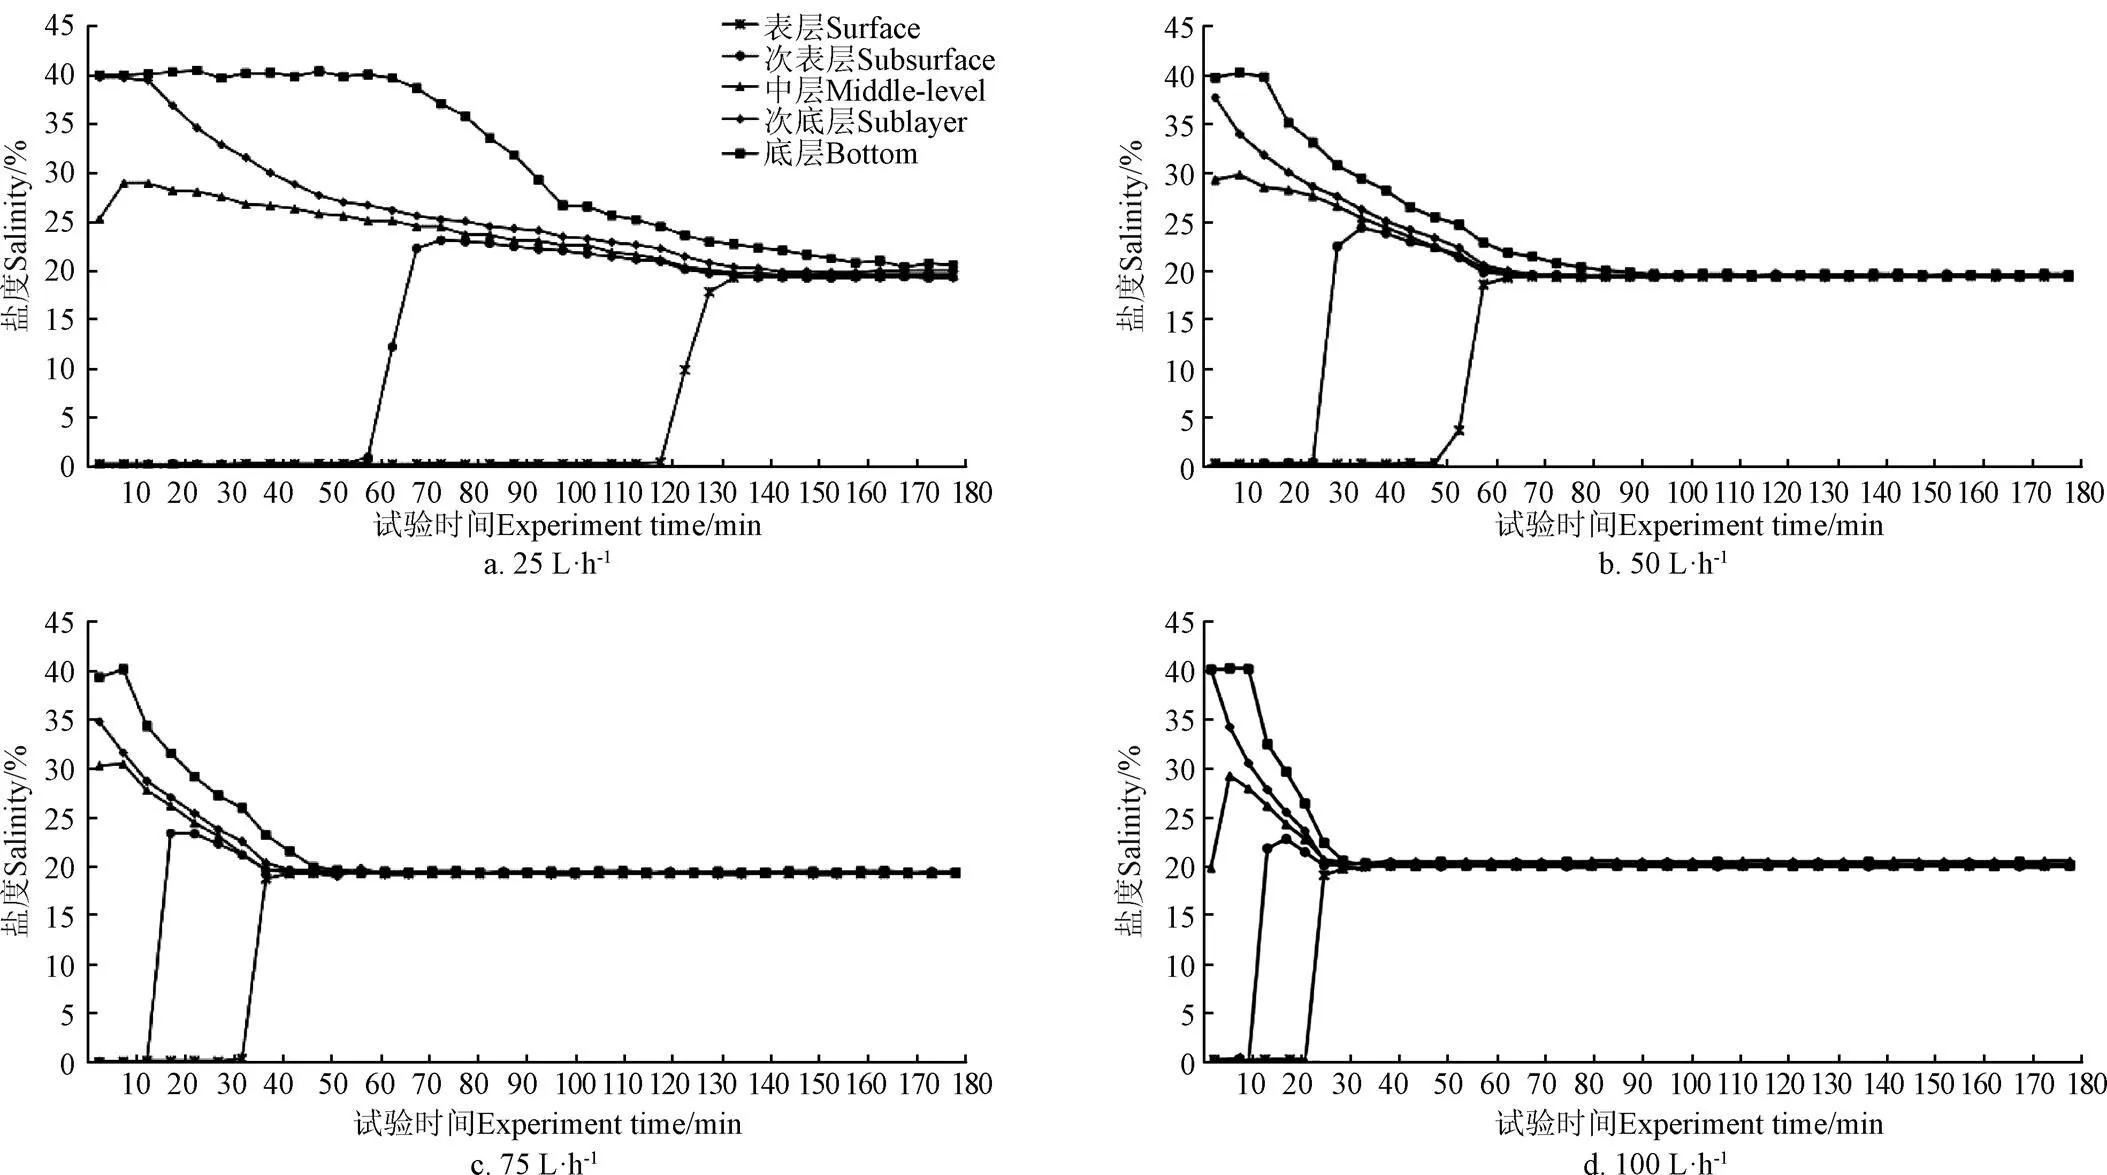
图3 4组流量下各水层盐度变化情况
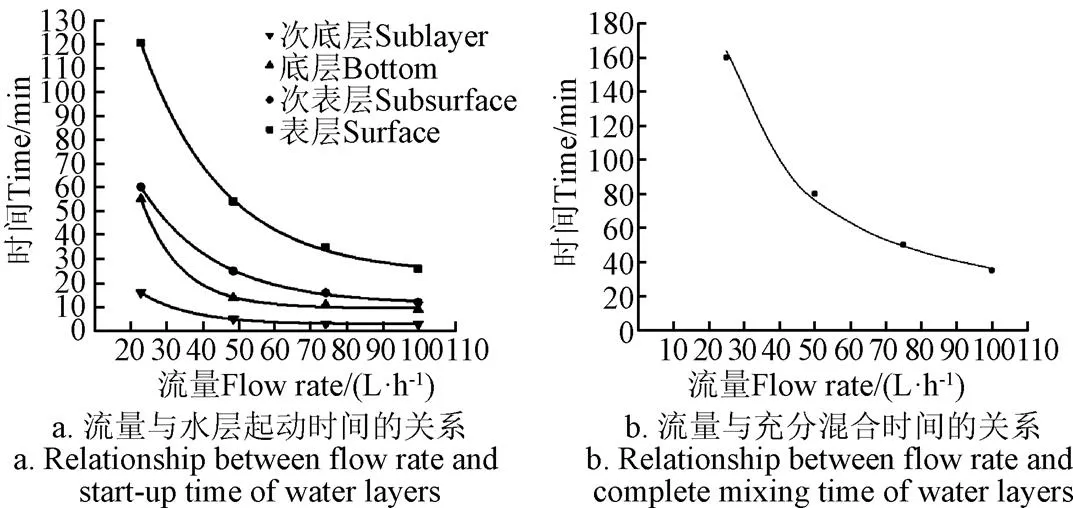
图4 流量随时间的变化关系
根据图3的四组流量下水槽水体充分混合的观测时间数据做图4b,调用传感器存储的大数据,拟合出静压力下垂直对流引发水体混合时,输水量与充分混合所需时间关系也呈幂函数曲线关系,流量越大各水层混合所需的时间越少,流量越小所需时间越多。
()混匀=(11.38±1.78×10⁻¹⁵)+(−285.20±2.91×10-15)×
(0.98±6.258×10⁻¹⁹)2=0.999 99(6)
总结试验数据,得到拟合计算式(2)~(5),可归纳输水量分别对次底层、底层、次表层、表层的启动时间影响的幂函数曲线;计算式(6)给出了输水量与充分混合所需时间的关系。在实验室给定工况下获得的这些函数关系,对仅在浮力作用下的水体去分层理论有一定的探索,有助于应用在生产实践。
4 结 论
本文使用水体染色法,在水槽条件下观测了水体去分层过程。从水色明显分层开始垂直向下输淡水,经历了管内充满红色水团但未溢出的准备阶段,红色水团溢出后烟雾状栩栩上浮并在分层界面水平扩散开来的起动阶段,分层界面红色变浅逐渐向下增厚形成过渡区域的混合阶段,最终达到水色一致的混匀阶段。总结获得如下结论:
1)根据观测现象,将仅在浮力作用下的水体去分层过程分解为准备、起动、混合和均匀4个阶段。
2)消除水体分层,本质是水体对流作用所引起的质量传递现象。在压力差的驱动下,向稳定的盐水区输送淡水形成“上升流”致使跃层增厚,最终造成分层水体失稳破坏。在本试验工况下,100 L/h输水流量混合作用最强,完全混合的时间最短,25 L/h输水流量混合作用最弱,完全混合的时间最长。
总结归纳4组实验数据,得到输水量对次底层、底层、次表层、表层启动时间的影响规律,和输水量与充分混合所需时间的关系,实现对更多工况的准确预测,对于指导生产实践有所帮助。
[1] Anderson E J, Stow C A, Gronewold A D, et al. Seasonal overturn and stratification changes drive deep-water warming inone of Earth's largest lakes[J]. Nature Communications, 2021, 12(1): 1-9.
[2] Qin B, Zhu G, Gao G et al. A drinking water crisis in lake taihu, China: Linkage to climatic variability and lake management[J]. Environmental Management, 2010, 45(1): 105-112.
[3] 郄志红,吴鑫淼,郑旌辉,等. 一种基于人工神经网络的水库水温分层模式判别方法[J]. 农业工程学报,1999,15(3):204-208.
Qie Zhihong, Wu Xinmiao, Zheng Jinghui,et al. A discriminating method of reservoir water temperature layering model based on artificial neural network[J]. Transactions of the Chinese Society of Agricultural Engineering(Transactions of the CSAE),1999, 15(3):204-208. (in Chinese with English abstract)
[4] Muldoon T. Nuclear submarine crushed by press of the sea and work schedules[J]. Professional Mariner, 2004(79): 63-64.
[5] 叶兆弘. 海水虾池的太阳池效应[J]. 集美大学学报(自然科学版),2004,9(3):210-215.
Ye Zhaohong. The solar ponds effect of seawater prawn ponds[J]. Journal of Jimei University (Natural Science), 2004, 9(3): 210-215. (in Chinese with English abstract)
[6] 黄廷林,曾明正,邱晓鹏. 周村水库季节性热分层消亡期水质响应特性[J]. 环境工程学报,2016,10(10):5695-5702.
Huang Tinglin, Zeng Mingzheng, Qiu Xiaopeng. Response of water quality of Zhoucun reservoir during the disappearance of seasonal thermal stratification[J]. Chinese Journal of Environmental Engineering, 2016, 10(10): 5695-5702. (in Chinese with English abstract)
[7] Noto D, Tasaka Y, Yanagisawa T, et al. Developing horizontal convection against stable temperature stratification in arectangular container[J]. Physical Review Fluids, 2021, 6(8): 083501.
[8] Boyd C E (著). 池塘养殖水质[M]. 林文辉(译).广州:广东科技出版社,2003:16-20.
[9] Gupta R, Gupta P K. The effect of artificial de-stratification on the water quality of a freshwater high altitude lake[J]. Journal of Ecophysiology & Occupational Health, 2012, 12(3/4): 27-41.
[10] Assari M R, Tabrizi H B, Movahedi M J. Experimental study on destruction of thermal stratification tank in solar collector performance[J]. The Journal of Energy Storage, 2018, 15: 124-132.
[11] 黄源彬. 内置换料水箱自然对流及热分层现象研究[D]. 哈尔滨:哈尔滨工程大学,2018:33-56.
Huang Yuanshan. Research on Natural Convection and Thermal Stratification of In-containment Refueling Water Storage Tank[D]. Harbin:Harbin Engineering University, 2018: 33-56. (in Chinese with English abstract)
[12] 石效卷,李璐,张涛. 水十条水实条——对《水污染防治行动计划》的解读[J]. 环境保护科学,2015,41(3):1-3.
Shi Xiaojuan,Li Lu,Zhang Tao. Water pollution control action plan, a realistic and pragmatic plan: An interpretation of water pollution control action plan[J]. Environmental Protection Science, 2015, 41(3): 1-3. (in Chinese with English abstract)
[13] Brink K H, Halpern D, Huyer A, et al. The physical environment of the Peruvian upwelling system[J]. Progress in Oceanography, 1983, 12(3): 285-305.
[14] Tsubaki K, Maruyama S, Komiya A, et al. Continuous measurement of an artificial upwelling of deep sea water induced by the perpetual salt fountain[J]. Deep Sea Research Part I Oceanographic Research Papers, 2007, 54(1): 75-84.
[15] Sigman D M, Jaccard S L, Haug G H. Polar ocean stratification in a cold climate[J]. Nature, 2015, 2004, 428(6978): 59-63.
[16] Zhao B, Han S, Xu L, et al. Rollover mechanism methodology of LNG tank with gas-liquid stratification based on Curvelet Finite element method and large eddy simulation technology[J]. Journal of Applied Fluid Mechanics, 2018, 11(3): 779-786.
[17] Ambach W, Blumthaler M, Kirchlechner P. Application of the gravity flow theory to the percolation of melt water through firn[J]. Journal of Glaciology, 2017, 27(95): 67-75.
[18] Walsh J J. A spatial simulation model of the Peru upwelling ecosystem[J]. Deep Sea Research &Oceanographic Abstracts, 1975, 22(4): 201-236.
[19] 修树孟,黄浩升. 台湾东北近海冬季上升流的数值模拟研究[J]. 水动力学研究与进展(A辑),2006(3):331-338.
Xiu Shumeng, Huang Haosheng. Study on numerical simulation for upwelling of winter off northeastern Taiwan[J]. Chinese Journal of Hydrodynamics (Ser. A), 2006(3): 331-338. (in Chinese with English abstract)
[20] 闫旭. 开式环境下差热式人工上升流速度场及温度场基础特性研究[D]. 杭州:杭州电子科技大学,2015.
Yan Xu. Study on the Basic Characteristic of Thermal-left Artificial Upwelling’S Velocity and Temperature Field on Open Environment[D]. Hangzhou:Hangzhou Dianzi University, 2015. (in Chinese with English abstract)
[21] Middleton J F. Wind-forced upwelling: The role of the surface mixed layer[J]. Journal of Physical Oceanography, 2000, 30(5): 745-763.
[22] Koszalka I, Ceballos L, Bracco A. Vertical mixing and coherent anticyclones in the ocean: The role of stratification[J]. Nonlinear Processes in Geophysics, 2010, 37(17): 37-47.
[23] 程向华,厉彦忠. 低温液体热分层特性分析[J]. 低温工程,2011(5):32-36.
Cheng Xianghua, Li Yanzhong. Characteristics analysis of cryogenic thermal stratification[J]. Cryogenics, 2011(5): 32-36. (in Chinese with English abstract)
[24] Stacey M T, Ralston D K. The scaling and structure of the estuarine bottom boundary layer[J]. Journal of Physical Oceanography, 2005, 35(1): 477-478.
[25] Scully M E, Geyer W R, Lerczak J A. The influence of lateral advection on the residual estuarine circulation: A numerical modeling study of the Hudson River Estuary[J]. Journal of Physical Oceanography, 2009, 39(1): 107-124.
[26] 张玉超,钱新,钱瑜,等. 太湖水温分层现象的监测与分析[J]. 环境科学与管理,2008,33(6):117-121.
Zhang Yuchao, Qian Xin, Qian Yu, et al. Field measurement and analysis on diurnal stratification in taihu lake[J]. Environmental Science and Management, 2008, 33(6): 117-121. (in Chinese with English abstract)
[27] Maxworthy T, Monismith S G. Differential mixing in a stratified fluid[J]. Journal of Fluid Mechanics, 1988, 189(1): 571-598.
[28] 王海蓉,马晓茜. 液化天然气(LNG)储存容器中的分层与翻滚[J]. 低温工程,2006(1):50-54.
Wang Hairong, Ma Xiaoqian. Stratification and rolling of liquid natural gas in storage tank[J]. Cryogenics, 2006(1): 50-54. (in Chinese with English abstract)
[29] Noto D, Tasaka Y, Yanagisawa T, et al. Developing horizontal convection against stable temperature stratification in a rectangular container[J]. Physical Review Fluids, 2021, 6(8): 083501.
[30] Patterson J,Imberger J. Unsteady natural convection in a rectangular cavity[J]. Journal of Fluid Mechanics, 1980, 100(1): 65-86.
[31] Vargas M, Sierra F Z, Ramos E, et al. Steady natural convection in a cylindrical cavity[J]. International Communications in Heat and Mass Transfer, 2002, 29(2): 213-221.
[32] Dippner J W, Nguyen K V, Hein H, et al. Monsoon-induced upwelling off the vietnamese coast[J]. Ocean Dynamics, 2007, 57(1): 46-62.
[33] Jiang Y, Chai F, Wan Z, et al. Characteristics and mechanisms of the upwelling in the southern Taiwan Strait:a three-dimensional numerical model study[J]. Journal of oceanography, 2011, 67(6): 699-708.
[34] 刘兴国,刘兆普,徐皓,等. 生态工程化循环水池塘养殖系统[J]. 农业工程学报,2010,26(11):237-244.
Liu Xingguo, Liu Zhaopu, Xu Hao, et al. Ecological engineering water recirculating ponds aquaculture system[J]. Transactions of the Chinese Society of Agricultural Engineering, 2010, 26(11): 237-244. (in Chinese with English abstract)
Effects of different salinity on water delamination under laboratory conditions
Zhang Kun1, Han Yuning1, Li Lezhou2, Zhou Wei2※
(1.,,116021,;2.,,116021,)
Salinity stratification has caused the uneven distribution of nutrients in the water body for aquaculture. A barrier layer can be normally formed to hinder the exchange of quality and energy, leading to the deterioration of water quality. Therefore, stratification can pose a great threat to the growth of organisms in the water body. In this study, two kinds of water bodies were dyed with different salinity in a glass tank in the laboratory. Four stages of water body delamination were observed: preparation, start-up, mixing, and homogenization, when depending only on buoyancy. Among them, the pressure difference was driven to form the upwelling convection of the "upwelling" type. The upwelling was then floated up to the layered interface for the mixing and thick thermocline. Eventually, the layered water body triggered the instability and destruction. The experimental system consisted of a glass tank, a backwater collecting tank, a water injection, and a backwater part. Specifically, the glass tank was the main body of the system. The backwater collecting tank was composed of sample bottles, whose upper edge of the horizontal position was aligned with the experimental tank. The water injection part also included the small submersible pump, diverter, plastic hose, and acrylic pipe. The water in the return collection tank was firstly delivered by the small submersible pump, and then carried to the predetermined water layer of the test tank via the diverter and plastic hose. In the backwater part, the inlet of acrylic connectors was set on the surface of the experimental water tank, while the outlet was on the bottom of the backwater tank. The water level of the experimental water tank was kept stable by the siphoning during operation. The salinity change was recorded on the surface, subsurface, middle, sub bottom, and bottom layer. Five groups of sensors were used to online monitor the process, when the water pipe was delivered the fresh water of different flows to the bottom layer of the tank. The results show that there was a significant impact of the water delivery flow on the delamination of the water body in the tank. Furthermore, there was the strongest mixing effect of 100 L/h flow, and the shortest time of complete mixing. By contrast, there was the weakest mixing effect of 25 L/h flow, and the longest time of complete mixing. A large amount of experimental data was summarized to obtain the fitting formulas. The function curve was then achieved in the impact of water delivery on the start-up time of the sub bottom, bottom, sub surface, and surface layer. A specific relationship was obtained between the water delivery volume and the time required for the full mixing under the given working conditions in the laboratory. The layered destruction of the water body was summarized to determine the influence of the water delivery flow on the salinity, starting, and mixing time of the water layer. The finding can also provide a strong reference for aquaculture production.
environment; breed; water quality; delamination of water body; salinity distribution; mixing time
10.11975/j.issn.1002-6819.2022.17.026
S96
A
1002-6819(2022)-17-0240-06
张琨,韩宇宁,李乐洲,等. 实验室条件下不同盐度水体去分层试验[J]. 农业工程学报,2022,38(17):240-245. doi:10.11975/j.issn.1002-6819.2022.17.026 http://www.tcsae.org
Zhang Kun, Han Yuning, Li Lezhou, et al. Effects of different salinity on water delamination under laboratory conditions[J]. Transactions of the Chinese Society of Agricultural Engineering (Transactions of the CSAE), 2022, 38(17): 240-245. (in Chinese with English abstract) doi:10.11975/j.issn.1002-6819.2022.17.026 http://www.tcsae.org
2022-05-12
2022-08-24
大连市科技创新基金项目(2020JJ26SN063);辽宁省兴辽英才项目“海参安全高效智慧养殖系统研究项目”(XLYC1808029)
张琨,博士,副教授,硕士生导师,研究方向为流动与传热传质。Email:zhk@dlou.edu.cn
周玮,博士,硕士生导师,研究方向为水产养殖和产业化技术。Email:zhouwei@dlou.edu.cn
