Endocast Morphological Variation and Its Driving Forces in Scutiger boulengeri
2023-01-05YinmengHOUXiaoxiaoSHUShengchaoSHIXiuqinLINLuyaoXIAOJianpingJIANGJianghongRANandFengXIE
Yinmeng HOU ,Xiaoxiao SHU ,Shengchao SHI ,Xiuqin LIN ,Luyao XIAO ,Jianping JIANG,4 ,Jianghong RAN and Feng XIE*
1 CAS Key Laboratory of Mountain Ecological Restoration and Bioresource Utilization, Ecological Restoration and Biodiversity Conservation Key Laboratory of Sichuan Province,Chengdu Institute of Biology,Chinese Academy of Sciences,Chengdu 610041,Sichuan,China
2 College of Life Sciences,Sichuan University,Chengdu 610065,Sichuan,China
3 University of the Chinese Academy of Sciences,Beijing 100049,China
4 Mangkang Biodiversity and Ecological Station,Tibet Ecological Safety Monitor Network,Changdu 854500,Tibet,China
Abstract Cranial endocasts can be used as a reliable proxy for brain size,reflecting the evolutionary and environmental selection pressure of species.Although studies on endocasts in amphibians have increased in recent years,those performed on endocasts of Anura are comparatively rare,especially at the intraspecific level.Here,using a high-altitude endemic toad—Scutiger boulengeri—as a model,through the application of integrative methods (morphology,anatomy,phylogeny,and ecology),we studied intraspecific variations in endocast morphology and explored its driving forces.Three-dimensional reconstruction and the brain-to-endocranial cavity (BEC) index suggested that the endocast of S.boulengeri can reflect brain morphology to a large extent.Elliptic Fourier analysis and principal component analysis revealed great variability in the cranial endocast morphology among individuals,as well as the variation concentrated in the regions of telencephalon and optic tectum.In the species,individuals with large bodies are accompanied by a larger endocast size;the relative endocast sizes have significant clade differences but no sexual dimorphism.Additionally,the relative endocast sizes of S.boulengeri were not associated with phylogenetic history and aquatic preference but were positively correlated with altitude and negatively correlated with oxygen content,temperature,and precipitation factors(annual mean temperature,temperature seasonality,annual precipitation,and precipitation seasonality).These findings suggested that high-altitude and extreme environmental conditions acted as important selective forces in morphological variation of the cranial endocast of S.boulengeri.
Keywords aquatic preference,cranial endocast,ecological adaptation,phylogenetic history,shape variation
1.Introduction
Cranial endocasts,usually defined by the cranial skeleton and a container of the brain,share meningeal tissue with the brain,probably reflecting varying levels of neuroanatomical resolution for different brain regions (Balanoff and Bever,2020).The study of cranial endocast morphology contributes to conveying important morphological details (shape,extent,size,and distribution) for cranial tissues and advances the understanding of the evolutionary potential of the brain as well as its constraints (Balanoffet al.,2010;Allemandet al.,2017).Endocasts serve as empirical windows into the history of a phylogenetic stem and play an important role in constructing and testing evolutionary hypotheses,informing the evolutionary history of neuroanatomical structure and its potentially complex evolutionary origin (Marcucioet al.,2011).Studies have concluded that the cranial endocast (endocast) does provide a reliable morphology proxy for the brain in birds and mammals (brains largely fill the endocranial space with a tight environmental correspondence with their braincases) (Iwaniuk and Nelson,2002;Finarelli,2006).However,in poikilotherms,the relationship between the brain and endocast size is much more complex (Olori,2010;Clementet al.,2021).Regardless of fish,amphibians,or reptiles,they all present a highly variable BEC (brain-to-endocranial cavity) index between groups or taxa (Jerison,2009;Balanoff and Bever,2020).In amphibians,frogs generally have relatively larger brains than salamanders(Northcutt,2002).Recent studies have shown that caecilians(68%–74%) and anurans (49%–63%) had brains that filled their endocasts to a greater extent than salamanders (38%–41%)(Clementet al.,2021),which means that endocasts can be a better response to brain morphology in anurans.Clearly,however,this conclusion is based on limited data,and brainendocast relationships still need to be further assessed in different groups or taxa of amphibians.
As the central system of learning,memory,cognition,and information processing,the brain is an indicator reflecting the state of species evolution and development and plays an important role in the process of animal adaptation (Solet al.,2005).Variations in vertebrate brain size and structure are believed to be related to evolutionary history,ecological environment,sexual selection,behavior,developmental process,and life history factors (Pollenet al.,2007;Isler and Schaik,2012;Fitzpatricket al.,2012;Maiet al.,2020;Yuet al.,2018;Liaoet al.,2015).Studies on the adaptive evolution of brain variation mainly focus on the interspecific level and rarely involve intraspecific level (Gondaet al.,2013;Axelrodet al.,2018).Similarly,phylogenetic and ecological signals can explain the variations of endocast compared to brain evolution,however,only a few studies have focused on the relationship between endocast morphology and phylogenetic history or environments in macroevolution of ectotherm (Allemandet al.,2017;Allemandet al.,2019).
The Qinghai-Tibet Plateau (QTP) is “the third pole of the world”,whose average elevation exceeds 4000 m,and QTP is one of the important global biodiversity hotspots (Myerset al.,2000;Favreet al.,2014).The uplift of the Qinghai-Tibet Plateau has caused dramatic changes in climate and ecology,which has had a significant impact on the plateau ecosystem and has provided a unique opportunity to study the process of speciation and ecological adaptation (Favreet al.,2014;Wenet al.,2014).To adapt to extreme environments at high altitudes,amphibians living in the QTP have evolved a series of adaptive phenotypes and physiology,which means that these amphibians have become an ideal animal group to study morphological adaptation and evolution.
The Xizang Alpine ToadScutiger boulengeri(Bedriaga,1898)is a member of the family Megophryidae with an elevation range of 2100–5270 m on the Qinghai-Tibet Plateau (Songet al.,1990;Feiet al.,2009;Subbaet al.,2015).As one of the most widely distributed species with the largest elevation span on the Qinghai-Tibet Plateau,information on the species morphological,ecological,and phylogenetic information ofS.boulengerihas received increasing attention (Fei and Ye,1987;Yeet al.,1992;Liet al.,2009;Chenet al.,2009;Hofmannet al.,2017;Linet al.,2021).Feiet al.(1987) qualitatively analyzed the differences in the webbing and skeleton of the Xizang Alpine Toad from different distributions and suggested that during the process of adapting to a high elevation and low temperature climate,some species gradually adapt to burrowing or aquatic environments.Liet al.(2009) indicated that rivers,as an effective barrier,led to the differentiation of the internal clades of the species.Linet al.(2021) demonstrated that niche divergence inS.boulengeriis caused by niche expansion accompanied by key morphological innovations.An extreme environment drove sensory adaptations in auditory,visual,and other sensory systems,which may be accompanied by changes in the central nervous system,including shifts in overall brain size as well as modifications in the size and shape of structures of the brain(Beltz,2019).Considering that the endocast can be used as a proxy for the brain,herein,to better understand amphibian adaptation and evolution to extreme environments at high altitudes,using morphological (3D reconstruction and geometric morphometry),anatomical,phylogenetic,and ecological methods,we first present a quantitative and integrative analysis of the endocast morphological variation ofS.boulengeriand insight into the driving forces from multiple-dimensional aspects (evolutionary history,ecological environment,sexual selection,etc.).
Our main goals are to investigate whether the shape and size of endocast inS.boulengerireflect brain morphology and explore the morphological variation of the endocast and its possible influencing factors.First,we checked the relationship between cranial endocasts and brain morphology and quantified shape and size variation.Then,we compared the endocast shape and size variation among different genders and clades.Finally,to explore its driving forces,we tested the correlations of phylogenetic history,sexual selection,and environmental factors (altitude,latitude,oxygen,habitat preference,and climate variable) with endocast size variation.
2.Materials and Methods
2.1.Sample preparationAll specimens in this study are from the Amphibians and Reptiles in the Herpetological Museum of the Chengdu Institute of Biology,Chinese Academy of Sciences (CIB,CAS) and all procedures followed the guidelines established by the Animal Care and Use Committee of the Chengdu Institute of Biology,Chinese Academy of Sciences(Permit No.: 2017-AR-JJP-03).The 13 collection sites cover three provinces and one autonomous region in the Qinghai-Tibet Plateau and its surrounding areas in China.We collected altitude,longitude,and latitude for each site (Table 1).The sex of the specimens was identified by the spiny glands in the chest and fingers (males),unlaid eggs in the abdomen (females),and limb shape according to Feiet al.(2009).All specimens were fixed in formalin,and we finally selected 98 individuals (67 males and 31 females) for this study.
2.2.Measurements and 3D reconstructionThe body size(SVL: snout-vent length) of specimens (67 males and 31 females)was measured by a digital Vernier caliper,accurate to 0.01 mm.We scanned 64 individuals (48 males and 16 females) for endocast variation analysis.A micro-CT machine (PerkinElmer,Quantum GX,in CIB Herpetology Laboratory) was used to scan the skull at 70 kV,88 μA,14 min per individual.Threedimensional (3D) reconstruction and image processing of the endocast were performed using MIMICS v.21 (Materialise Medical Co.,Belgium).Each lateral view and dorsal view of the endocast was exported from Mimics v.21 at the same degree in “bmp” format,respectively.CL (maximum length: distance between the middle anterior-most part of the olfactory bulbs and the middle posterior end of the endocast),CW (maximum width of the endocast),and CH (maximal height of the endocast) of the endocast were measured with the “Measurement tool”,and the scanning volume of the endocast (3D volume of endocast,V3d) was generated using Mimics v.21.The mean of three measurements was taken,accurate to 0.01 mm.
To check the brain-endocast relationship,nine CT scanned samples (7 males and 2 females) from the site of Tibet Autonomous Region and Sichuan Province were selected for skull dissection to obtain the entire brain tissue.The dissected brain volume (Vim) was measured using the immersion method (Scherle,1970).The immersion method operation steps:The detached brain was placed in an empty tube,and a fixed volume of ultrapure water was added with a pipettor until the tube was full (total capacity 200 μL).The volume of the brain was obtained by subtracting the volume of the water added from the volume of the tube (accurate to 1 μL).Measurements were repeated three times and averaged to increase the precision of the measurement.To negate interobserver variability,all measurements were conducted by the same person.
2.3.Phylogenetic reconstructionWe reconstructed the intraspecific phylogenetic relationship ofS.boulengeribased on 16S and COI mitochondrial gene fragments (sampling sites are shown in Table 1).The GenBank accession numbers are OK544538-48 (16S),OL589209-10 (16S),OK584750-60 (COI)and OL597983-84 (COI).We aligned the sequences using multisequence alignment in MEGA v.7 (Kumaret al.,2016).Before constructing a phylogenetic tree,PartitionFinder v.2.1.1(Lanfearet al.,2016) was used to select the best nucleotide substitution model for the 16S and CO1 sequences.The optimal model was selected based on the Bayesian information criterion(BIC) and the greedy algorithm.The maximum likelihood method (ML) and Bayesian inference (BI) method were used to construct gene trees to analyze the intraspecific phylogenetic relationship of species.The BI tree was constructed using MrBayes v.3.2.2 (Ronquistet al.,2012) with four Markov chain Monte Carlo (MCMC) runs of 10 million generations,sampling every 1000 generations and discarding the first 25% as burning.ML analysis was performed in RAxML v.7.0.4 software(Silvestro and Michalak 2011) with 1000 bootstrap replicates for branch confidence evaluation.
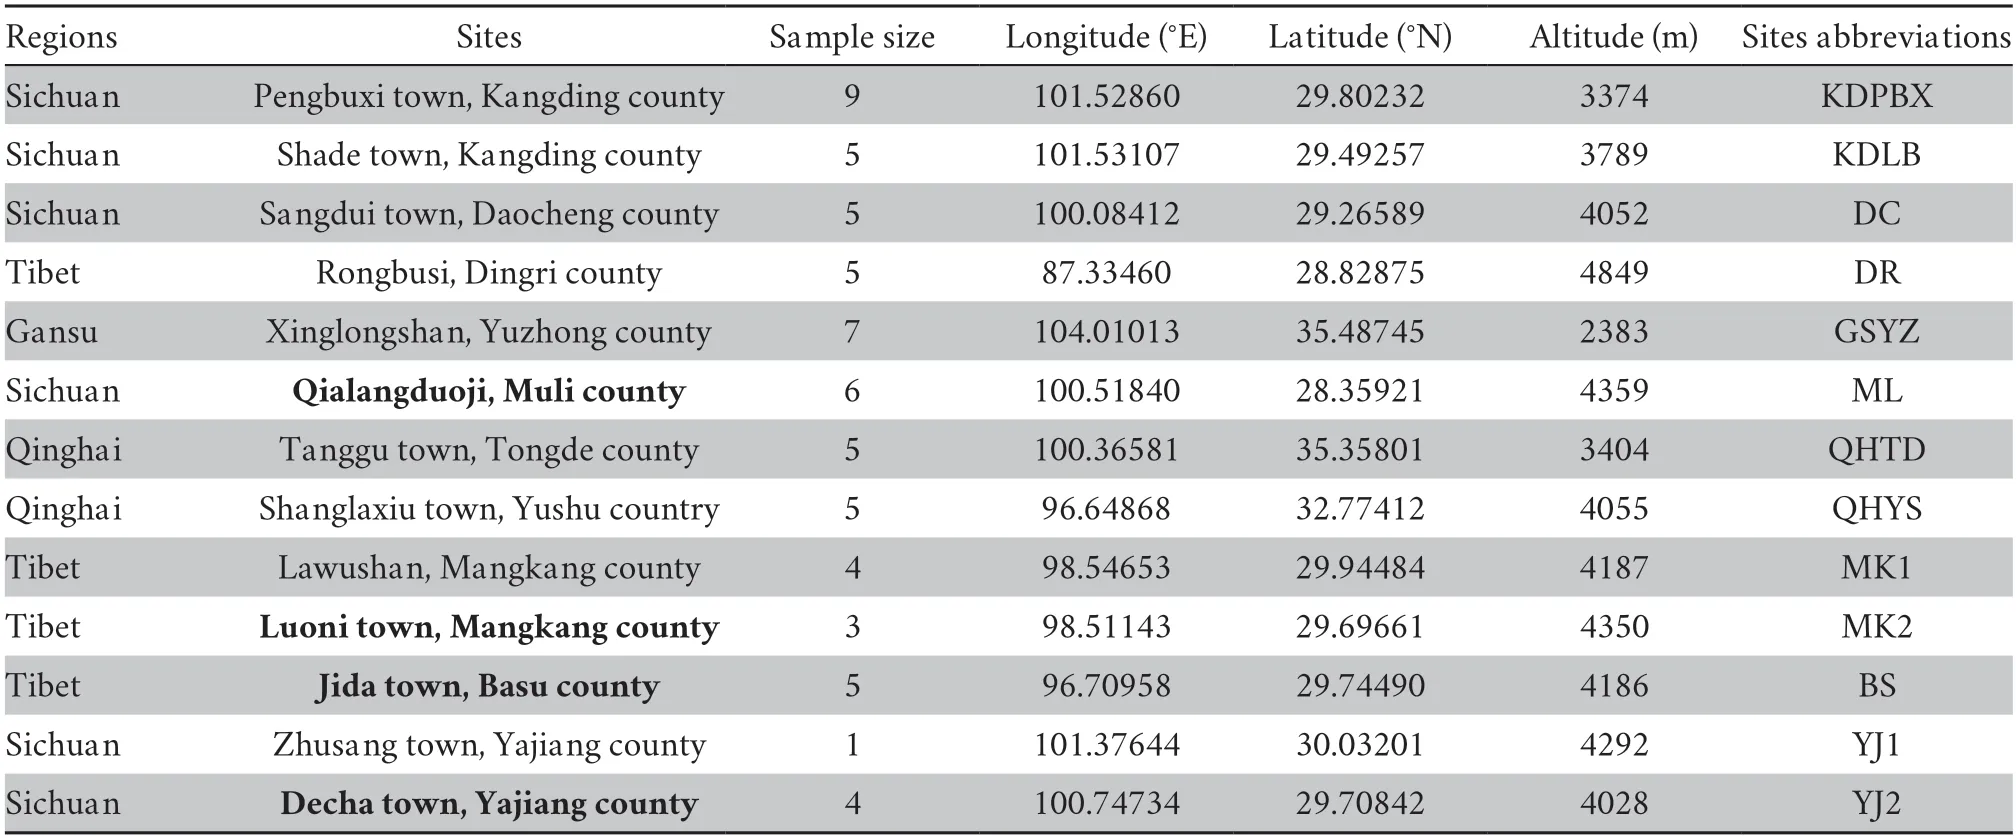
Table 1 Information for sampling locations and sample size of S.boulengeri.Nine complete anatomical brain samples were selected from bold sites.
The estimation of divergence times of the species was carried out in BEAST version 1.7.5 (Suchardet al.,2018).The “uncorrected lognormal relaxed clock” model and Yule speciation model for branching rates were set in BEAUti.Early diversification betweenOreolalaxandScutigeroccurred during the early Eocene (the most recent common ancestor ofOreolalaxandScutigerwas approximately 53 Ma) (Hofmannet al.,2017),which was used as a calibration point to estimate the intraspecific clade divergence inS.boulengeri.We performed a Markov chain Monte Carlo simulation run for 10 million generations,and trees were sampled every 1000 generations.For each of the tree statistics in the program Tracer version 1.7.1 (Rambautet al.,2018),the effective sample size (ESS>200) indicated satisfying convergence of the Bayesian chain and adequate model mixing.A maximum clade credibility (MCC) tree was generated with mean node heights and a 10% burn-in through TreeAnnotator version 1.7.5.(Drummondet al.,2012).
2.4.Environment data processingData on environmental factors included habitat factors (quantified by the aquatic preference index),altitude,latitude,oxygen content,UV-B intensity,and bioclimatic factors (Table S1).Studies have suggested that web degree can reflect aquatic preferences in amphibians and reptiles (Weiet al.,2009;Fothet al.,2019).By default,the larger the web ratio/degree is,the stronger the aquatic preference.We quantified aquatic habitat preferences using ImageJ (Abramoffet al.,2004) to measure the area and calculate the ratio of the webbed area between the third and fourth toes.The measurement method of the proportion of webbed area was slightly modified based on Yang (2018) (Figure S1).The altitude information was collected from the latitude and longitude of species sites and the extracted oxygen content in the atmosphere (1980–2019) from the National Tibetan Plateau Data Center (Xinet al.,2021).Three temperature factors,annual mean temperature (bio01),mean monthly temperature range (bio02),and temperature seasonality (standard deviation*100) (bio04);two precipitation factors,annual precipitation(bio12) and precipitation seasonality (coefficient of variation)(bio15);and two UV-B factors,annual mean UV-B (UVB1)and UV-B seasonality (UVB2),were selected as representative climate factors (Table S2).The climate variables included 19 bioclimate factors from the WorldClim database for current climate (1970–2000) (Hijmanset al.,2005) and six UV-B (UVB1–UVB6) variables from the glUV database (Beckmannet al.,2014).The bioclimate variables have a resolution of 30 arcseconds (~ 1 km at the equator) for each environment layer(Fick and Hijmans,2017),and the UV-B variables have a spatial resolution of 15 arc-minutes.To reduce collinearity and overlap between climate variables,Spearman correlation analysis was used to remove the highly correlated variables (correlation coefficient: |r| >0.7,P<0.05).
2.5.Shape variation analysisElliptical Fourier analysis(EFA) is a suitable method to analyze the irregular shape of objects and can provide an accurate morphological feature of the individual through the quantification of the profile,facilitating polymorphism analysis in the plants and animals(Haines and Crampton,2000;Ravelosonet al.,2005).Given that the cranial endocast is irregularly shaped and lacks explicitly defined homologous landmarks,EFA was used to quantify morphological variation in this structure.Shape analyses were performed with normalized elliptic Fourier analyses.First,cranial endocast was converted to binary,polished objects and chain code using the program SHAPE v.1.3 (Iwata and Ukai,2002).Then,CHC2NEF is used to create Fourier harmonic values,and we used 30 harmonics to reconstruct the shape.This number of harmonics was enough to capture the shape of the outline.In SHAPE,principal component analysis of the EFD coefficients was performed using the variance-covariance matrix of the coefficients,and the software returned the PCA scores for each object.The shape variations that can be accounted by each PCA were obtained and graphed using the“PrinPrint” tool from SHAPE.
The gender and clade differences of endocast shape were performed by stepwise discriminant analysis (SDA) using SPSS v.24 software (SPSS,USA).SDA was performed on the EFDS coefficients after endocast shape standardization (coefficients without difference were unsuitable for entering into the equation and would be excluded) to find linear combinations of the original variables that could give best separation between groups.The significance of the discriminant function was evaluated from Wilks’ lambda statistic (level of significance set at 0.05) (Klecka,1980).
2.6.Phylogenetic signal testingThe species is widely distributed on the Qinghai-Tibet Plateau,with some divergences in morphology and phylogeny (Liet al.,2009;Hofmannet al.,2017;Linet al.,2021),so we used phylogenetic signals to investigate the similarity of traits among clades(Blomberget al.,2003).We estimated the intensity of the phylogenetic signal in SVL,web degree,and absolute and relative endocast size (residuals from the endocast to SVL)using the package “phytools” in R software (R Core Team,2014).Phylogenetic signals are the tendency for closely related species to display similar trait values as a consequence of their phylogenetic proximity (Blomberget al.,2003).Phylogenetic signals calculated by Blomberg’sK-statistic method can measure the phylogenetic signal intensity of functional traits and detect the correlation between functional traits and phylogenetic relationships among species (Kvalues closer to zero correspond to a random or convergent pattern of evolution,K<1 implies that there is less phylogenetic signal than expected under Brownian motion,whileK>1 indicates a strong phylogenetic signal and conservatism of traits) (Blomberget al.,2003;Adams,2014).
2.7.Difference analysis and correlation testsFirst,we test the assumption of normality and homogeneity of variances of the data.To examine the gender and clade differences in SVL,web degree,and cranial endocast,we used two-way analysis of variance (two-way ANOVA) and analysis of covariance(ANCOVA) and a nonparametric factorial Kruskal-Wallis(KW) sum-rank test.Then,Fisher’s least significant difference and Dunn’s test analysis were used for multiple comparisons of the above data.The dimorphism index is directly calculated as the ratio of male size to female size minus 1,with a positive value indicating larger males and a negative value indicating larger females (SDI=(male size/female size)– 1) (Lovich and Gibbons,1992).A general linear regression model (GLM)was used to investigate the relationship between immersion brain volume (Vim) and V3d,and a regression equation was established to verify the effect of scanning volume.To examine the correlation between the web degree,altitude,latitude,oxygen content,climate factors and endocast sizes,we constructed linear mixed models (LMMs) in the R package “lme4”.To compare the relative size,GLM was used to investigate the relationship between endocast sizes and SVL,and SVL was set as a covariable to control its impact in exploring the relationship between endocast sizes and all factors.The data (SVL,web degree,and cranial endocast measurements)meet the assumption of normality and homogeneity of variances,except for the CW data (homogeneity of variance is not satisfied in different clades).For group differences in SVL and web degree,gender,clades,and their interaction were fixed factors.For endocast sizes,gender,clades,and their interaction as the fixed factor and the SVL as a covariable control the body size effect.For the gender difference of CW data,gender was the fixed factor,and SVL was the covariable.The KW sum-rank test was used to analyze the difference in CW data size (residual data corrected by SVL) between clades.For all GLM and LMMs,we ran model diagnostics to test model assumptions,including normality and homoscedasticity.The applied LMMs are as follows:
1.Aquatic preference: an LMM involving web ratio as the response variable,gender and altitude as fixed variables,with clade as a random factor.
2.Habitat preference: LMMs involving V3d,CL,CH,CW as the response variable;web degree as a fixed factor,with clade as a random factor.
3.Altitude and latitude: LMMs involving V3d,CL,CH,and CW as the response variables;altitude and latitude as a fixed factor,respectively,and SVL was considered a covariate to control its impact,with clade as a random factor.
4.Oxygen content: LMMs involving V3d,CL,CH,CW as the response variable;oxygen content as a fixed factor;SVL was considered a covariate to control its impact,with clade as a random factor.
5.Climate factors: Before the correlation analysis between endocast sizes and climate factors,GLMs were used to test the correlation between altitude,latitude and climate factors,respectively.LMMs involving V3d,CL,CH,CW as the response variable;climate factors (bio01,bio02,bio04,bio12,bio15,UVB1,UVB2) as fixed variables;SVL was considered a covariate to control its impact,with clade as a random factor.
3.Results
3.1.PhylogenyAfter manual correction,alignment,and trimming,we finally obtained 1125 bp of two mitochondrial gene fragments (16S: 502 bp,COI: 623 bp).The best substitution model for both gene fragments was GTR +G.Based on the BI and ML phylogenetic trees,we dividedS.boulengeriinto five clades,including GS,QH,S1 (including the sites from YJ1,KDPBX,KDLB),S2 (including the sites from ML,DC,YJ2),and XQ (including the sites from DR,BS,MK1,MK2,QHYS).The resultant topology was consistent with the intraspecific phylogeny ofS.boulengeriobtained from the analysis of the cytochrome b gene (Linet al.,2021).Divergence times indicated that the clades ofS.boulengeridiverged during the Miocene approximately 13.66 Ma (Figure 1).
3.2.Morphological comparison between brain and endocastInS.boulengeri,the external surface of the brain and inner surface of the endocranial cavity are consistently buffered by meningeal tissue (dura,pia,arachnoid).We obtained different brain regions,including the olfactory nerves,olfactory bulbs,telencephalon,pituitary infundibulum,diencephalon,optic tectum,cerebellum,and medulla oblongata(Figure 2D).A pair of corresponding olfactory nerves extend forward,shape elongated;the bulbs olfactory is cylindrical,short,transversally undivided;and the telencephalon consists of a pair of evaginated cerebral hemispheres (both hemispheres are separated by a longitudinal medial sulcus),drop-shaped and globoid;the diencephalon is pentagonal from dorsal view,partially covered by the posterior edge of the hemispheres.The pituitary infundibulum is relatively flat and located on the ventral side of the diencephalon.In dorsal view,the optic tectum exhibits a pair of domes separated by a median sulcus,nearly round in shape,and the cerebellum is relatively narrow and thin.The medulla oblongata is sunken-shaped and posteriorly connects with the spinal cord (Figure 2D).Mirco-CT scan and 3D reconstruction showed that the skull of theS.boulengerispecimen could be reconstructed completely;however,from the endocast,it is not possible to distinguish different brain regions.The endocast (without considering the cranial nerves or the inner ear) external surface was relatively smooth,although there were some individual differences (Figure 2A,B,C).The morphological comparison between anatomical brain and reconstructed endocast showed that the regions of bulbs nerve,olfactory bulb,telencephalon,pituitary infundibulum and optic tectum of endocast show high morphological consistence with brain shape (Figure 2C,D).The bulb nerve corresponds to the anterior-most structure of the brain endocast,and the largest part has a groove (corresponding to a groove in telencephalon)in the middle and laterally extended.The external morphology of the brain endocast does not allow the olfactory bulb and telencephalon to be delimited in dorsal view,and the lateral view shows a relatively clear delimitation.In the dorsal view,the median sulcus of the optic tectum is not visible.The posterior margin from the optic tectum in the endocast covers the indistinct cerebellum and medulla oblongata.The pituitary infundibulum is marked by a small bulge in ventral and lateral views (Figure 2C).

Figure 1 The phylogenetic tree of S.boulengeri with a relaxed clock and Yule speciation process.The number on the node label is the estimated divergence time.Numbers inside the branches indicate Bayesian posterior probabilities/maximum likelihood bootstrap values,respectively.
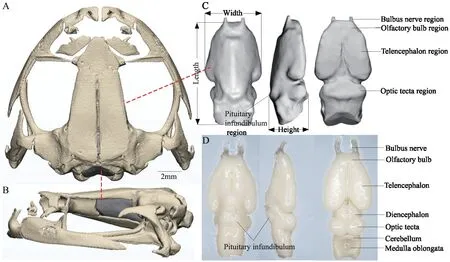
Figure 2 Skull,cranial endocast and dissected brain of S.boulengeri.A: represents dorsal view of skull;B: represents lateral view of skull;C:represents the ventral,lateral,and dorsal view of cranial endocast (left to right),the Height,Length,and Width represent the measurement parameters of endocast;D: represents the ventral,lateral,and dorsal view of brain (left to right).
The immersion method and 3D reconstruction were used to measure the size of the brain and endocranial cavity,respectively.We obtained and compared the brain size with the endocast volumes by CT reconstruction inS.boulengeriand found that the BEC index was more than 1/2 (the proportion of brain to endocast volume in the measured specimen was 56.38%–68.14%,the average proportion was 61.29%).General linear regression analysis showed that there was a significant positive correlation between brain size and endocast volume(Vim=0.504*V3d+6.4737;P=0.005,adjustedR2=0.66).
3.3.PCA of endocast shape variationPrincipal component analysis (PCA) summarized the cranial endocast shape variations ofS.boulengeri.In the dorsal view of endocast shape,the first five principal components (79.4%) mainly represented the variation of the whole endocast (Table 2).The first three PC axes explained 36.3%,20.6%,and 9.9% of the observed shape variation.PC1 and PC2 described the variation of telencephalon region;with PC1 represented the broaden and shorten telencephalon region from the negative to positive direction;PC2 showed the narrowing telencephalon region from the negative to positive direction.PC3 captured the widened optic tectum region variation from the negative to the positive direction.PC4 was related to extending the forward olfactory bulb region and the general shape variation of the endocast.From the PCA,there were obvious overlaps in gender and clades.Figure 3 showed that there is a large variation among individuals in the endocast ofS.boulengeri.
In the lateral view of the cranial endocast,the first five principal components (74.4%) mainly represented the variation of the cranial endocast (Table 2).The first three principal components together accounted for approximately 60.0% of the lateral shape variation.The first,second,and third PC axes explained 33.9%,15.7% and 10.4% of the lateral observed variation,respectively.For PC1,telencephalon and optic tectum regions were higher in the positive direction,while the shape was flatter in the negative direction.For PC2 and PC3,the main shape variation focused on the olfactory bulb and optic tectum regions.The negative to positive direction in PC2 was characterized by the optic tectum flatter to round and round to flat in the olfactory bulb.PC3 captured the variation in flatting the olfactory bulb and optic tectum regions from negative to positive.PC4 mainly represented the flatting olfactory bulb from negative to positive.From the results of principal component analysis (many obvious overlaps were found in gender and clade),there was a large variation among individuals in the cranial endocast ofS.boulengeri(Figure 3).The discriminant analysis was performed on 117 EFDS coefficients after endocast outline standardization.The results indicated that the cross-validation rates of gender in the dorsal and lateral views of the Fourier coefficient were 65.6% and 76.6% using SDA,respectively,suggesting that there were some differences in the endocast shape of the gender from the dorsal and lateral views,but the discrimination accuracy was low.In the discrimination of clade outlines,we could not distinguish the clade differences using the endocast outlines because the cross-validation rates of the dorsal view and the lateral view were 40.6% and 59.4%,respectively.All the discriminant functions were valid (Wilks’lambda significanceP<0.05).The discrimination accuracy of endocast shape for both genders and clades was low,which also reflected the large variation among individuals.
3.4.Group difference of traits in S.boulengeri
Sexual dimorphismThe SVL and web degree had significant sexual dimorphism (SVL:F=8.638,P=0.004,web degree:F=10.908,P=0.001).The dimorphism index results showed thatfemales had a slightly larger body size than males (SDIsvl=–0.016 <0),whereas males had a larger degree of webbing than females (SDIwebdegree=0.240 >0).InS.boulengeri,we found that a large body was accompanied by a large endocranial cavity(P=0.017,adjustedR2=0.074,Table S3),so body size was used to correct the relative endocast size.No sexual dimorphism was found in any of the relative endocast sizes (V3d,CL,CH,CW)(P>0.05).

Table 2 Eigenvalue,contribution rate and cumulative contribution rate of the first five principal components of elliptic Fourier descriptors.
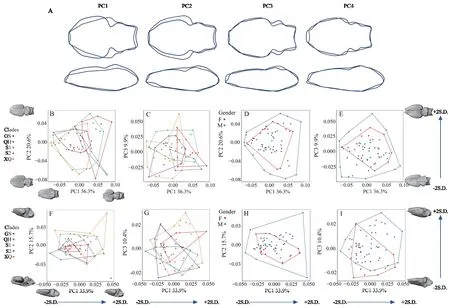
Figure 3 Visualization of the variations in endocast shape (dorsal and lateral view) in S.boulengeri.A: The blue and black solid lines indicate,respectively,the low and high values along the first four PC axes;B–C: represent the shape variation of different clades in dorsal view (first three PCs);D–E: represent the shape variation of dorsal view (first three PCs) in both genders;F–G: represent the shape variation of different clades in lateral view (first three PCs);H–I: represent the shape variation of lateral view (first three PCs) in both genders.Each endocast shape is reconstructed from coefficients calculated by letting the score for the corresponding principal component be equal to its mean or its mean plus or minus two times the standard deviation.The endocasts (dorsal and lateral view) represent the shape variation from negative to positive along the first three PC axes.The blue arrows point the variation direction from negative to positive.
Clade differenceANOVA results showed that SVL and web degree had significant clade differences (SVL:F=5.715,P<0.001;web degree:F=12.753,P<0.001).The relative V3d and CH were significantly different in clades (V3d:F=8.257,P<0.001;CH:F=5.312,P=0.001),while the relative CW and CL were not significantly different among clades (P>0.05).The results suggested that endocast sizes in different clades differentiated to some degree (Figure 4).
3.5.Correlation between phylogenetic history,environmental factors and endocast sizes in S.boulengeri
Phylogenetic signalTo analyze whether features evolved with the Brownian motion model,we used the average value of each site to detect the phylogenetic signals.Body size (SVL),web degree and absolute endocast volume had weak phylogenetic signals (K<0.5,P<0.05).Controlling the body size,the results showed that there was no significant phylogenetic signal in relative cranial endocast sizes (residual) (Table 3).
Aquatic preferenceTo quantify the habitat preference factors,an indirect index (web degree) was selected to reflect the differences in aquatic preference inS.boulengeri.The LMM results suggested that there was a significantly positive correlation between web degree and altitude (male:t value=3.039,P=0.004;female:t value=2.857,P=0.007) (Figure 5A),indicating that the higher the altitude,the larger the webbing,suggesting an increased aquatic preference with altitude.Meanwhile,we investigated the correlation between aquatic preference (web degree) and endocast sizes in the species.The results confirmed that the relative endocast sizes had no significant correlation with aquatic preference (P>0.05) (Table S4).
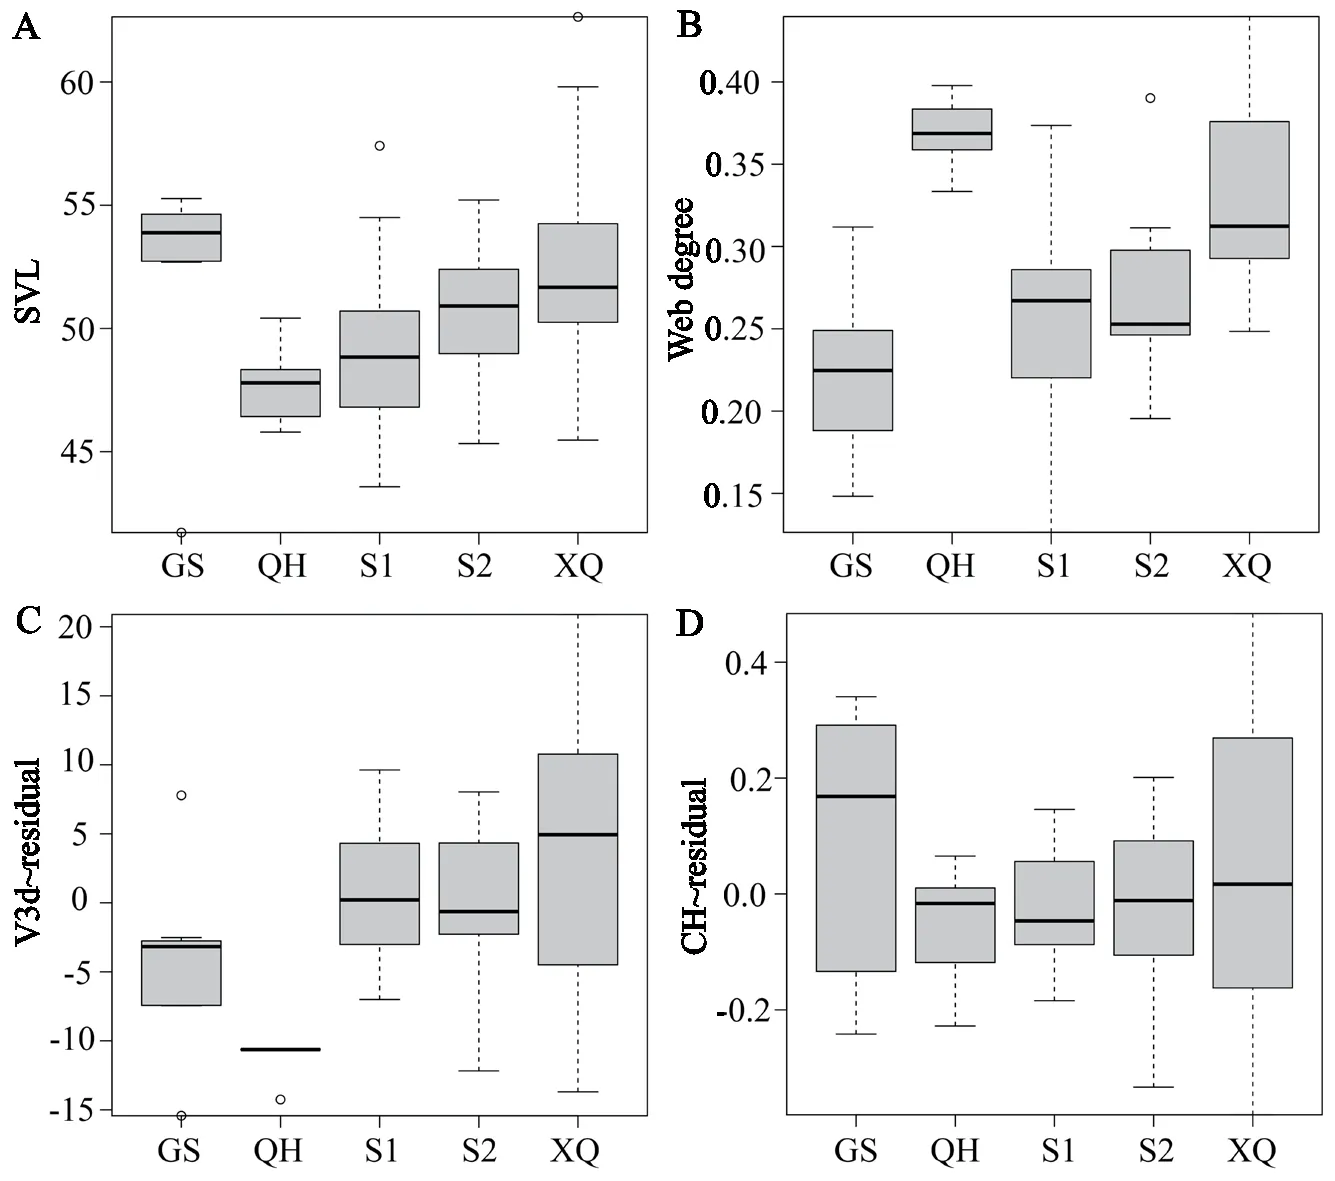
Figure 4 The morphological measurements in clades of S.boulengeri.A: SVL,B: Web degree,C: relative 3D Volume of endocast (V3d~residual),D: relative endocast height (CH~residual).

Table 3 The phylogenetic signal (K-value) of all traits in S.boulengeri.
Altitude and LatitudeIn examining the correlations between altitude,latitude and endocast sizes,the results showed that the relative V3d and CH had a positive correlation with altitude(V3d:P=0.032;CH:P=0.022),and the relative CW and CL had no correlation with altitude (P>0.05) (Table S5).No significant correlation was found between relative endocast sizes and latitude (P>0.05) (Table S5).The results showed a trend that the relative endocast sizes increased with increasing altitude(Figure 5B).
Oxygen contentOxygen content,an associated factor with elevation change,was further tested with endocast sizes.The results showed that the relative V3d and CL had a negative correlation with oxygen content (V3d:P=0.010;CL:P=0.034),and the relative CW and CH had no correlation with oxygen content (P>0.05) (Table S6).That was,the relative endocast volume of the species increased with the gradual reduction of oxygen content under the environment of the plateau (Figure 6).
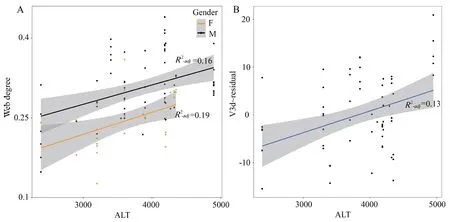
Figure 5 Correlation between web degree,relative endocast volume and altitude (ALT) in S.boulengeri.A: web degree with altitude (ALT)in both genders;B: relative endocast volume (V3d~residual) with altitude (ALT).
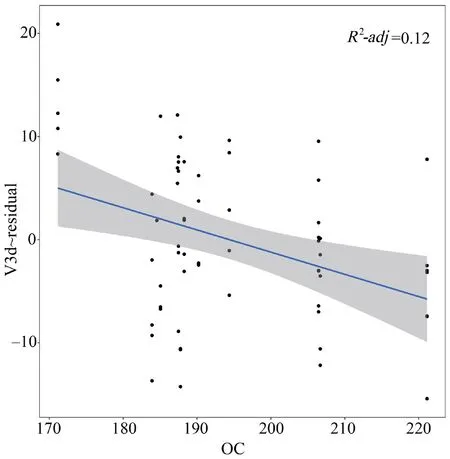
Figure 6 Correlation between oxygen content (OC) with the relative endocast volume (V3d~residual) in S.boulengeri.
Climate factorsGLM results showed that altitude was negatively correlated with bio01,bio04,bio15 and positively with bio02,UVB1,UVB2,respectively.The latitude was negatively correlated with bio12,UVB1,UVB2 and positively with bio04,respectively (Table S7).Then we analyzed the relationship between multiple climate factors (bio01,bio02,bio04,bio12,bio15,UVB1,UVB2) and endocast sizes variation.The linear mixed-effects models revealed that the relative endocast sizes were related to climate factors.In further exploring the relationship between the temperature factor and relative endocast sizes,we found that relative CH was significantly negatively correlated with bio01 (annual mean temperature) (P=0.039,Table S8),while other measurements of endocasts were unrelated to the factor (P>0.05,Table S8).All endocast sizes had no correlation with bio02 (mean monthly temperature range) (P>0.05,Table S8).The relative V3d was significantly negatively correlated with bio04 (temperature seasonality) (P=0.018) and relative CW showed a weak negative correlation with bio04 (P=0.05),while the relative CL,and CH were unrelated to this factor (P≥0.05) (Table S8).For the precipitation factors,the results showed that relative V3d and CH were negatively correlated with bio12 (annual precipitation) and bio15 (precipitation seasonality),respectively(Table S8).Moreover,the UV-B factors (annual mean UV-B and UV-B seasonality) had no correlation with endocast sizes (P>0.05,Table S8).The influence of temperature and precipitation factors on the endocast was evident,and the smaller seasonality variation was favorable to generate a larger cranial endocast(Figure 7).
4.Discussion
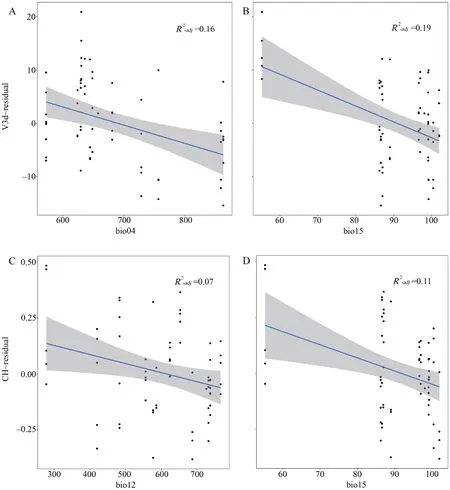
Figure 7 Correlation between climate factors with the relative endocast volume (V3d~residual) and relative endocast height (CH~residual) in S.boulengeri.A: bio04 (Temperature seasonality) with V3d (residual),B: bio15 (precipitation seasonality) with V3d (residual),C:bio12 with CH (residual),D: bio15 with CH (residual).
4.1.The endocranial cavity can reflect brain morphology in S.boulengeriUsing CT scanning combined with 3D reconstruction,we successfully reconstructed the endocranial space ofS.boulengeriand obtained cranial endocast morphology.In morphological comparisons between the brain and endocast,the regions of the olfactory bulb,telencephalon and optic tectum of the endocast showed high morphological similarity with brain shape.Moreover,there was a significant positive correlation between the endocast cavity and brain size.Therefore,we interpreted that the endocranial cavity ofS.boulengerican estimate brain size to a large extent (average BEC index is 61.29%,range of 56.4%–68.1%).This is the first report on the Mesobatrachia species,and the result is consistent with the results of Challandset al.(2020) and Clementet al.(2021)on Neobatrachia species (49%–63%).Our study provides new evidence for a relatively tight relationship between the endocast and brain morphology and refutes the argument of a low BEC index in amphibians (Jerison,2009).
4.2.Shape variation of endocastsIn this study,we applied 3D reconstruction and elliptical Fourier analysis to investigate the variation in cranial endocasts inS.boulengeri.From the lateral and dorsal views,the most distinct variations of individuals located in the region of telencephalon and optic tectum.The endocast morphology varied greatly among individuals,and it was not very well classified in genders and clades.Our results showed no clear pattern in the endocast shape,but the presence of differences was undeniable,more samplings and innovative comparative quantitative methods (higher-resolution scan or dice CT,3D geometric morphometrics) can more accurately reconstruct and quantity the shape of the structures in the future.
4.3.No sexual selection in relative endocast sizesIn brain morphology studies of birds and mammals,the intensity of sexual selection is usually treated as a key component affecting the evolution of brain size (Garamszegiet al.,2005;Fitzpatricket al.,2012).In amphibians,fewer studies have investigated how sexual selected pressures influence investment in brain tissue(Zenget al.,2016;Maiet al.,2020).Zenget al.(2016) indicated that sexual selection does not play a significant role in the evolution of brain size in Anura,although courtship behavior and the mating system affect the size evolution of the olfactory brain.Maiet al.(2020) found that relative brain size was positively correlated with intensity of male mate competition (operational sex ratio (OSR),spawning-site density and male forelimb muscle mass).Our study suggested that the web degree and SVL ofS.boulengerihave significant sexual dimorphism (P<0.001),while there was no significant sexual dimorphism for relative endocast sizes (V3d,CL,CW,CH) (P>0.05).Therefore,we speculated that sexual selection is not an important factor in endocast size evolution within the species.
4.4.Evolutionary instability of endocast sizesIt is common to use phylogenetic signals to predict features of species that have not been studied,as well as features of their close relatives(Adams 2014).Studies have demonstrated that the evolution of morphological differences between clades or species could be the consequence of evolutionary constraints (Vidal-Garcíaet al.,2014).Additionally,morphological characteristics are considered to be evolutionarily malleable and more susceptible to environmental influences or interactions between ecological conditions and historical evolutionary context (Axelrodet al.,2021).S.boulengeriharbors a large amount of genetic variation,and the mtDNA or nuclear genes of the species have a strong geographical pattern (Liet al.,2009;Chenet al.,2009;Hofmannet al.,2017;Linet al.,2021).Our study identifiedS.boulengeriinto five clades according to the phylogenetic relationship (Figure 1).We examined the relationship between phylogenetic history and traits (SVL,web degree,cranial endocast) of the species.The results showed that the SVL,web degree and absolute V3d had weak phylogenetic signals,and the relative endocast sizes had no phylogenetic signals inS.boulengeri.Linet al.(2021) noted that the SVL in the species has a significant phylogenetic signal,and our study is consistent with this result.The weak signal in absolute endocast volume and lack of phylogenetic signals in the relative sizes of the endocast suggested that the endocast sizes within the species tended to be evolutionarily unstable and that the variation could be influenced by other factors,such as environmental factors.
4.5.No effect of aquatic preference on endocast sizesDifferences in the habitat environment have been proven to influence the morphology of the brain,endocast,or skull(Tayloret al.,1995;Liaoet al.,2015;Allemandet al.,2017;Paluhet al.,2020).For instance,arboreal families (or subfamilies)had a significantly larger brain than terrestrial or aquatic families (or subfamilies) in Anura (Tayloret al.,1995).Paluhet al.(2020) suggested that skull shapes differ among frogs that occupy distinct microhabitats.Previous studies supposed that during the process of adapting to the QTP,Scutigerspecies gradually adapt to burrowing or aquatic environments (Yeet al.,1992).Our study found that the web degree ofS.boulengeriincreases significantly with elevation,which implied a more aquatic adaptation trend increasing with altitude.Furthermore,we investigated the relationship between habitat (aquatic preference) and endocast sizes inS.boulengeri;however,the statistics indicated that there was no correlation between endocast sizes and aquatic preference.Powell and Leal (2014)suggested that differences in relevant habitat complexity within a given habitat type might not be sufficient to favor divergence in the volume of the overall brain or its constituent structures,especially in closely related species.Thus,we concluded that the complexity of aquatic preference habitats alone might not be sufficient to favor variation in endocasts at the intraspecific level.
4.6.Effect of environmental factors on relative endocast sizesGenerally,in high-altitude areas,lower temperatures,less food supplies,shorter breeding seasons,and greater climatic unpredictability have a great influence on the physiology,behavior,and life history of animals,especially in ectotherms (Badyaev and Ghalambor,2001;Liao and Liu,2008).The Qinghai-Tibet Plateau is characterized by extreme environments,such as low oxygen,low temperature,less precipitation,and strong UV-B radiation,which bring multiple pressures and challenges to the local species (Wen,2014).In our study,the integrated influence of multiple environmental factors on the variation in endocast size was found.The endocast size ofS.boulengeriwas positively correlated with altitude and negatively correlated with oxygen content,annual mean temperature,and annual precipitation but not correlated with the latitude and UV-B factor.Large brain facilitates the construction of behavioral responses to unusual,novel or complex socioecological challenges (cognitive buffer hypothesis,CBH) (Dunbar,1998;Sol,2009;Solet al.,2007).Amphibians can evolve larger brains or brain regions as an adaptation for a better chance of colonizing harsher environments (Amielet al.,2011;Huanget al.,2020).Linet al.(2021) uncovered that niche expansion to a new environment was more representative of real niche change than niche unfilling in the shifted range ofS.boulengeri.Therefore,as the CBH predicted,we believed that the cognitive advantage of a relatively large endocast (or brain)in the species contributes to increased behavioral flexibility and food availability to adapt to complex geographical environments and extreme climate conditions or to colonize new environments and expand the ecological niche in the QTP and its adjacent areas.
Seasonal environment variability is also thought to have contributed to the evolution of the brain (van Woerdenet al.,2010;Luoet al.,2017).The expensive brain framework(EBF) predicts that the brain size decreases with seasonality,as the most energetically costly organ,relatively smaller brains can provide energy benefits during periods of resource scarcity (van Woerdenet al.,2010).Our study found that endocast size was negatively correlated with temperature seasonality and precipitation seasonality,but not with UV-B seasonality,reflecting that lower seasonal variation in extreme environmental conditions is more conducive to the development of a larger endocast or brain inS.boulengeri.Therefore,our study supports the EBF on account of endocast size ofS.boulengeridecreases with seasonal changes (temperature and precipitation).The climatic seasonality is influenced by latitude and altitude (Chown and Klok,2003;Martinet al.,2009).In the Tibetan Plateau and its adjacent area,seasonal variations in temperature are more pronounced at lower elevations than at higher elevations (Luet al.,2010).Our results further confirmed that altitude and latitude do affect the temperature seasonality and precipitation seasonality (see Table S7).The endocast sizes ofS.boulengeriwas positively correlated with altitude but not with latitude.Given the distribution (large elevation spans) ofS.boulengeri,the higher altitude populations/clades within lower climatic seasonality environments have a larger endocast size or brain.
5.Conclusions
Here,we quantified the BEC index and endocast shape variation,exploring the relationship between sexual selection,phylogenetic history,and environmental pressures on endocast size variation in an alpine lazy toad—Scutiger boulengeri.The study showed that the BEC index in this Mesobatrachia species was more than sixty percent,which is consistent with the results from Neobatrachia.EFA and PCA results showed great variability in the brain endocast morphology among individuals,and the main variation focused on telencephalon and optic tectum.In addition,our study indicated that endocast sizes had no relationship to phylogenetic history,sexual selection and aquatic preference,but was strongly related to environmental conditions (especially altitude,oxygen content,temperature,and precipitation).These findings suggested that the extreme environmental conditions in the Qinghai-Tibet Plateau and its surrounding areas played an important role in cranial endocast variation.
AcknowledgmentsWe thank Dr.Xianguang GUO for field assistance;Cheng SHEN,Puyang ZHENG,Mingyang CHENG,Fuxuan LIANG,Yuanfei WANG for collecting specimens and experimental assistance;Dr.Zhongyi YAO for the method guidance;Dr.Meihua ZHANG for scanning the specimens.We are especially grateful to the Animal Branch of the Germplasm Bank of Wild Species of CAS for sampling assistance.This project is supported by the Second Tibetan Plateau Scientific Expedition and Research Program (STEP,2019QZKK05 010503;2019QZKK04020202),the Biodiversity Survey and Assessment Project of the Ministry of Ecology and Environment,China (2019HJ2096001006),and China Biodiversity Observation Networks (Sino BON).
Appendix
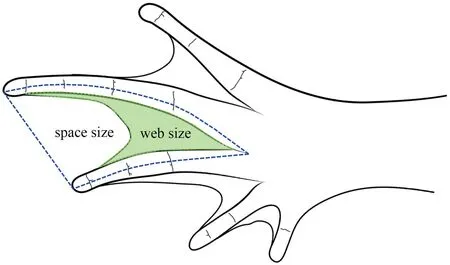
Figure S1 Schematic view of the foot and web area of S.boulengeri.Green area represents webbing size and the dark blue dotted line represents space size between third and fourth toes.Web degree were calculated by web size/space size.
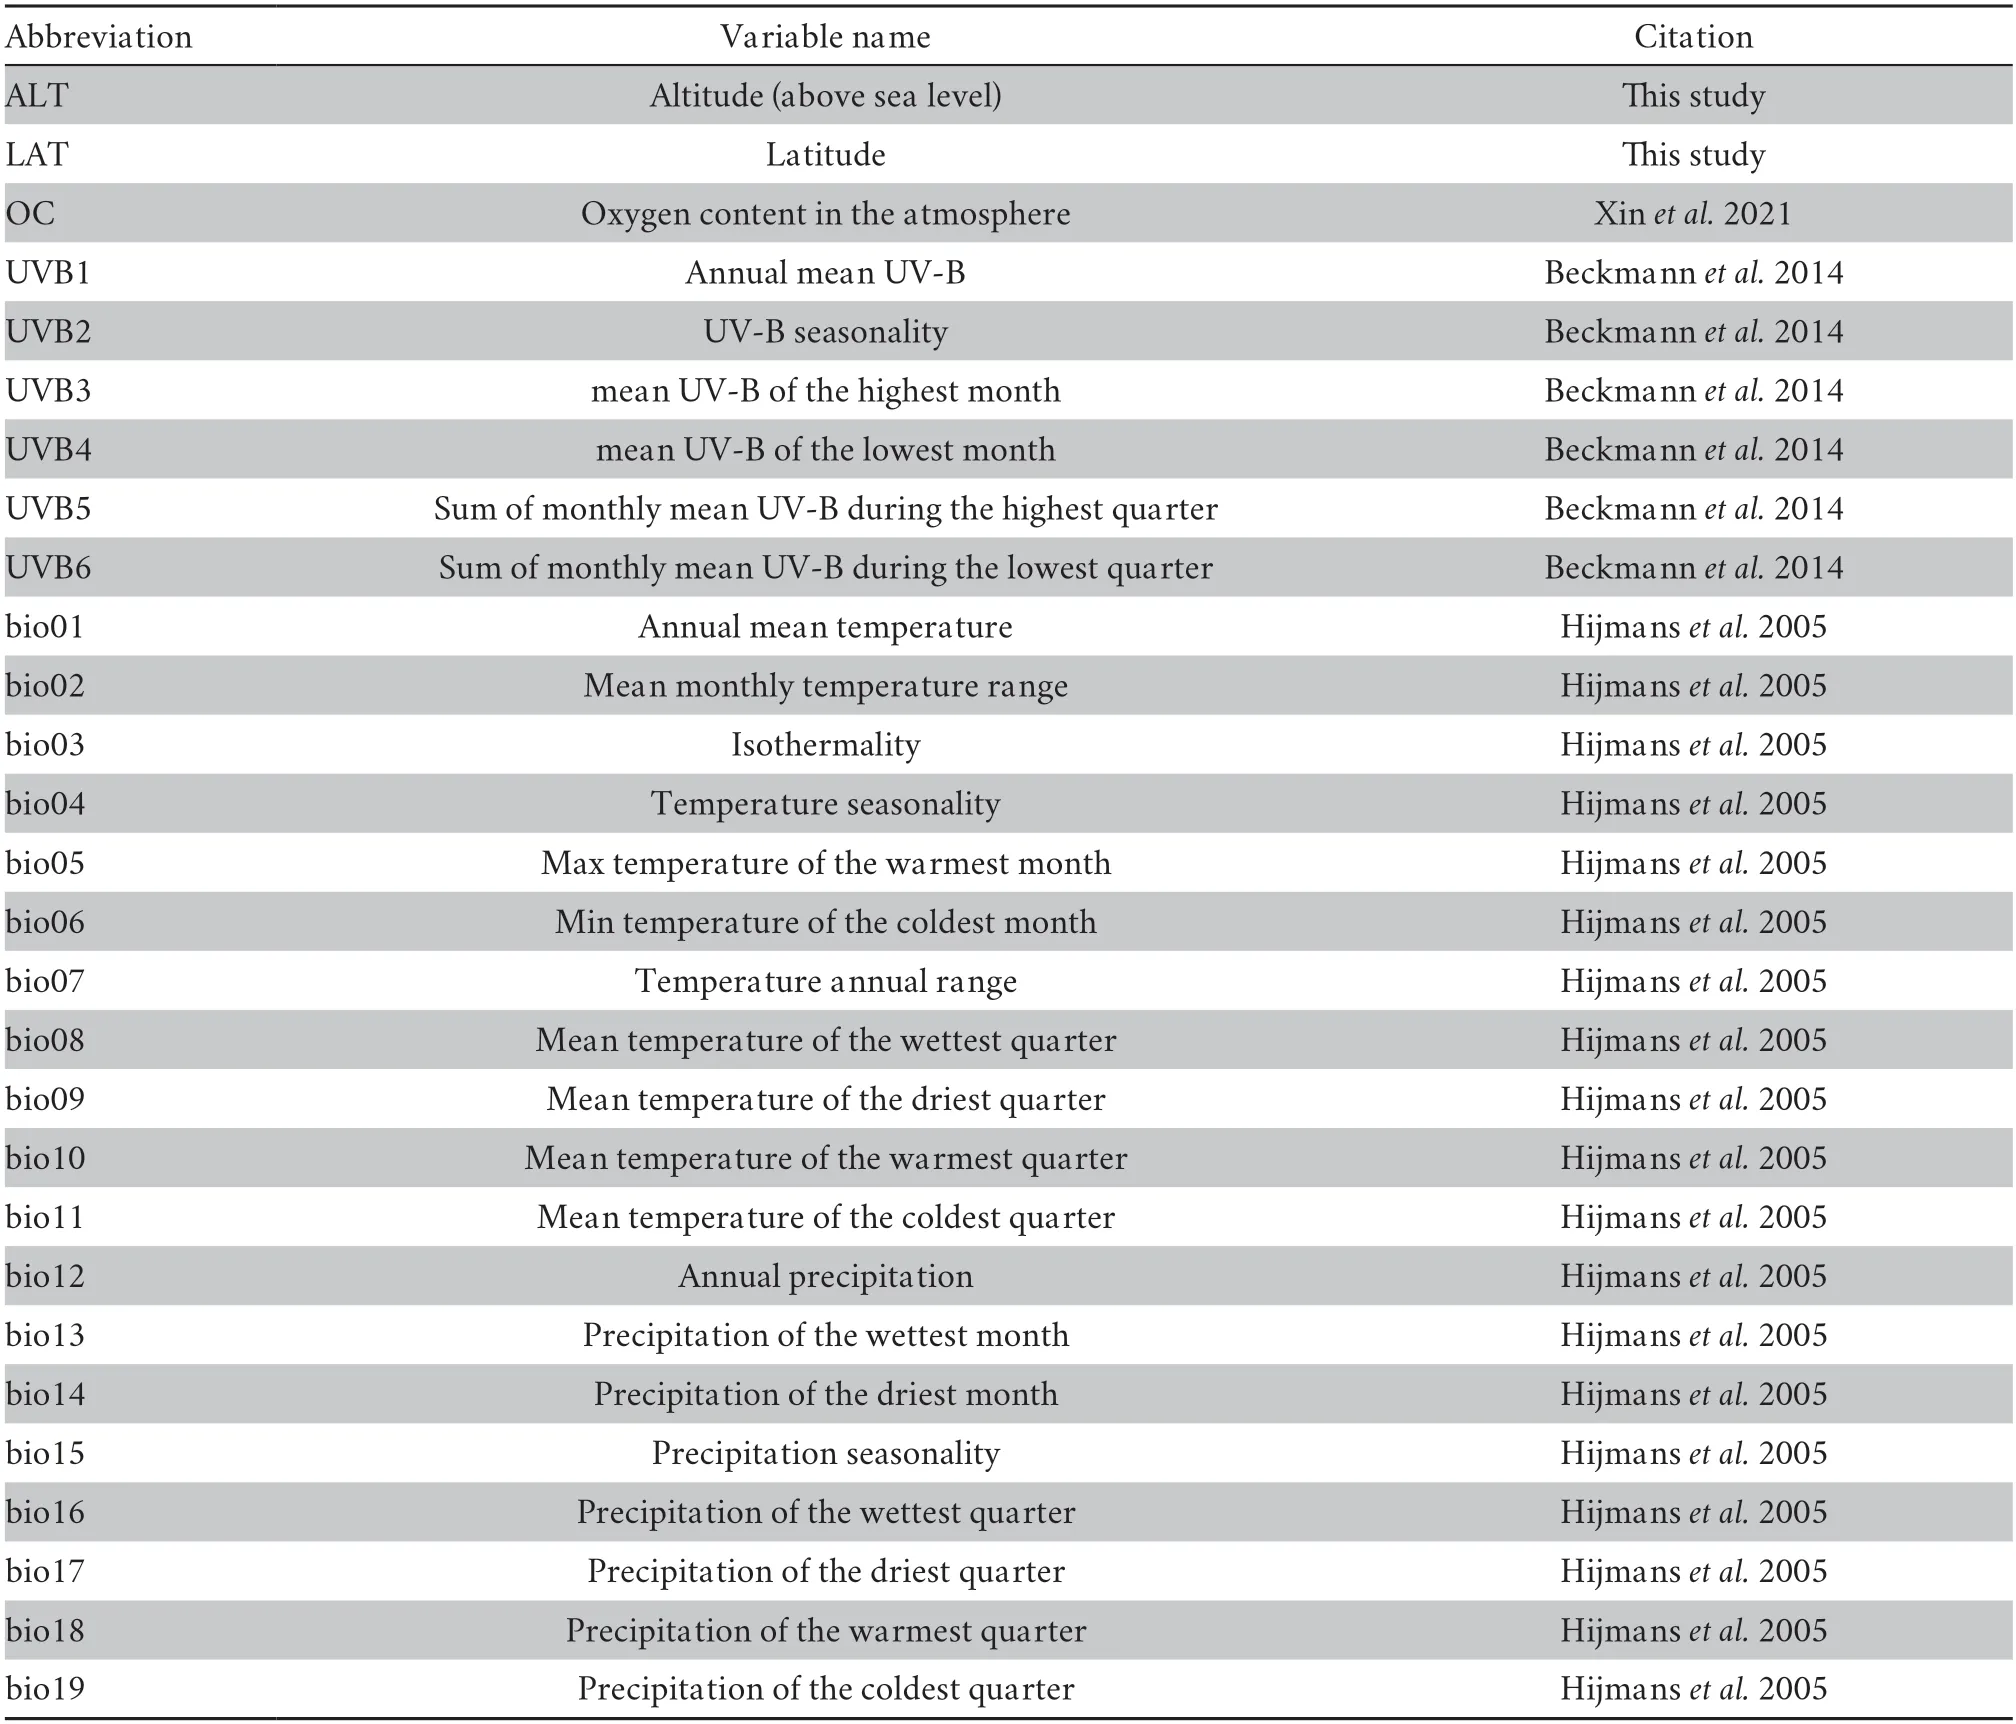
Table S1 Environment data list (except the habitat preference factor).

Table S2 Spearman correlation tests for climate variables (the variables correlation coefficient: |r| <0.7 were retained).

Table S3 General linear regression model results of endocast sizes and body size (SVL).

Table S4 Linear mixed model results of endocast sizes and web degree.
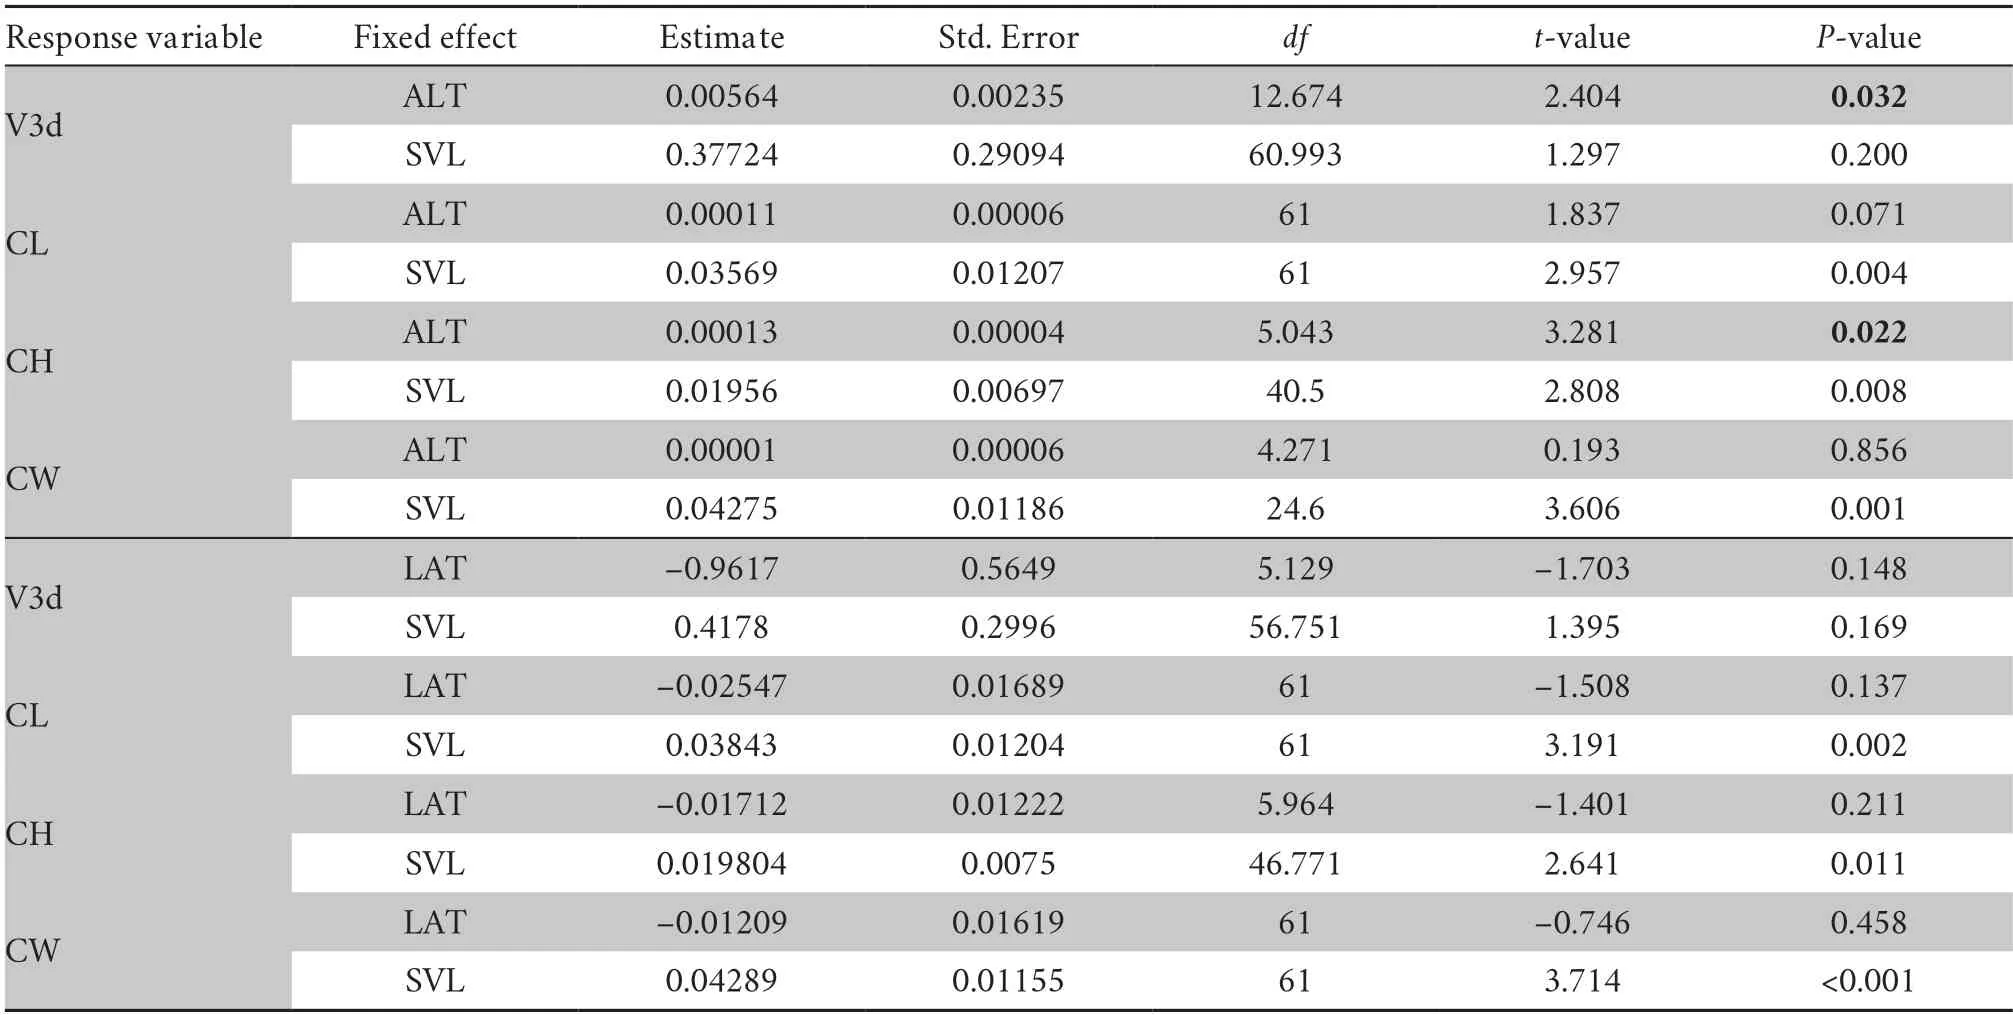
Table S5 Linear mixed model results of endocast sizes and altitude (ALT) and latitude (LAT).

Table S6 Linear mixed model results of endocast sizes and oxygen content (OC).
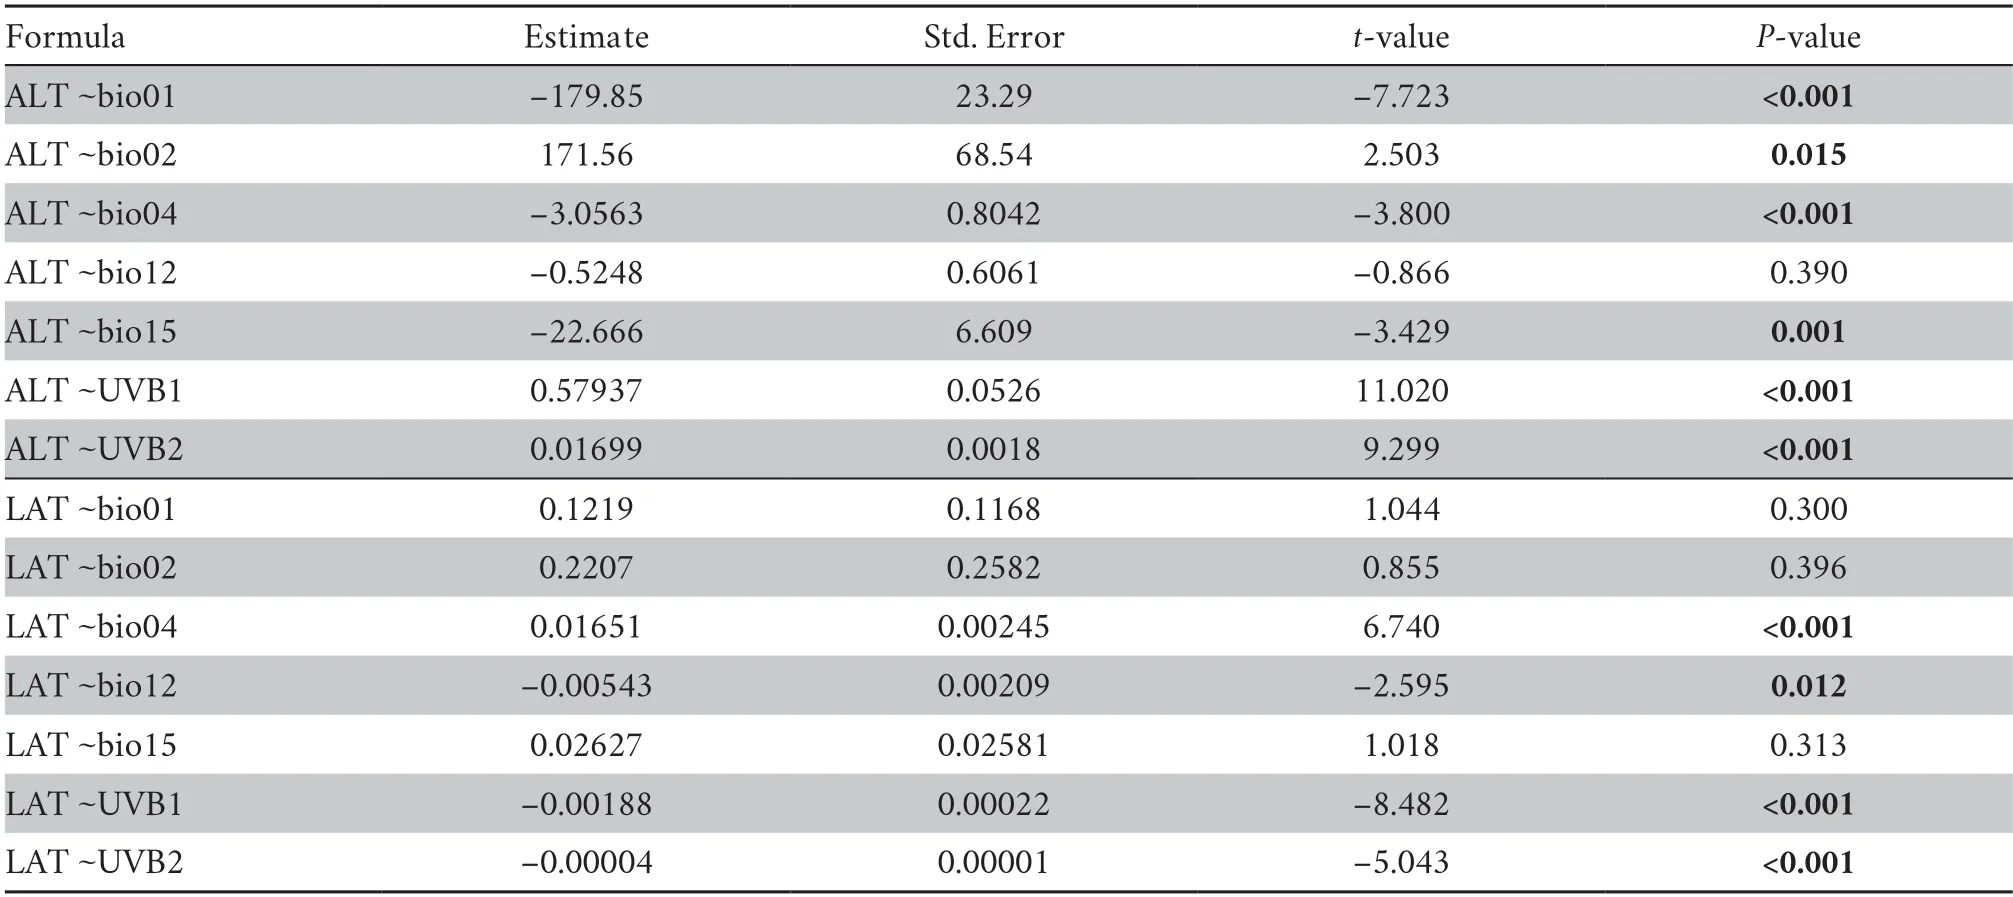
Table S7 General linear regression model results of the correlation between altitude (ALT),latitude (LAT) and selected climate variables,respectively.
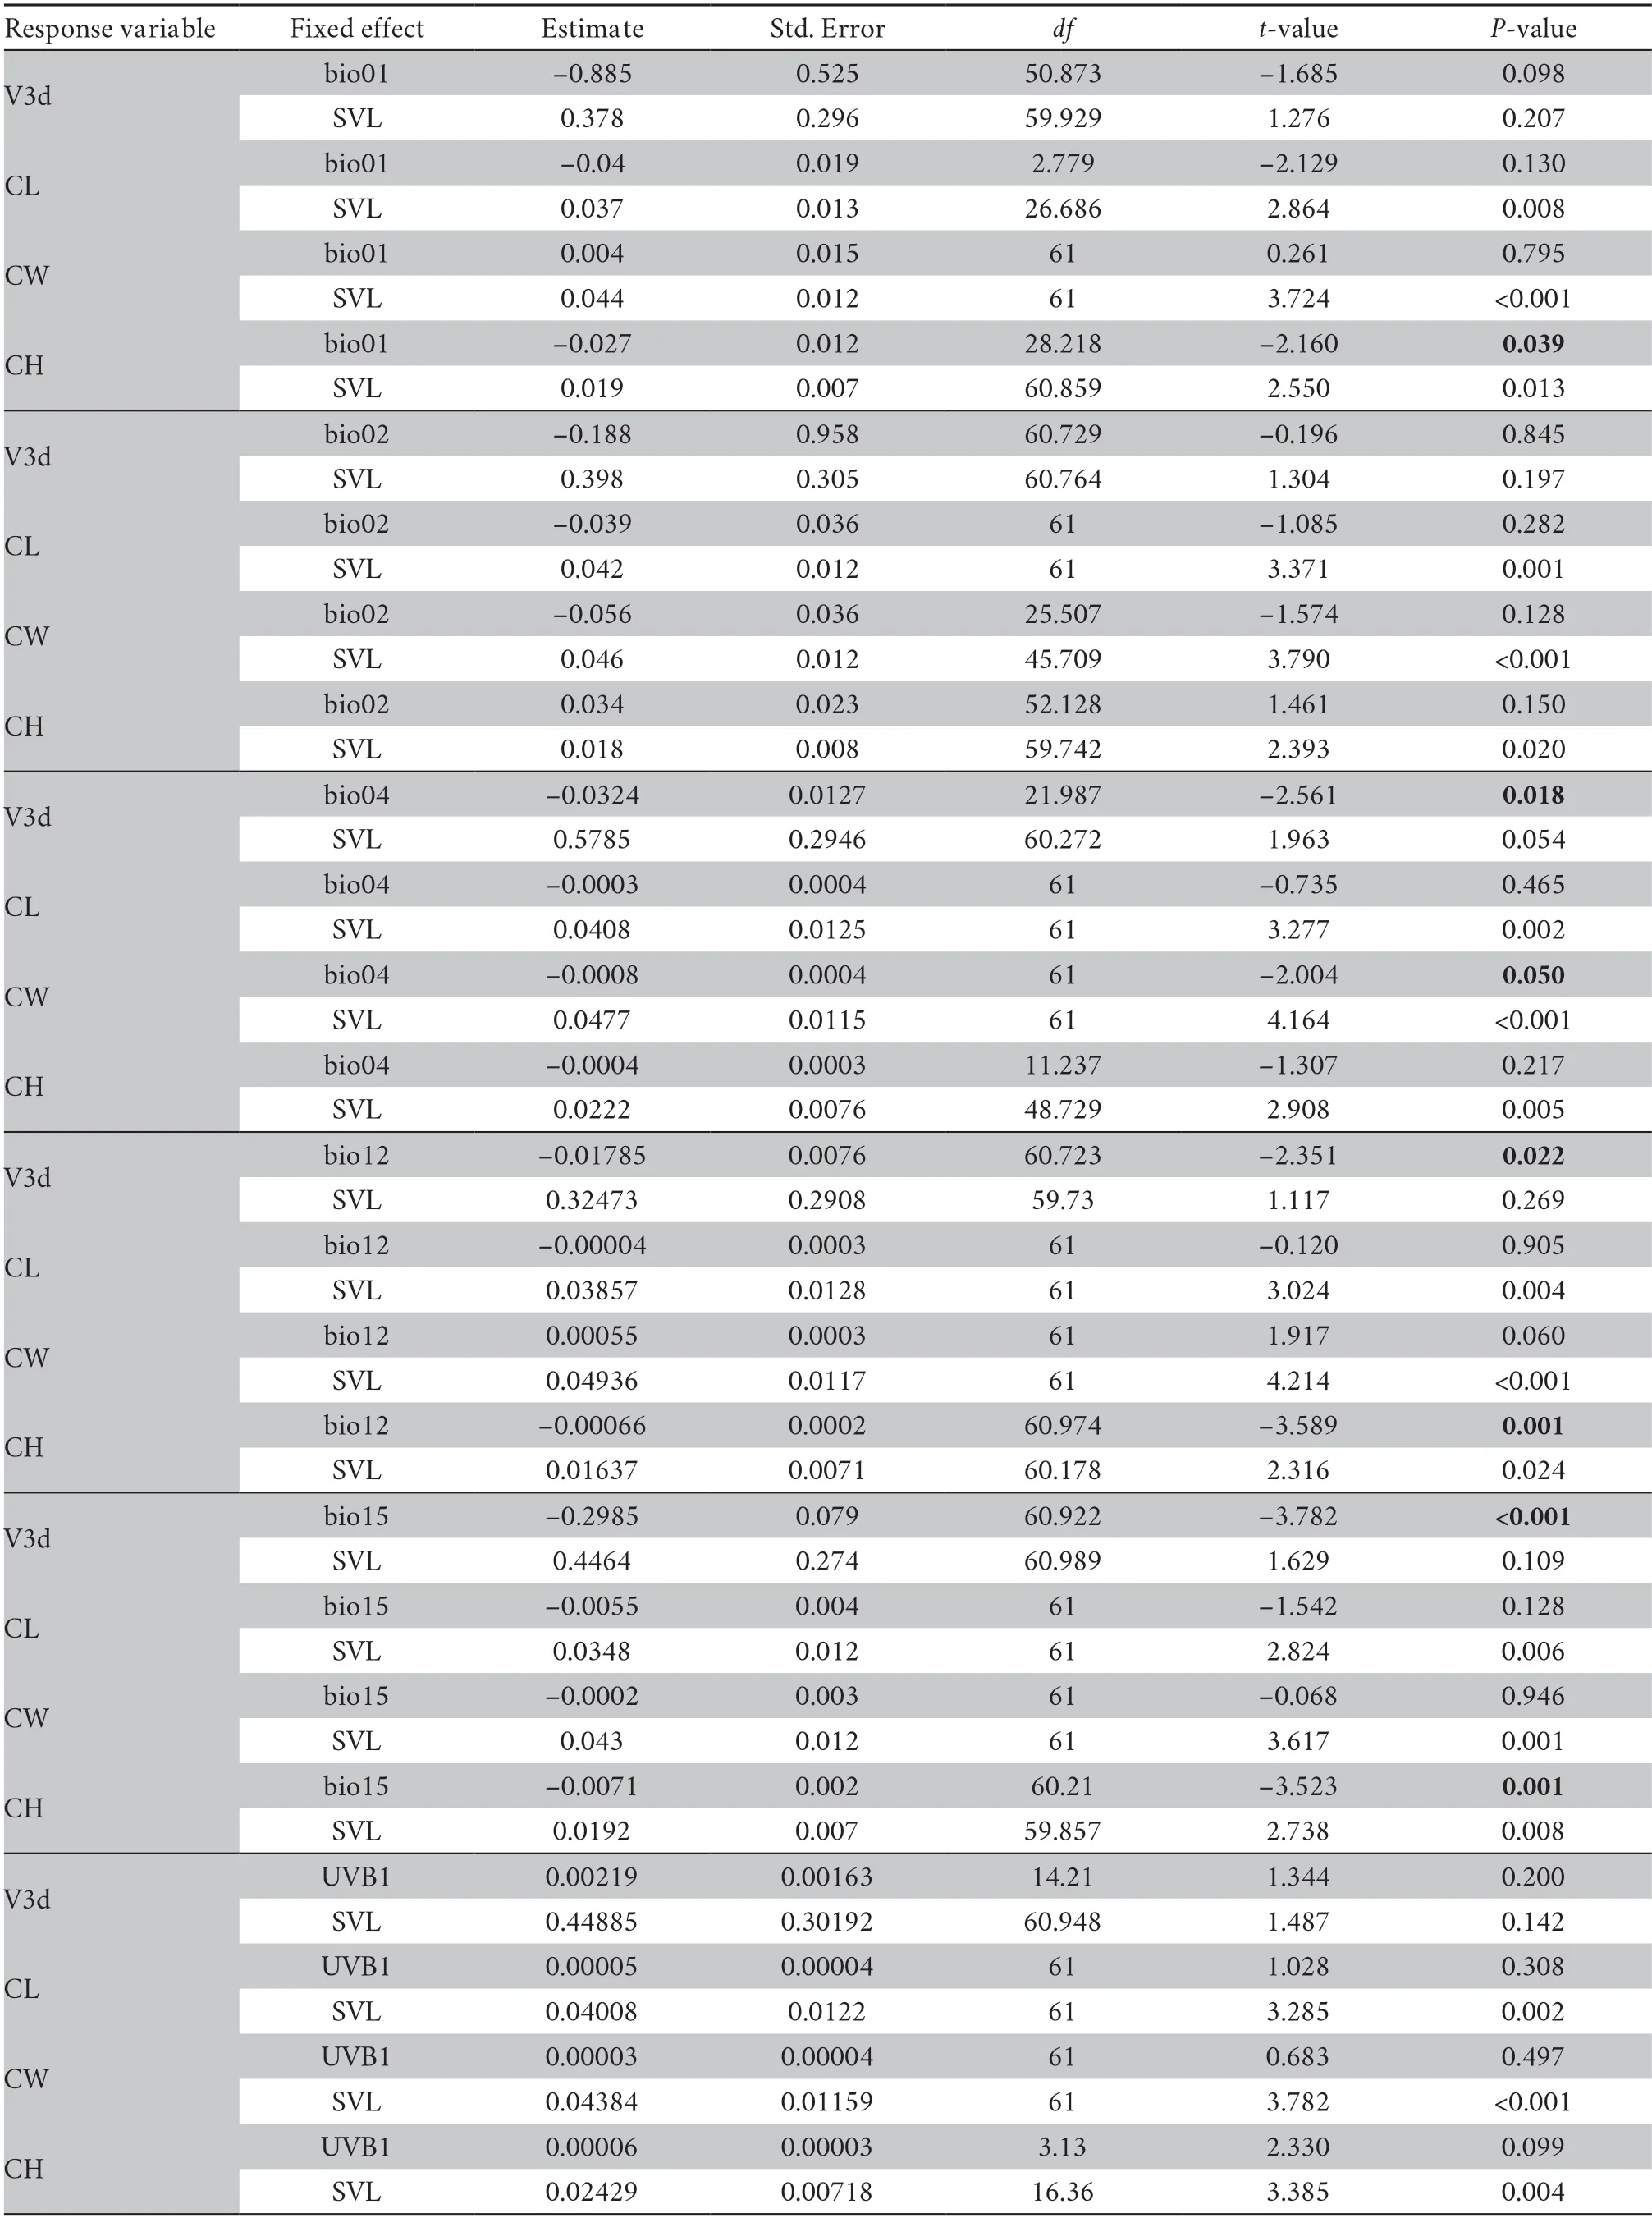
Table S8 Linear mixed model results of endocast sizes and climate variables.

Continued Table S8
杂志排行
Asian Herpetological Research的其它文章
- Three New Species of Diploderma Hallowell,1861 (Reptilia: Squamata:Agamidae) from the Shaluli Mountains in Western Sichuan,China
- Application of eDNA Metabarcoding for Detecting Anura in North China
- Phylogenetic Relationships among Chinese Rice Frogs within the Fejervarya limnocharis Species Complex (Amphibia: Dicroglossidae)
- Lineage Diversification and Niche Evolution in the Chinese Cobra Naja atra(Elapidae)
- Metagenomic Analysis of Mangshan Pit Viper (Protobothrops mangshanensis) Gut Microbiota Reveals Differences among Wild and Captive Individuals Linked to Hibernating Behaviors
- Desertification Drives the Shift in Egg Size-Number Trade-Off in an Agamid Lizard
