Lineage Diversification and Niche Evolution in the Chinese Cobra Naja atra(Elapidae)
2023-01-05XiamingZHUGuanyanZHUShengnanZHANGYuDUYanfuQULonghuiLINandXiangJI
Xiaming ZHU ,Guanyan ZHU ,Shengnan ZHANG ,Yu DU ,Yanfu QU ,Longhui LIN* and Xiang JI
1 Hangzhou Key Laboratory for Ecosystem Protection and Restoration,College of Life and Environmental Sciences,Hangzhou Normal University,Hangzhou 311121,Zhejiang,China
2 Zhejiang Provincial Key Laboratory for Water Environment and Marine Biological Resources Protection,College of Life and Environmental Sciences,Wenzhou University,Wenzhou 325035,Zhejiang,China
3 Hainan Key Laboratory for Herpetological Research,College of Fisheries and Life Science,Hainan Tropical Ocean University,Sanya 572022,Hainan,China
4 College of Life Sciences,Nanjing Normal University,Nanjing 210023,Jiangsu,China
Abstract The role of niche evolution (niche conservatism or niche divergence) in lineage diversification is a poorly studied area.The Chinese cobra Naja atra (Elapidae) has diverged into three lineages: Lineage E in eastern China,Lineage S in southern China and Vietnam,and Lineage W in western China.However,whether the ecological niche is conserved or divergent among these three lineages is unknown.In the present study,we used ecological niche models in geographical space to study the ecological differences among lineages.We compared the niche overlap in environmental space to test niche conservatism and niche divergence.Our results showed that the three lineages of N.atra shared an ecological niche space between Lineages E and S/W,with the climatic niches of Lineages S and W representing a specialized fraction of the climatic niche of Lineage E.We speculated that the niche divergence between Lineages S and W was a consequence of geographical barriers limiting gene flow.Our study provides evidence for lineage diversification associated with both geographical isolation and climatic niche evolution,suggesting that early niche divergence between Lineages S and W,followed by niche conservatism,causes niche divergence among lineages.
Keywords climatic niche, Elapidae,Naja atra,niche conservatism,niche divergence
1.Introduction
Ecologists and evolutionary biologists are interested in the role of the ecological niche (niche conservatism or niche divergence)in lineage diversification,but the topic remains a poorly studied area (Wiens and Graham,2005;Zink,2014;Serra-Varelaet al.,2015).Niche conservatism is the tendency of species or lineages to retain ancestral ecological niche characteristics (Petersonet al.,1999).Sister populations segregated by unsuitable habitats while occupying a similar niche may undergo allopatric speciation because of restricted gene flow (Wiens and Graham,2005).For example,inDioon merolae(a tropical gymnosperm of the order Cycadales),unsuitable habitats impede gene flow,make populations experience different demographic histories and ecological conditions,and promote speciation via allopatric lineage divergence (Gutiérrez-Ortegaet al.,2020).Niche divergence may cause populations to adapt to different local conditions along an environmental gradient (Hua and Wiens,2013;Costionet al.,2015;Grayet al.,2019).For example,niche divergence combined with phenotypic adaptation promotes lineage diversification between the subspecies of the Clemente Bell’s sparrowArtemisiospiza belli(Cicero and Koo,2012).In tropical salamanders,niche divergence occurs along elevational gradients (Kozak and Wiens,2007).Niche divergence(ecological speciation) and niche conservatism (mutation-order speciation) are two general mechanisms of speciation,and there is a continuum of niche evolution during speciation,with divergence and conservatism being at the extremes (Ratoet al.,2015;Suárez-Atilanoet al.,2017;Velascoet al.,2018).
The role of environmental factors in lineage diversification and speciation can be assessed by quantifying niche overlap(including niche equivalency and niche similarity tests,Warrenet al.,2008;Broennimannet al.,2012) between two species or geographically separated populations of the same species(Ahmadzadehet al.,2013;Huet al.2016;Suárez-Atilanoet al.,2017;Maia-Carvalhoet al.,2018;Gutiérrez-Ortegaet al.,2020;Zhuet al.,2021).Niche equivalency test is used to determine niche divergence by assessing whether the niches of two species or lineages are equivalent (Broennimannet al.,2012).Niche similarity test is used to determine niche conservatism by examining whether the niches of two species or lineages are more similar than what is expected by chance (Broennimannet al.,2012).In addition,ecological niche modelling (ENM),which combines environmental data (e.g.,temperature,precipitation)and spatial data,can be used to predict the potential distribution of a species and assess niche differentiation (Peterson 2001;Huet al.2016;Suárez-Atilanoet al.,2017;Grayet al.,2019;Gutiérrez-Ortegaet al.,2020).Niche overlap analysis is used to assess niche equivalency and niche similarity in environmental space,and ENM analysis is mainly used to predict geographical distributions.
The Chinese cobra (Naja atra) is a widely distributed elapid snake that ranges from the south of the Yangtze River(southeastern China) to northern Vietnam and Laos.Several mountains (the Wuyi,Luoxiao,and Nanling Mountains) and water bodies (Taiwan Haixia and Qiongzhou Haixia) within the range ofN.atrapossibly limit gene flow and influence population structure.Based on microsatellite and mitochondrial data,researchers previously identified three lineages ofN.atraon the mainland: Lineage E (populations in eastern China),Lineage S (populations in southern China and Vietnam),and Lineage W (populations in western China) (Linet al.2012,2014).However,whether these three lineages adapt to local environments or retain an ancestral niche remains unknown.To determine whether niche is conserved or divergent among the three genetically divergent lineages ofN.atra,we first performed ENM analyses in geographical space to study the degree of ecological differences among lineages,and then performed equivalency and similarity tests in environmental space to compare the niche overlap (Figure S1).
2.Materials and methods
2.1.Obtaining locality and climate dataOccurrence records were gathered from our own field investigation,VertNet(http://www.vertnet.org/index.html),Global Biodiversity Information Facility (https://www.gbif.org/) and published papers (Ji and Wang,2005;Linet al.,2012,2014).Of the 609 occurrence records,549,48,and 12 were from Lineages E,S,and W,respectively.To reduce the effect of spatial autocorrelation,we chose the minimum non-significant autocorrelated spatial distance (the average value found per environmental variable)that thins occurrence records by assessing their climatic dependence at different spatial distances for each environmental variable (Assis’code from https://github.com/jorgeassis).We extracted one occurrence per 32 km for each lineage using“spThin” package (Aiello-Lammenset al.,2015) in R 3.6.2 (R Development Core Team,2019),which also eliminated the interference of unequal sampling.We obtained 96 occurrence records for subsequent analyses,with 36 from Lineage E,17 from Lineage S,and 11 from Lineage W (Figure 1).
The climate variables of each georeferenced locality were extracted using ArcGIS 10.5 from climate layers with a 30" (1.0× 1.0 km) resolution downloaded from the WorldClim database 2.1 (http://www.worldclim.org/data/worldclim21.html).The climate variables considered included altitude,Bio1-19,solar radiation,wind speed,and water vapor pressure (Table S1).
To choose the optimal environmental factors and eliminate the disturbance of highly correlated variables before prediction,we tested all 23 climatic variables for the Pearson correlation coefficient (r) and Variance Inflation Factor (VIF,avoiding potential collinearity problems).If |r| ≥ 0.8 or VIF ≥ 5 between two variables,we kept the biologically more outstanding one(e.g.mean temperature instead of the minimum temperature of the coldest month).Based on this criterion,altitude (Alt),solar radiation (Srad),wind speed (Wind),three temperature variables (Bio1,Bio2,and Bio4),and four precipitation variables(Bio12,Bio15,Bio17,and Bio18) were used for further analysis.

Figure 1 Sampling locations for the three lineages (Lineages E,S,and W) of N.atra.
2.2.Comparing niches in geographical spaceWe first used“ENMeval” package (Muscarellaet al.,2014;Kasset al.,2021)to optimize model parameters,including feature classes (FCs)and regularization multipliers (RM).Higher RM values limit model complexity,resulting in simpler model predictions.Five FCs can be used in MaxEnt (maximum entropy modelling):Linear (L),Quadratic (Q),Product (P),Threshold (T),and Hinge(H) features.According to Radosavljevic and Anderson (2014)and Lowet al.(2021),we evaluated three types of model fits: 1)“RM-only”,using LQPH features and ten RM values,ranging from 0.5 to 5 with increments of 0.5;2) “RM+Hinge”,using H features and ten RM values;3) “full-tuning”,using eight FC combinations (L,LQ,LQP,H,HQ,HQP,LHQ,and LHQP)and ten RM values.To reduce the spatial autocorrelation among records,we used a block method to partition occurrence records and background points into train and test bins.ENMeval provides five evaluation metrics to select the optimal model,and they include: the area under the receiver operating characteristic curve (AUC) calculated by testing data(AUCtest),the difference between AUC values calculated by training and testing data (AUCdiff),the threshold-dependent 10% training omission rate (OR10),the threshold-dependent minimum training presence omission rate (ORmtp),and the Akaike’s Information Criterion corrected for small samples sizes (AICc).Model parameters selected by the lowest AIC value may generate inaccurate geographical prediction (Velasco and González-Salazar,2019).Low overfitting (minimum OR10or AUCdiff) and high discriminatory ability (maximum AUCtest)are widely used to select optimal model parameters (Lowet al.,2021;Zhanget al.,2021).The geographical prediction was fairly inaccurate for Lineage W (AUCtraining=0.513,AUCtest=0.496) using the lowest OR10value as the primary criterion and the highest AUCtestvalue as the second criterion to select parameters.Therefore,we used AICc to select the best model fitting for each lineage.Such a model performs better when selecting parameters for smaller sample sizes (Radosavljevic and Anderson,2014;Chouet al.,2020).
We then used MaxEnt 3.4.1 to predict the potential distribution ofN.atrabased on optimized model parameters evaluated by ENMeval.The optimized model parameters were as follows: Hinge features and a regularization multiplier setting of 3.5 for Lineage E;LQ features and a regularization multiplier setting of 3.5 for Lineage S;and LQ features and a regularization multiplier setting of 2.5 for Lineage W (Table S2).We used 75% of occurrences as training data,and 25% as random test data.We selected the knife method (Jackknife) to measure variable importance,with a convergence threshold of 1 × 10⁻⁵with 5000 iterations.Each analysis was replicated 15 times.We converted the distribution area into binary (presence or absence) rasters using 10 percentile training presence Logistic threshold.We assessed the accuracy of models using AUCtrainingand AUCtestvalues,and 10 percentile training presence test omission rates (ORtest).
Finally,we used the overlap index (OI%) and interpredictability percentage (IP%) to evaluate the degree of differentiation in geographical space.The overlap index of each lineage pair was used to evaluate the extent of the geographical area shared by lineage pairs.We calculated this index based on the proportion of the shared area of a lineage pair in the potential geographical area of each lineage.In addition,we used inter-predictability percentage to assess the ability to predict the potential distribution of other lineages based on environmental variables in the geographical area of this lineage.We calculated this percentage based on the proportion of occurrences distributed in potential geographical areas of other lineages in the total occurrences of this lineage.
2.3.Comparing niches in environmental spaceWe used principal components analysis (PCA) to compare the niches of each lineage pair in the same environmental space.Occurrence density was calculated along the first two axes of PCA with a resolution of 100 × 100 cells.We calculated Schoener’sDmetric using a kernel smoothing method to measure niche overlap between lineages,which varies from 0 (no overlay) to 1 (complete overlay) (Warrenet al.,2008;Broennimannet al.,2012;Di Colaet al.,2017).We calculated the proportion of the densities in the distribution overlap of a lineage with the niche of another lineage to quantify niche changes (niche stability,niche expansion,or niche unfilling) (Petitpierreet al.,2012;Guisanet al.,2014).If the proportion of the niche overlap of a lineage with the niche of another lineage is small,the niche of the lineage is considered unfilled.
We used the niche equivalency test to examine whether the niches of lineages were equivalent.If the observedDvalue is lower than 95% of the simulated values,the null hypothesis can be rejected,indicating that the niches of two lineages are distinct(divergence).We also used the niche similarity test to examine whether lineage niches were more similar than expected by chance.If the observedDvalue is greater than 95% of the simulated values,the null hypothesis can be rejected,indicating that the niches of two lineages are similar (conserved).We used a one-sided niche similarity test,which compared the observedDvalue with simulatedDvalues between the niche of one lineage and random niches of another lineage.We assessed statistical significance based on 100 randomizations.We performed all statistical analyses in R 3.5.3 using “ecospat”package (Broennimannet al.,2012;Di Colaet al.,2017).
3.Results
3.1.Ecological niche modelling and projectionsThe diagnostic results of the partial ROC (receiver operating characteristic) curve showed that MaxEnt models had relatively high accuracy (Lineage E: AUCtraining=0.916,AUCtest=0.917,ORtest=0.119;Lineage S: AUCtraining=0.940,AUCtest=0.924,ORtest=0.183;Lineage W: AUCtraining=0.744,AUCtest=0.706,ORtest=0.133) (Figure 2).For the relative contribution of environmental factors to the MaxEnt model based on permutation importance,the results showed that: wind speed(Wind,60.6%) and altitude (Alt,22.7%) made the greatest relative contributions to the distribution of Lineage E;mean diurnal range (Bio2,58.3%),temperature seasonality (Bio4,20.5%),and annual mean temperature (Bio1,19.4%) made the greatest relative contributions to the distribution of Lineage S;and wind speed (42.4%) and solar radiation (Srad,42.1%) made the greatest relative contributions to the distribution of Lineage W (Table 1).MaxEnt model predicted three lineages that differed in geographical distribution (Figure 2): Lineage E was mainly distributed in southeast China including most regions of two island provinces (Hainan and Taiwan),Lineage S was restricted to southern China and Vietnam,and Lineage W was mainly distributed in the western Luoxiao Mountains and the northern Nanling Mountains.The geographical overlap (OI%)and inter-predictability (IP%) indexes of Lineage E to Lineage S(OI%: 63.6%;IP%: 82.4%) were higher than those of Lineage S to Lineage E (OI%: 28.9%;IP%: 58.3%).High values of OI% and IP%indexes showed substantial potential sympatry,as predicted in the lineage pair E-S,whereas sympatric areas were very narrow in pairs E-W (OI%: 5.0–8.8%;IP%: 9.1–13.9%) and S-W(OI%: 1.4–5.2%;IP%: 0%;Table 2).
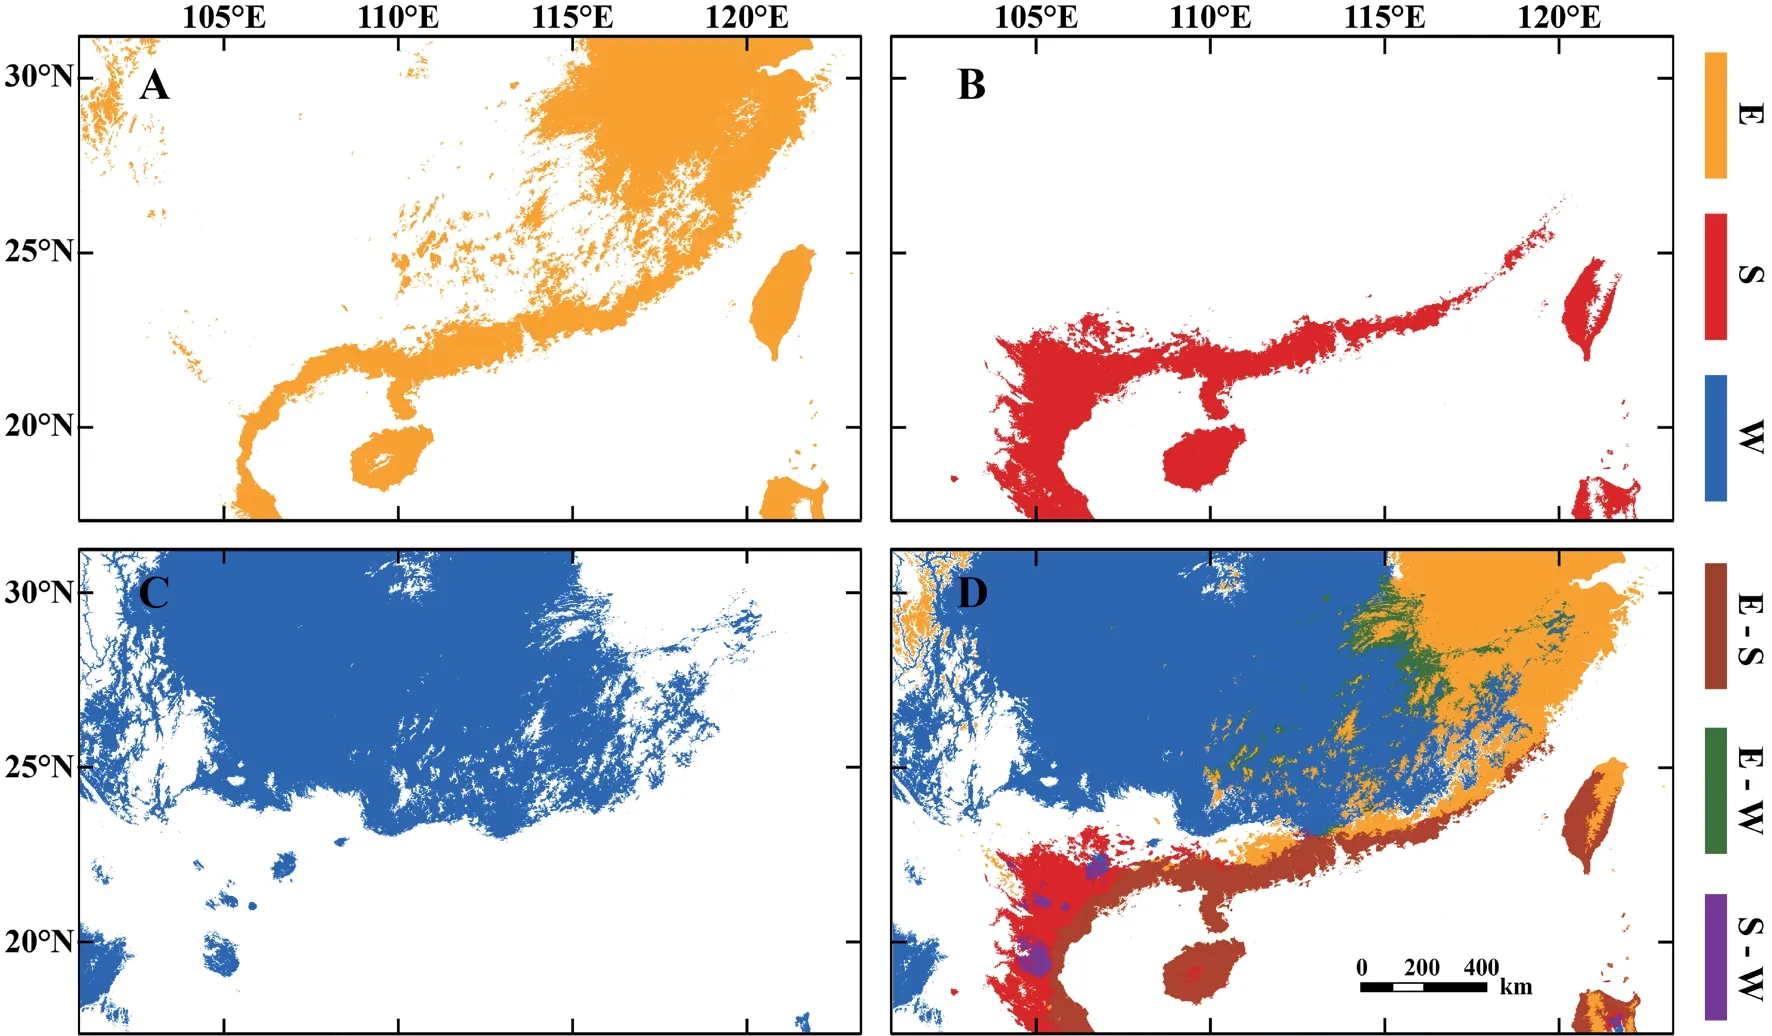
Figure 2 Predicted environmental suitability based on MaxEnt in geographical space for the three lineages of N.atra.Plots A-C show potential distributions of Lineages E (yellow),S (red) and W (blue),respectively;Plot D shows potential sympatric areas of lineage pairs E-S(brown),E-W (green),and S-W (purple).
3.2.Ecological niche characteristicsPCA showed that the first two principal components explained 61.7% of the environmental variance (Figure 3).The first principal component had high positive loadings for mean diurnal range(Bio2) and temperature seasonality (Bio4),and a high negative loading for precipitation of warmest quarter (Bio18).The second principal component had high positive loadings for precipitation seasonality (Bio15) and Bio2,and high negative loadings for precipitation of driest quarter (Bio17),wind speed,and annual precipitation (Bio12).
Niche overlap between Lineages E and S (D=0.19) was higher than that between Lineages E (or S) and W (E-W:D=0.04;S-W:D=0.01;Table 3,Figure 3).The niche stability of Lineage E was high in all comparisons (E to S: 0.93;E to W:0.87;Table 3).The niche stability of Lineage S and Lineage W was low,indicating that the niches of Lineages S and W were expanded (Table 3).The niche equivalency tests showed that the niches of the three lineages were not identical (allP<0.05;Table 3).The niche similarity tests showed that the niches of Lineages S (P<0.01;Table 3) and W (P=0.02;Table 3) were more similar than what was expected by chance to the niche of Lineage E,but not vice versa (allP>0.05;Table 3).For Lineages S and W,niche overlap fell within the 95% confidence limits of the null distributions (P>0.05,Table 3).
4.Discussion
Niche evolution plays a key role in explaining the observed lineage diversification and distribution patterns (Jiménez-Valverdeet al.,2009;Costionet al.,2015;Suárez-Atilanoet al.,2017;Sbragagliaet al.,2019).In this study,we tested whether niche conservatism or niche divergence occurred between lineages inN.atra,using ENM analyses (MaxEnt) and ecological niche comparison techniques from two perspectives (in geographical and ecological space).We found that: 1) the three lineages ofN.atraencompassed distinct geographical areas,with spatial overlap between Lineages E and S;2) Lineages E and S shared some ecological niche space,and so did Lineages E and W;3) niche divergence occurred between Lineages S and W.
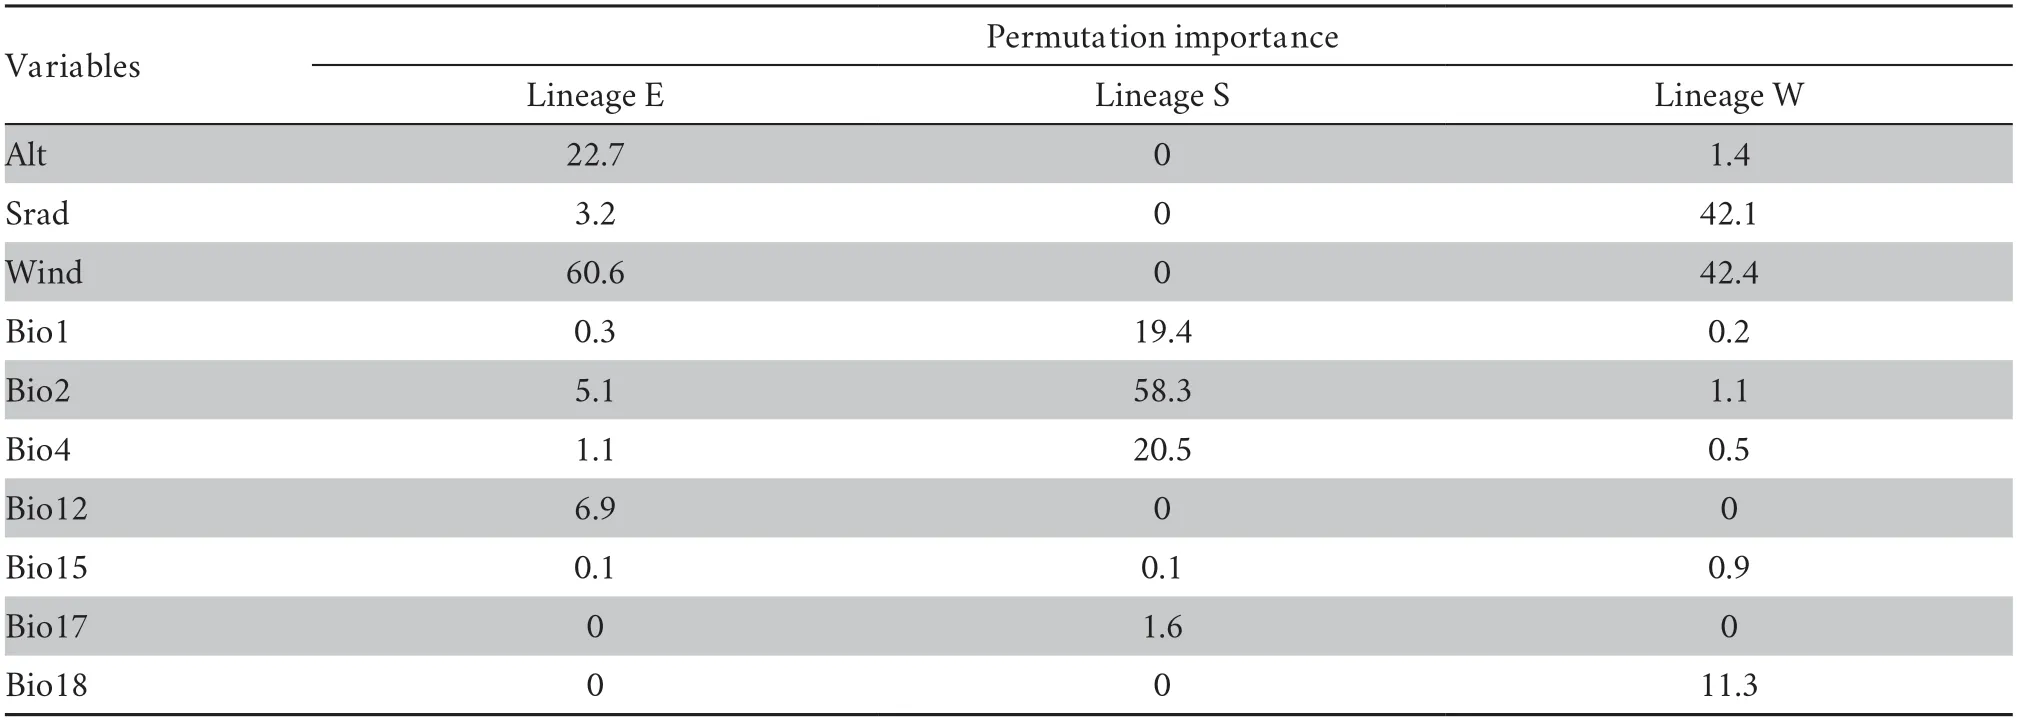
Table 1 Estimates of the relative contribution of the environmental variables to the distribution pattern based on MaxEnt for Lineages E,S,and W.
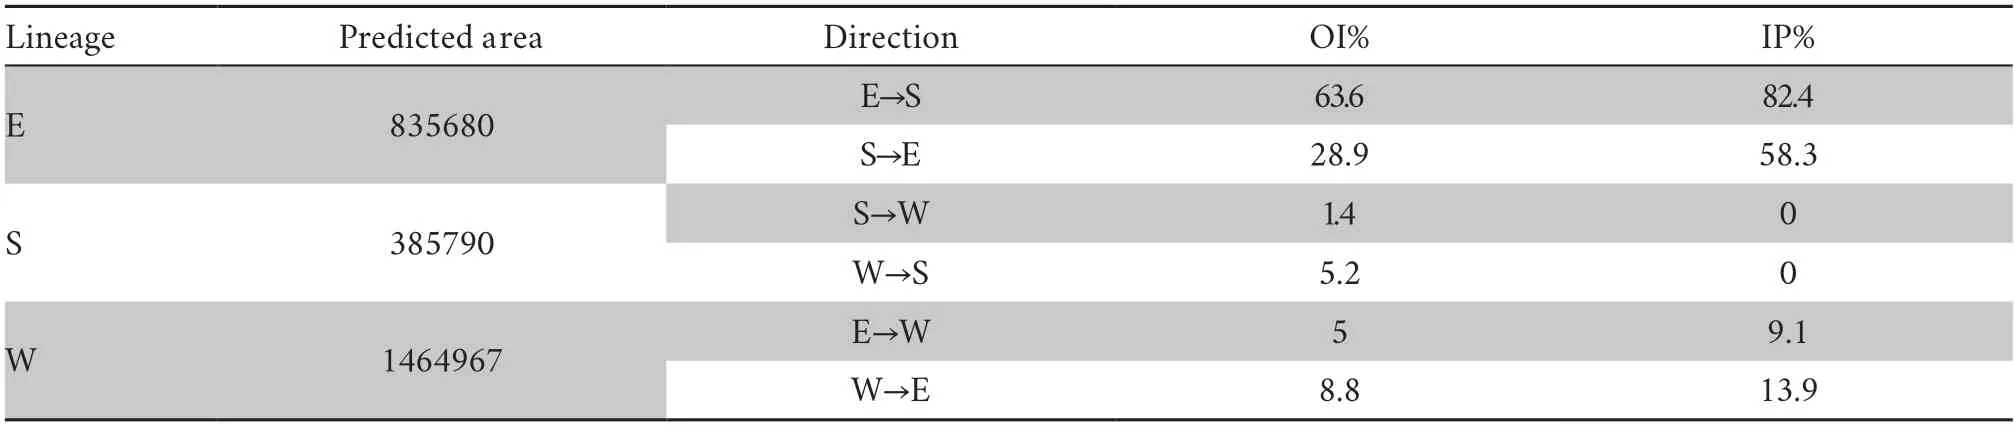
Table 2 Geographical overlap (OI%) and Inter-predictability (IP%) indexes among lineage pairs estimated basing on predicted area (number of pixels).
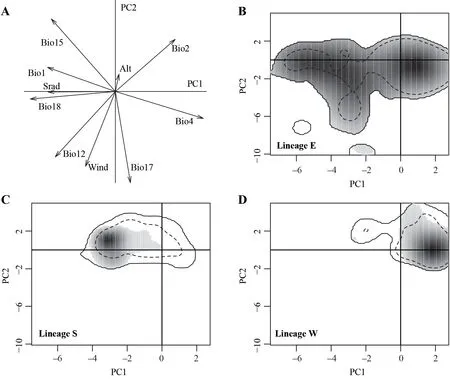
Figure 3 Niche of three lineages of N.atra in environmental space produced by principal component analysis (PCA-env).Plot A represents the contribution of the climatic variables on the first two axes of the PCA-env,Plots B-D represent the occurrence density surfaces for Lineages E S,and W.The solid and dashed contour lines illustrate,respectively,100% and 50% of the available (background)environment.
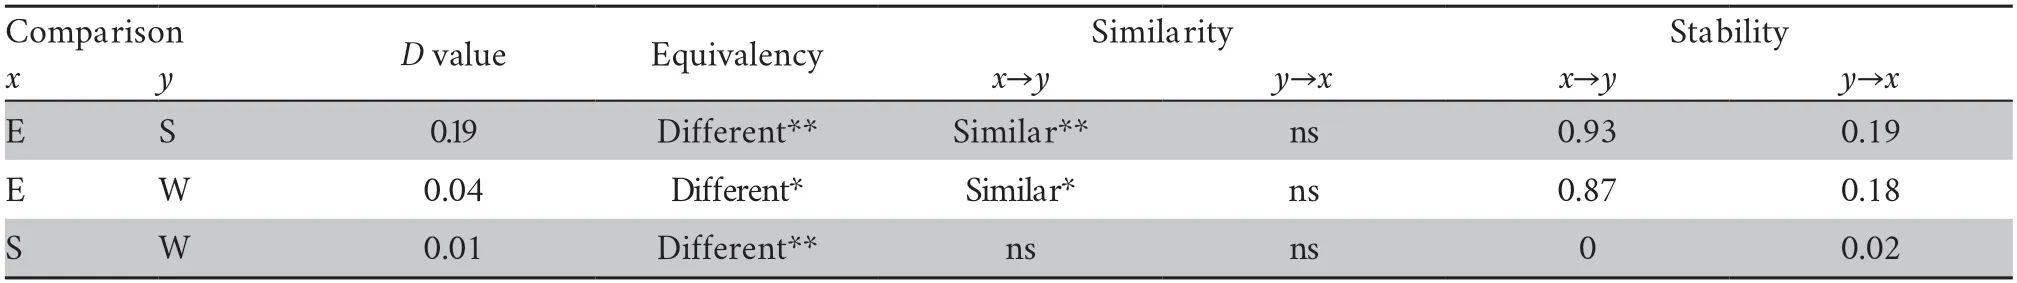
Table 3 Results of niche overlap (D),stability,niche equivalency,and niche similarity tests.
4.1.Geographical and ecological overlap between Lineages E and SThe three lineages ofN.atrawere predicted to encompass distinct geographical areas,with a spatial overlap(high level of OI%) between Lineages E and S across the coast of Vietnam and southern China (Figure 2).The potential contact zone indicated two lineages occupied similar environmental conditions,suggesting a pattern of niche conservatism (Kalkviket al.,2012).The high values of asymmetrical inter-predictability between Lineages E and S suggest that the two lineages retain certain ancestral ecological traits,which has been seen in other taxa including plants (Raxworthyet al.,2007) and squamate reptiles (Aguirre-Gutiérrezet al.,2015;Suárez-Atilanoet al.,2017).Lineages E and S shared ecological niche space but not all ecological variables.This finding is consistent with those reported forBoa imperator(Suárez-Atilanoet al.,2017) andCampylopus introflexus(Gamaet al.,2017).The ecological niche of Lineage S represented a specialized fraction of the entire ecological space of the climatic niche of Lineage E,with warmer conditions and more substantial precipitation seasonality(Figure 3).Lineage E showed local adaptation to colder conditions with more precipitation (Figure 3),expanding to the northern limit of its range (Ji and Wang 2005;Linet al.,2012).Naja atrahas never been found to thermoregulate at ambient(air) temperatures lower than 15°C (Jiet al.,2002),suggesting that thermal conditions play a key role in the niche evolution of this species.There has been evidence that temperature niche breadth is dominated by within-locality temperature variation in terrestrial elapid snakes includingN.atra(Linet al.2019).
4.2.Niche divergence between Lineages W and SBased on ENM analyses,Lineage W was predicted to occur in the western China,which is far away from the ocean and has more significant temperature seasonality and less precipitation than the distribution area of Lineage S.Similar to the ENM results,Lineages S and W occupied different ecological space with low niche overlap and stability,indicating expanded niches in environmental space.Niche equivalency tests indicated that the niche of Lineage W was distinct from that of Lineage S,which is characterized by drier conditions and greater temperature seasonality.Lineage W occupied a different climatic niche and was separated from Lineage S by the Nanling Mountains,which are an important physical barrier limiting gene exchange between Lineages S and W (Linet al.,2012;Linet al.,2014).Lineages separated by geographical barriers differed ecologically,confirming the role of these barriers in niche divergence (Grahamet al.,2004;Raxworthyet al.,2007;Maia-Carvalhoet al.,2018).
4.3.Three scenarios for niche divergence among lineagesThere are three main scenarios for niche divergence among lineages (Engleret al.,2021): 1) dominance of ecological speciation,where each lineage occupies a subset of ancestral niche when adapting to different selective pressures;2) ecological speciation followed by mutation-order speciation,where a high level of niche divergence is followed by niche conservatism;3)mutation-order speciation followed by ecological speciation.A complex mode of niche evolution may be associated with lineage diversification or speciation,rather than a single process of niche conservatism or niche divergence.For example,a niche continuum process (niche conservatism and niche divergence) occurred across time and space in CaribbeanAnolislizards: niche divergence occurred early in the radiation of the species,and niche conservatism played a role in driving insular endemism (Velascoet al.,2018).
Niche similarity and niche equivalency tests in this study showed both niche conservatism (that is,the ecological niche space of Lineage E almost covers that of Lineages S and W,Figure 3) and niche divergence (especially between Lineages S and W,Figure 3).Lineages S and W share the ecological niche space of Lineage E,indicating niche conservatism plays a role in driving late lineage diversification.The niches of Lineages E and S/W are similar but not equivalent,suggesting that Lineages E and S/W have a different set of variables within the ecological niche space restricting their distribution.Lineage E (the youngest lineage) diverged from the other two lineages 0.363 million years ago,according to the phylogenetic result(Linet al.,2014).From what has been discussed above,we may reasonably conclude that the process for niche differentiation in our case fits the second scenario: ecological speciation followed by mutation-order speciation,where a high level of niche divergence between Lineages S and W is followed by niche conservatism between Lineages E and S/W.
5.Conclusions
The three lineages ofN.atraencompass distinct habitats,and spatial overlap exists between Lineages E and S.The three lineages underwent significant niche shifts,while also sharing ecological niche space between Lineages E and S/W.The climatic niches of Lineages S and W represent a specialized fraction of the climatic niche of Lineage E,with warmer and more significant precipitation seasonality.Niche divergence exists between Lineages S and W as a consequence of geographical barriers that limit gene flow.Our study provides evidence for lineage diversification associated with both geographical isolation and climatic niche evolution,suggesting that early ecological speciation between Lineages S and W,followed by mutation-order speciation,causes niche differentiation among lineages.
AcknowledgmentsWe thank Guangwu HUANG and Huasong LEI for assistance in the field.This work was supported by grants from the National Natural Science Foundation of China (32071493,31971414 and 31770443) and Finance Science and Technology Project of Hainan Province(ZDYF2018219).
Appendix
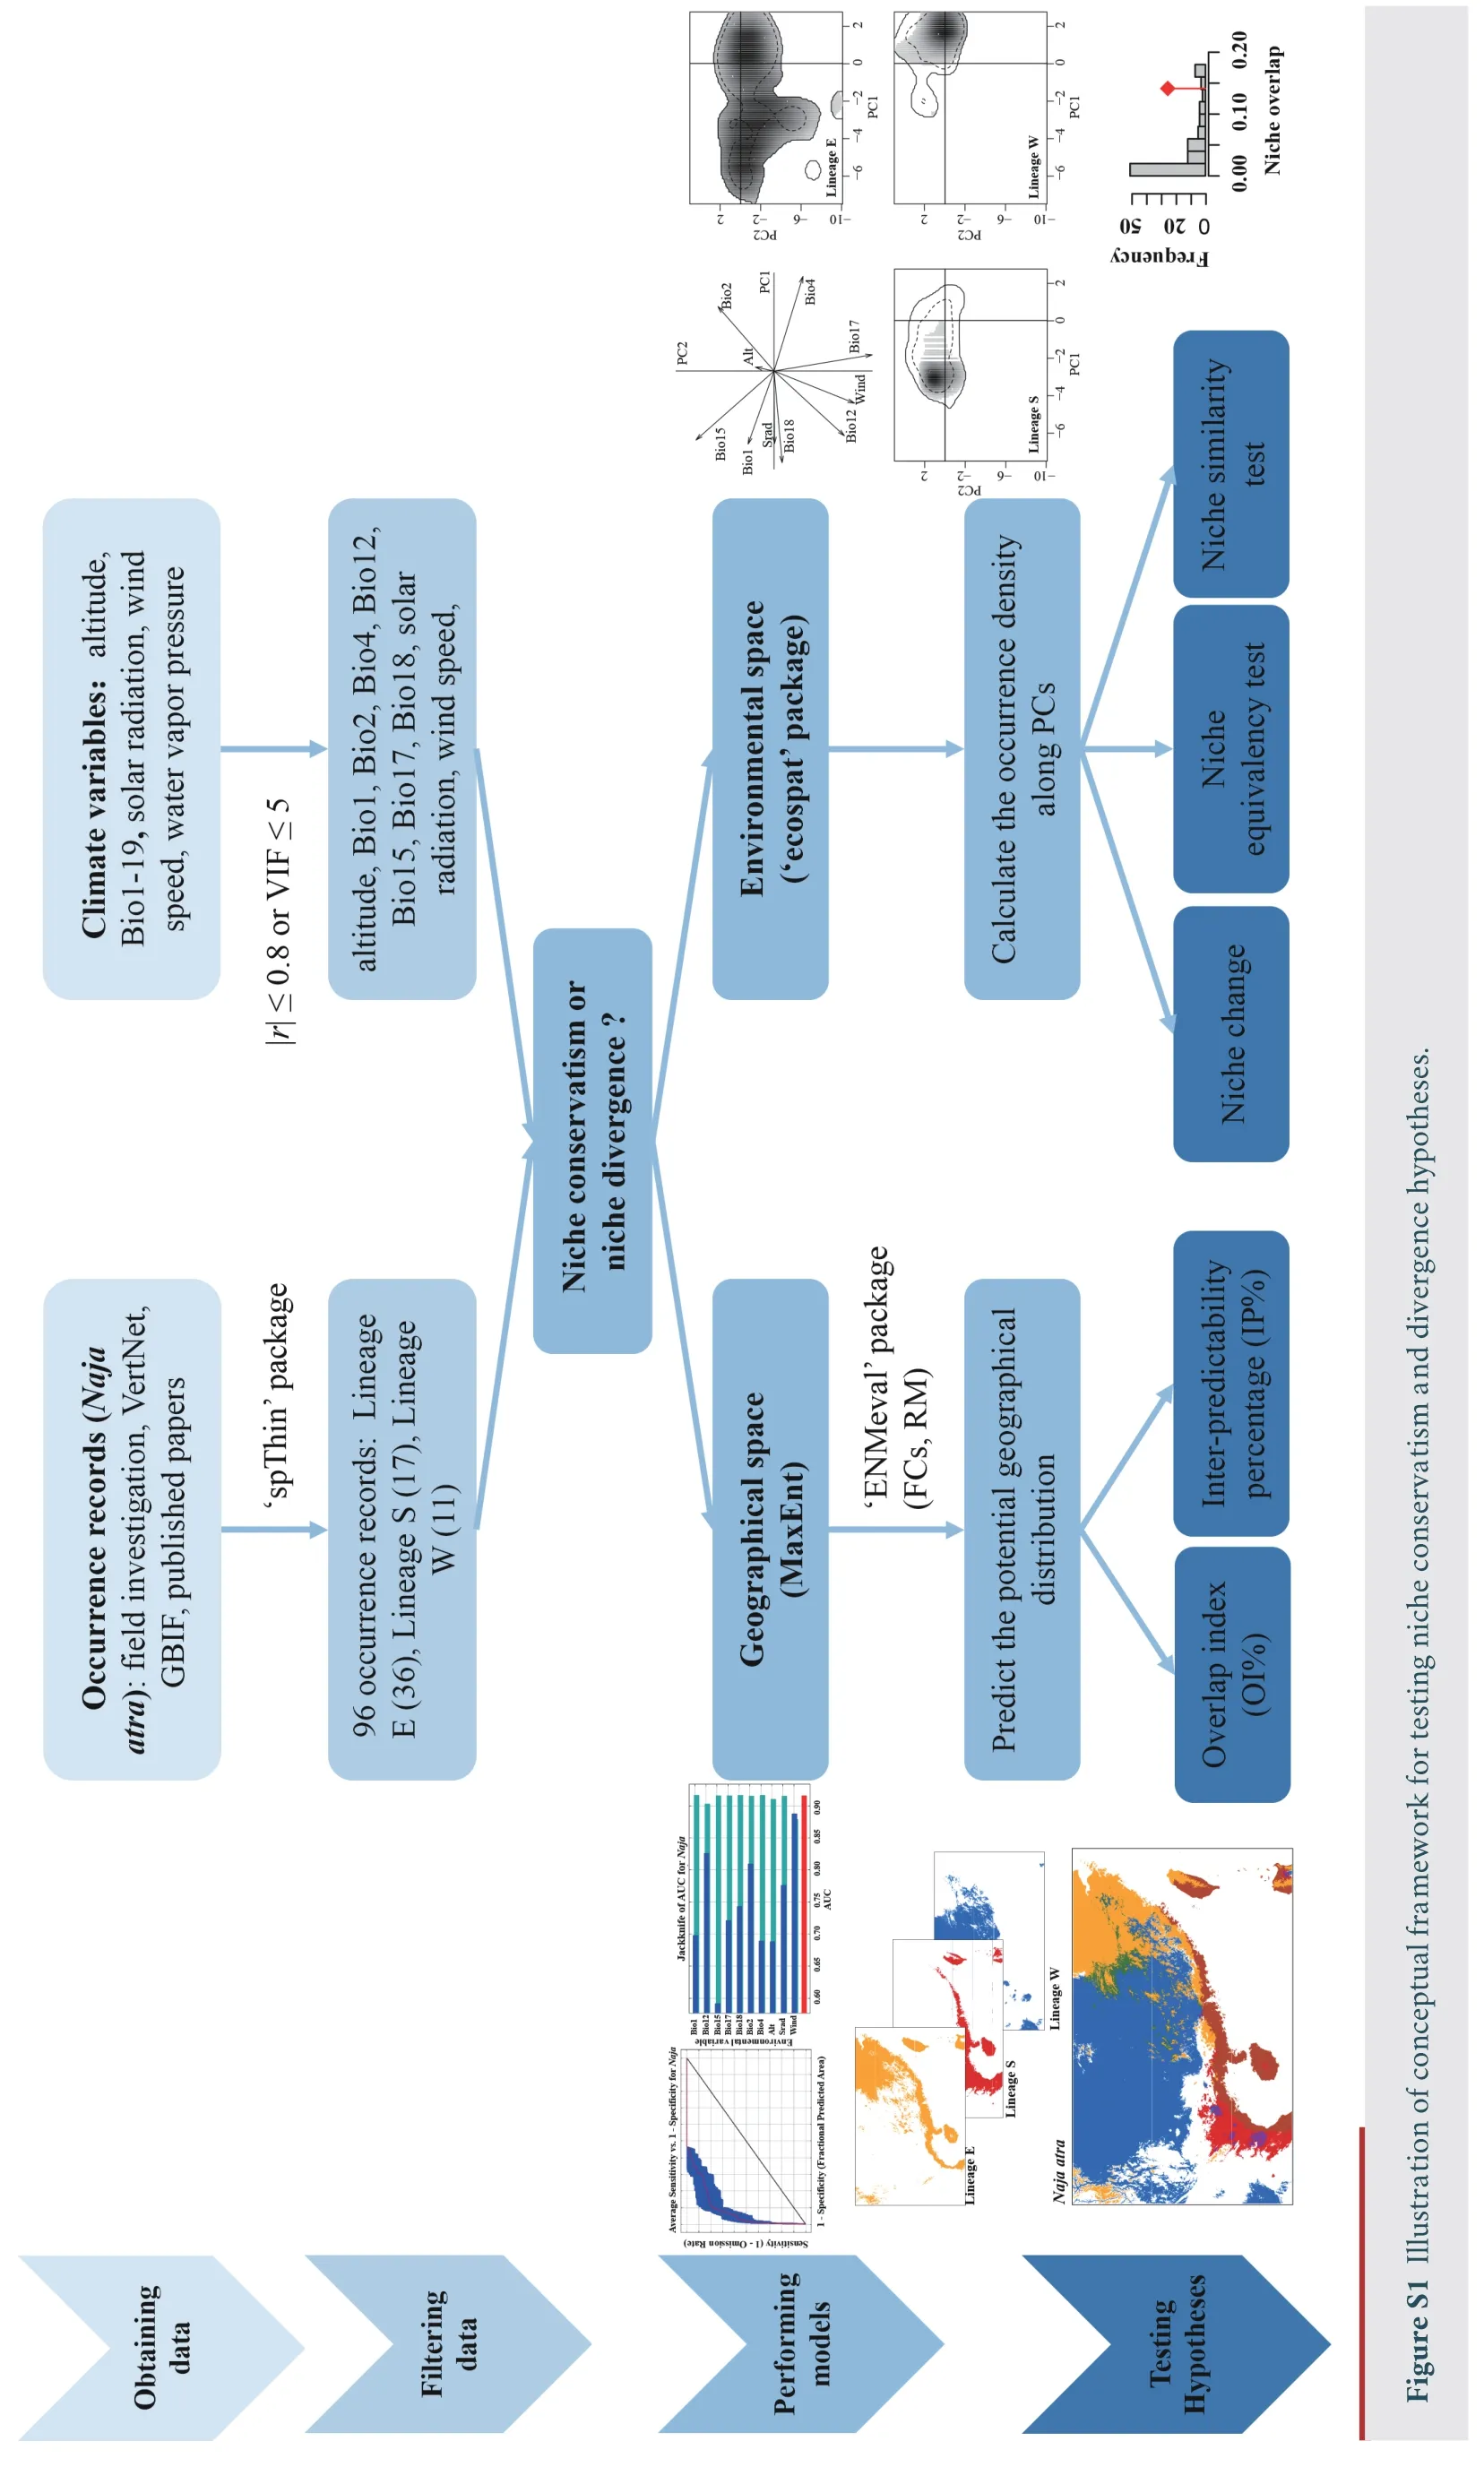
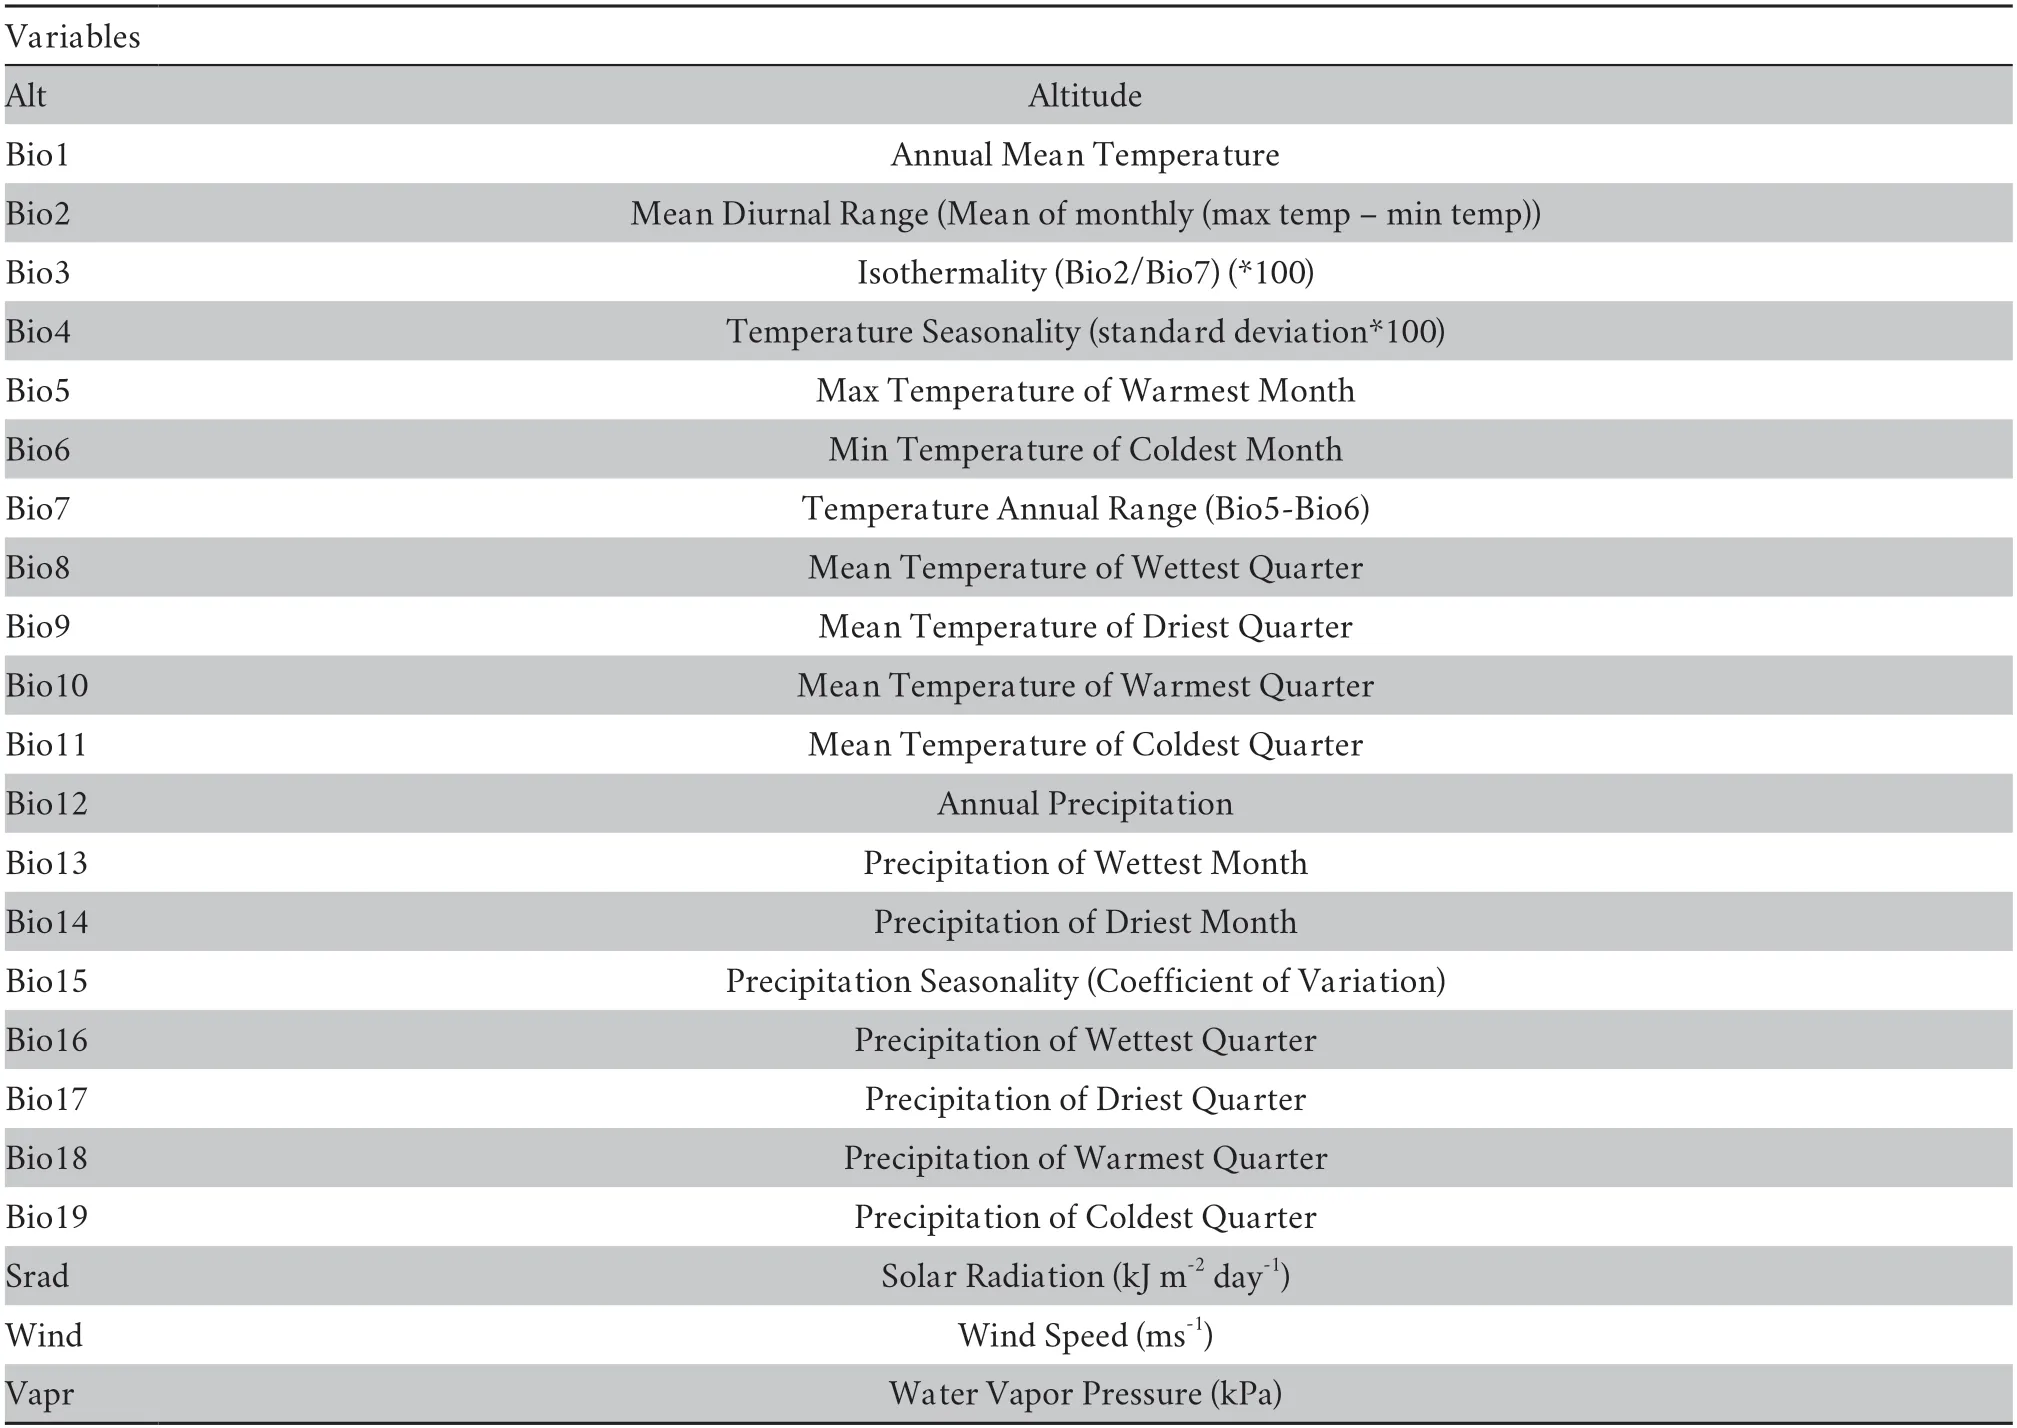
Table S1 Twenty-three bioclimate variables downloaded from the WorldClim database (http://www.worldclim.org/).
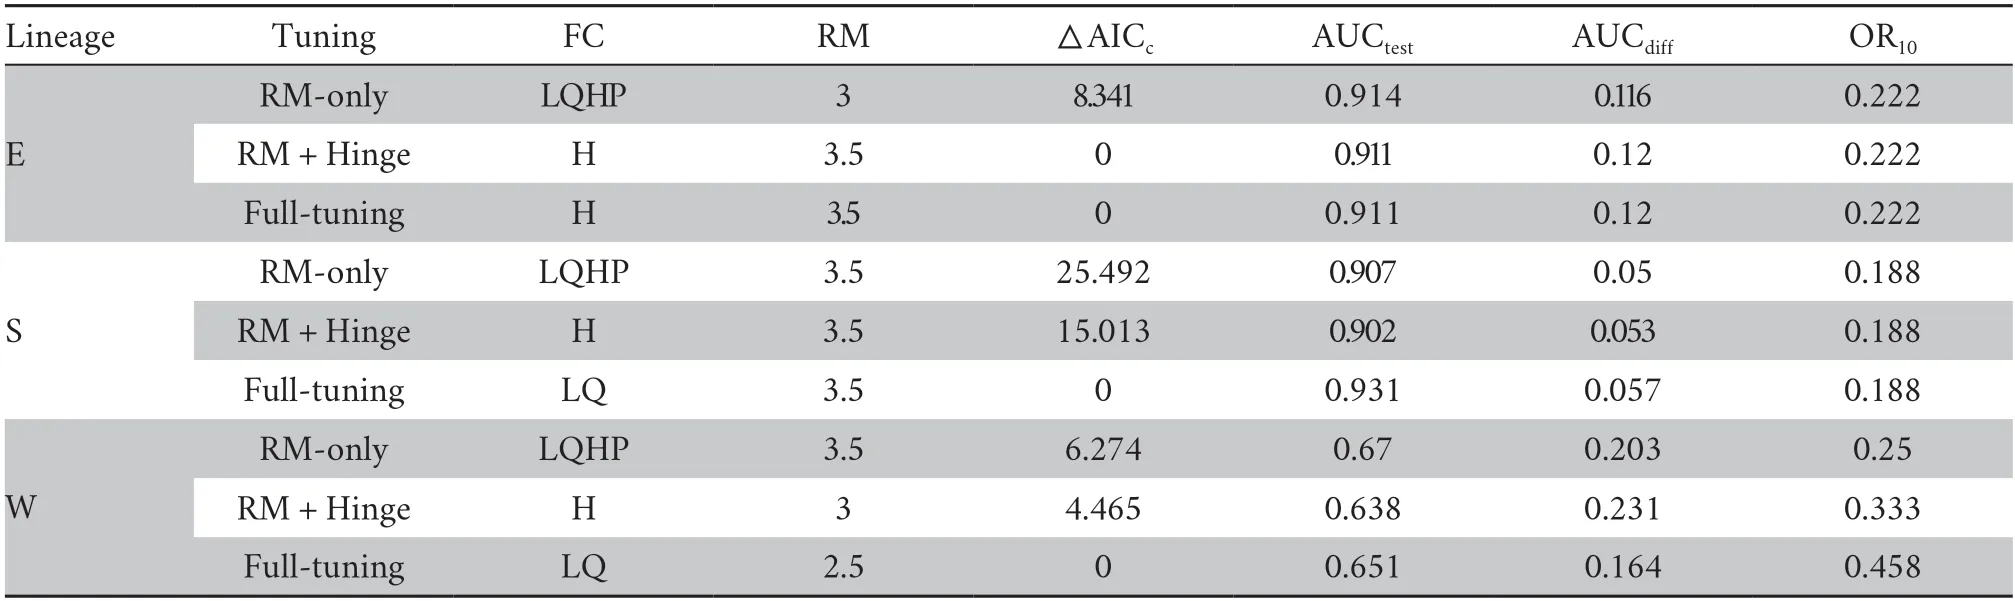
Table S2 Evaluation metrics of MaxEnt generated by ENMeval.
杂志排行
Asian Herpetological Research的其它文章
- Desertification Drives the Shift in Egg Size-Number Trade-Off in an Agamid Lizard
- Endocast Morphological Variation and Its Driving Forces in Scutiger boulengeri
- Metagenomic Analysis of Mangshan Pit Viper (Protobothrops mangshanensis) Gut Microbiota Reveals Differences among Wild and Captive Individuals Linked to Hibernating Behaviors
- Phylogenetic Relationships among Chinese Rice Frogs within the Fejervarya limnocharis Species Complex (Amphibia: Dicroglossidae)
- Application of eDNA Metabarcoding for Detecting Anura in North China
- Three New Species of Diploderma Hallowell,1861 (Reptilia: Squamata:Agamidae) from the Shaluli Mountains in Western Sichuan,China