Coal-based graphene as a promoter of TiO2 catalytic activity for the photocatalytic degradation of organic dyes
2022-12-13LIUGuoyangLIKekeJIAJiaZHANGYating
LIU Guo-yang, LI Ke-ke, JIA Jia, ZHANG Ya-ting,*
(1.College of chemistry and chemical engineering, Xi’an University of Science and Technology, Xi’an 710054, China;2.National Engineering Research Center of Coal Preparation and Purification, China University of Mining & Technology, Xuzhou 221116, China)
Abstract: Graphene oxide (GO) obtained from coal-based graphite by the Hummers method was hydrothermally treated to obtain reduced GO (rGO).TiO2 was mixed with aqueous suspensions of GO and rGO and dried at 70 oC to obtain GO-TiO2 and rGOTiO2 with 95% (mass fraction) TiO2.TiO2 was also combined with a GO suspension by hydrothermal treatment to obtain rGO-hTiO2 with 95% TiO2.The three hybrids were used as catalysts for the photocatalytic degradation of rhodamine B (Rh B) and methyl orange (MO).Of the three materials, rGO-hTiO2 had the highest catalytic activity for the degradation of Rh B and MO under visible light irradiation.The reasons for having the best catalytic activity are that the incorporation of rGO into TiO2 helps increase its adsorption capacities for Rh B and MO as evidenced by adsorption in dark, and a narrowing of the TiO2 band gap as revealed by diffuse UV reflectance spectroscopy.This reduces the rate of recombination of electron–hole pairs by there being intimate contact between the TiO2 particles and rGO, forming Ti-O-C bonds as confirmed by XPS, with the TiO2 particles being uniformly decorated on the rGO sheets.
Key words: Coal-based graphene;Hydrothermal method;Photocatalytic degradation;Titanium dioxide
1 Introduction
In the past few decades, rapidly developing chemical industries have polluted water around the world[1–2].Water-soluble pollutants are quickly adsorbed in the aquatic system and eventually threaten human health.To ameliorate the environmental harm of water-borne pollutants, polluted water has been remediated by various strategies, including adsorption,filtration, ion exchange, biological treatment, and photodegradation[3–5].Photodegradation is among the most promising methods, as it removes most pollutants under moderate temperature and pressure conditions without generating secondary pollution.In the photodegradation process, oxidation and hydrolysis cooperatively degrade pollutants into harmless inorganic substances such as H2O and CO2[6–7].Of course,solar irradiation provides sufficient energy for driving this process.
Previous research has identified four main steps of the photodegradation process[6–8]: (1) the formation of charge carriers (electron-hole pairs) under sufficiently energetic light irradiation; (2) the separation and transportation of charge carriers; (3) the oxidation-reduction reactions between the charge carriers and catalyst-surface species, which generate reactive oxygen species, hydroxyl and superoxide radicals;(4) the transformation and degradation of pollutant molecules by the synergistic interaction of active radicals and charge carriers.The photodegradation process is often accelerated by photocatalysts, which determine the generation, transfer and utilization efficiency of the photogenerated charge carriers[9].At present, TiO2is the most successful and promising photocatalyst owing to its high chemical and thermal stability, high refractive index, nontoxicity, and suitable redox potential.However, TiO2can be excited only by UV and the photogenerated carriers, which easily recombine, leading to low quantum efficiency[8].To improve the photocatalytic activity of TiO2, researchers have designed new photocatalytic materials by controlling the morphology of TiO2or by compositing it with other materials.These modifications improve the wavelength range of the TiO2excitation light, reduce the recombination probability of the photogenerated carriers, and increase the photocatalytic-reaction activity[8–10].
Carbon nanomaterials with their exceptional characteristics are promising candidates for photocatalytic degradation of organic pollutants, especially the preparation of carbon nanomaterials from low-cost carbon sources has more advantages[11–13].Graphene as a carbon nanomaterial is constructed from monolayers of carbon atoms arranged in a two-dimensional flat honeycomb structure.Acting as an electron acceptor and transporter, graphene plays an important role in enhancing charge transfer and hindering the recombination of electron–hole pairs, thereby improving the activity of the photodegradation reactions.Compositing graphene with conventional photocatalytic materials is known to achieve large specific surface area, improve the electrical conductivity, and exploit the rich electronic properties of graphene,thereby facilitating the effective photodegradation of pollutants[14–15].By exploiting an inexpensive graphene carbon source and developing a simple method for preparation of graphene/TiO2composites,we can hence realize high-performance composite photocatalysts.
In the present work, we use coal as the carbon source of graphene, and prepare graphene/TiO2composite photocatalysts by the hydrothermal and wet mixing processes.The composite photocatalysts prepared by different mixing methods were morphologically and structurally characterized, and their photodegradation properties and mechanisms were evaluated on two degradation targets, rhodamine B (Rh B) and methyl orange (MO).
2 Experimental
2.1 Materials
The photocatalyst was commercially available TiO2(5-10 nm, 99.8%, Shanghai Macklin Biochemical Co., Ltd., China).Sulfuric acid, potassium permanganate, sodium nitrate, hydrochloric acid and hydrogen peroxide were sourced from Sinopharm Chemical Reagent Co., Ltd., China.All reagents were of analytical grade and used without further purification.RB and MO were obtained from Tianjin Kemiou Chemical Reagent Co., Ltd., China.
A low-cost sub-bituminous coal derived from Shaanxi Province (China) was converted into coal-derived graphite (CDG) by preliminary carbonization and high temperature graphitization[16].Graphene oxide (GO) was synthesized from CDG by the modified Hummers method[16–17].Briefly, 1.0 g CDG and 2.0 g NaNO3were successively added to 40 mL concentrated H2SO4and continually stirred for 1 h.Next, 6 g KMnO4was slowly added to this mixture at 2 °C.After maintenance at 2 °C for 1 h, this mixture was heated to 35 °C, where it was maintained for 12 h.The obtained mixture was diluted with 400 mL deionized water, and heated to 98 °C.After 1 h, H2O2(30%) was added dropwise until the solution turned brown-yellow.Subsequently, the whole solution was filtered through a 0.45 μm polyvinylidene difluoride membrane.The filtered precipitate was sequentially washed with diluted HCl solution and deionized water until the pH of the filtrate became neutral.Thereafter, the solid was dispersed in 50 mL deionized water and treated with ultrasound for 5 h.Finally, the supernatant (GO suspension) was obtained by centrifugation at 10 000 r min−1for 30 min.
2.2 Synthesis of graphene/TiO2 composite photocatalysts
The graphene/TiO2composite photocatalysts(GO mass fraction = 5%) were synthesized by 3 methods.In the first method, 0.2 g TiO2was added to a certain amount of the GO suspension, diluted to 50 mL with deionized water, and then ultrasonically treated for 30 min.The suspension was transferred to a 100 mL Teflon sealed autoclave and held at 150 °C for 6 h.During the hydrothermal reactions, GO was reduced (named as rGO) and TiO2was loaded[18].This sample was designated rGO-hTiO2
In the second method, 0.2 g TiO2was added into a certain amount of the GO suspension, diluted to 50 mL with deionized water, and then ultrasonically treated for 30 min.The resulting suspension was oven-dried at 70 °C.This sample was designated GOTiO2.
In the third method, a certain amount of GO suspension was placed in a 100 mL Teflon sealed autoclave and kept at 150 °C for 6 h to obtain rGO.The resulting rGO was mixed with 0.2 g TiO2and ultrasonically treated for 30 min, and then was oven-dried at 70 °C.This sample was designated rGO-TiO2.
2.3 Characterization
The microstructures and morphologies of the photocatalysts were observed by scanning electron microscopy (SEM) (Zeiss SIGMA 300) and atomic force microscopy (AFM) (FM-Nanoview1000AFM).The X-ray diffraction (XRD) patterns were obtained on a MINI FLEX600 X-ray diffractometer equipped with a CuKα radiation source (λ= 1.541 8 nm).The materials were characterized by Raman spectroscopy with a 525 nm laser source (InVia Reflex Raman microscope, Renishaw, UK).The surface functional groups of the samples were determined by Fourier transform infrared (FT-IR) spectroscopy using a Nicolet Nexus 470 IR spectrometer (Thermo Fisher Scientific, UK) from 4 000 to 400 cm−1.X-ray photoelectron spectra (XPS) were recorded by a Thermo Scientific K-Alpha with Al-Kα radiation.The surface areas of the samples were obtained from the nitrogen adsorption-desorption isotherms (QUADRASORB SI)using the Brunauer-Emmett-Teller (BET) method.
2.4 Adsorption and photocatalytic activity
The photocatalytic performance of the composite catalysts was evaluated in degrading Rh B and MO.The stimulation light was provided by a Xenon lamp (300 W).In these experiments, a specified amount of the catalyst was added to Rh B or MO aqueous solution (50 mL) in a cylindrical quartz reactor cooled with circulating water.The initial Rh B and MO concentrations in the aqueous solution were 20 and 30 mg L−1, respectively.First, the suspension was stirred for 40 min in the dark to establish absorption–desorption equilibrium.Next, the light was turned on for 120 min to stimulate the photodegradation reactions.During photocatalysis, 5 mL of the suspension was extracted at appropriate time points, and the concentration changes of Rh B and MO were monitored by a UV-2100 spectrophotometer.
2.5 Photoelectrochemical measurements
The photocurrent intensity and electrochemical impedance spectra of the catalysts were measured on a CHI660D electrochemical workstation in a standard three-electrode system, using a platinum plate and Ag/AgCl (in saturated KCl) as the counter and reference electrodes, respectively.The supporting electrolyte was 0.5 mol L−1Na2SO3solution.The catalyst(5 mg) was mixed with 1.0 mL ethanol and 1.0 mL deionized water, and ultrasonically dispersed for 20 min.From this suspension, four 20 μL aliquots were extracted with a pipette gun and added dropwise to one end of a 3×1 cm2conductive glass to obtain a 1×1 cm2working electrode.The working electrode was dried at 60 °C for 30 min.
3 Results and discussion
3.1 Microstructures and morphology of the catalysts
The crystallographic structures of the as-prepared GO, TiO2, and composite catalysts were determined by XRD.Fig.1(a) shows the diffraction patterns of the samples recorded at diffraction angles of 2θ=5°-90°.The peaks at 2θ= 25.3°, 37.8°, 48.0°, 53.9°,55.1°, 62.7°, 68.8°, 70.3° and 75.0° are indexed to the(101), (004), (200), (105), (211), (204), (116), (220)and (215) crystal planes of anatase TiO2(Jade PDF Card File No.21-1272), respectively.Additionally,the peaks at 2θ= 27.3° belong to the (110) crystal planes of rutile TiO2.Based on the XRD patterns, the anatase phase structure dominates in the bare TiO2and composites[19–20].The typical diffraction peaks of isolated GO or rGO are not observed due to the limited amount of GO or rGO in the composites.
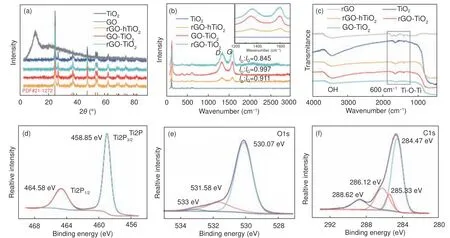
Fig.1 (a) XRD patterns of TiO2, GO and composite catalysts.(b) Raman spectra of TiO2 and composite catalysts.(c) FT-IR spectra of TiO2, rGO and composite catalysts.(d) Ti2p, (e) O1s, and (f) C1s XPS spectra of rGO-hTiO2
However, both TiO2and graphene are detected in the Raman spectra (Fig.1(b)).The two intense bands at 1 361 cm−1(D-band) and 1 575 cm−1(G-band) in the Raman spectra correspond to disordered defective carbon, and graphitic sp2carbon, respectively.In general, the ratio of disorder/defect to graphitic carbon in graphene is reflected by the intensity ratio of theDband to theG-band (theID/IGratio).WhenID/IGis small, the graphene contains few sp3defects/disorders and the average size of the in-plane graphitic crystallite sp2domains is high[21–22].Therefore, the higherID/IGratio in GO-TiO2(0.997) than in rGO-TiO2(0.845) confirms a more regular rGO structure and fewer defect structures in rGO-TiO2than in GO-TiO2.TheID/IGof rGO-hTiO2is intermediate (0.911),mainly because the interaction between C and TiO2during the hydrothermal process introduces defects in the reduced graphene nanosheets.Clearly, these defects are incompletely repaired by the hydrothermal treatment and remained after the removal of oxygen moieties.Meanwhile, theID/IGis higher in the Raman spectrum of rGO-hTiO2than in the spectrum of rGOTiO2, indicating that TiO2hinders the reduction of GO during the hydrothermal process, possibly through interfacial interactions (such as Ti―O―C bonds)between TiO2nanoparticles and the rGO nanosheets.The peaks situated at 145 cm−1(Eg), 400 cm−1(B1g), 515 cm−1(A1g/B1g) and 639 cm−1(Eg) correspond to anatase TiO2[23].
Fig.1(c) shows the FT-IR spectra of rGO and the composite catalysts.The weak characteristic peaks of the functional groups related to GO and rGO are explained by the low graphene content.The broad absorption band in the low-frequency range (500-800 cm−1) of the composite-catalyst spectra is attributed to vibration of the Ti―O―Ti bonds in TiO2.The characteristic peaks in the 1 100-1 800 cm−1range correspond to C―O stretching (1 720 cm−1), skeletal vibration of unoxidized graphitic domains (1 620 cm−1),O―H deformation (1 400 cm−1), and C―OH stretching (1 220 cm−1).The absorption peak at 3 410 cm−1is contributed by ―OH group stretching[24].
The chemical states of the elements in rGOhTiO2were analyzed by XPS (Fig.1(d-f)).In the spectrum of Ti2p (Fig.1(d)), the two peaks at 458.85 and 464.58 eV represent the Ti2p3/2and Ti2p1/2states of Ti4+in TiO2, respectively.In the O1s spectrum(Fig.1(e)), the binding energies located at 530.07,531.58 and 533.12 eV are attributed to lattice oxygens bound to Ti4+ions in TiO2, Ti―O―C groups,and C―O groups, respectively[25].Meanwhile, the C1s peaks at 284.47, 285.33 and 286.12 eV in Fig.1(f) are attributed to sp2and sp3hybridized carbons, respectively, and the peak at 288.62 eV is attributed to the Ti―O―C band[26–27].
The performance of a composite catalyst relies on good interfacial contact between the different catalyst components.The morphologies of the present catalysts were characterized by SEM and AFM.Panels (a-c) of Fig.2 display the different morphologies of the TiO2and graphene composites by the three methods.In rGO-hTiO2, TiO2is uniformly accumulated at both sides of the graphene sheet, and the composite catalyst forms a stacked-sheet structure(Fig.2(a), inset).In the composite catalyst prepared by the wet mixing method, TiO2accumulates on the lamellar structure of graphene but does not completely wrap around it.Instead, the particles in the catalyst aggregate into large particles (Fig.2(b-c)).Obviously, TiO2is evenly dispersed on the graphene sheets in the composites prepared by the hydrothermal method, but is poorly dispersed in the composite prepared by the wet mixing method.Considering its efficient network structure and strong coupling interaction between the rGO nanosheets and TiO2nanoparticles, the rGO/TiO2composite prepared by the hydrothermal method is expected to exhibit a high photocatalytic activity[18].As shown in Fig.2 (d), the GO layer is very thin, so TiO2is deposited in the relatively huge lamellar space of the nanosheet.For the AFM analysis, the rGO-hTiO2is dispersed in an ethanol water solution by ultrasound, and then drop-dried onto the mica substrate.The AFM results of rGOhTiO2are displayed in Fig.2 (e, f).The external force does not strip TiO2from the graphene film, indicating a strong interaction between TiO2and the graphene sheets.The mechanism of this interaction may be physisorption, electrostatic binding, or charge transfer[28–29].
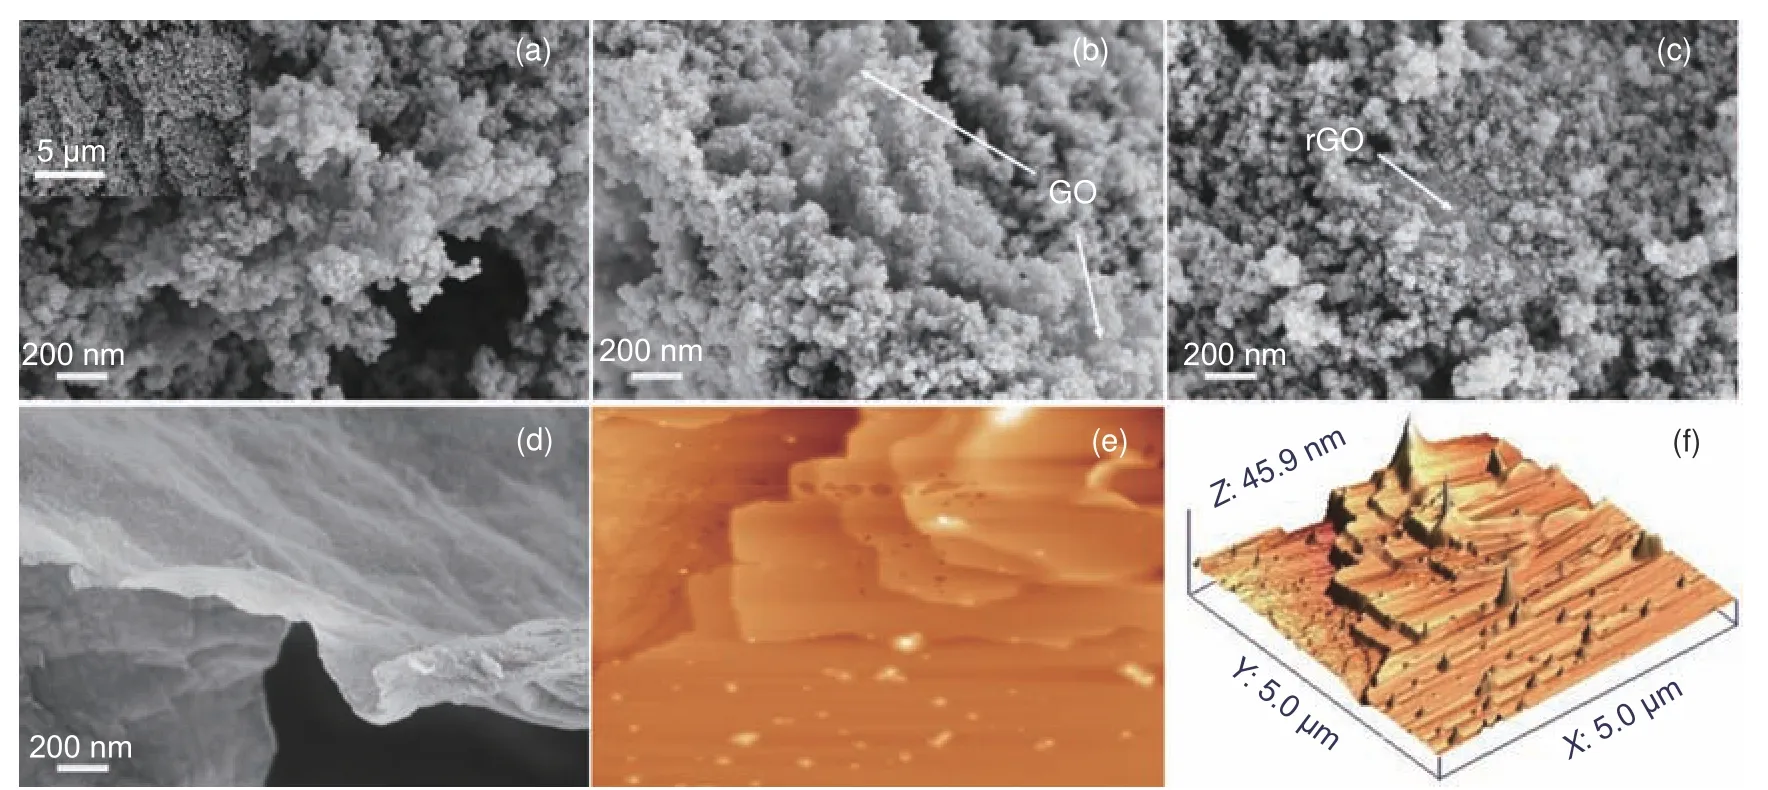
Fig.2 SEM images of (a) rGO-hTiO2, (b) rGO-TiO2, (c) GO-TiO2 and (d) GO.AFM imagines of (e) and (f) AFM images of rGO-hTiO2
Fig.3 displays the N2adsorption-desorption isotherms of bare TiO2and the composite catalysts.All isotherms of samples exhibit a similar hysteresis loop,corresponding to a type-IV isotherm.Table 1 summarizes the structural properties of the samples.The graphene/TiO2composites possess a slightly higher surface area than bare TiO2, indicating that graphene plays an active role in dispersing the TiO2.However,the BET surface areas of the composite catalysts are very similar, revealing that the specific surface area and pore structure of the composite catalysts are not affected by the composite methods.

Table 1 Pore parameters of the catalysts
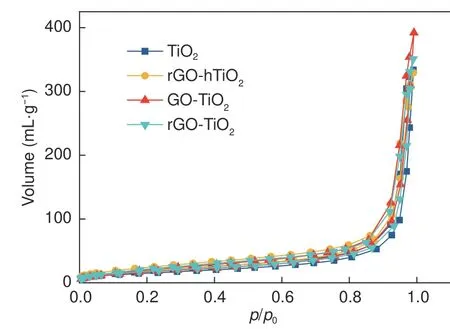
Fig.3 N2 adsorption-desorption isotherms of the TiO2 and its composite samples
3.2 Photodegradation of Rh B and MO
The three main driving forces of photocatalysis are adsorption to the catalyst, light absorption, and charge separation and transportation[8].Good adsorbtion ability is the first premise of a photocatalytic reaction.To explore the photodegradation abilities of the fabricated catalysts, the suspension containing the catalysts is first stirred under dark conditions to establish absorption-desorption equilibrium.Before the photodegradation experiment, each TiO2composite catalyst is added to the organic solutions and stirred until evenly dispersed.The concentration change of the solutions is monitored once every 10 min until the adsorption of Rh B and MO on catalysts reaches equilibrium.The adsorption-equilibrium curves of Rh B and MO are shown in panels (a) and (b) of Fig.4, respectively.Clearly, the Rh B and MO adsorption on the catalyst surfaces is equilibrated after 40 min, and the adsorption capacities of Rh B and MO are slightly increased after graphene is composited with TiO2catalyst.This improvement can be explained by the large specific surface area of graphene for the easy diffusion of Rh B and MO molecules from solutions to the photocatalyst surface, where they are adsorbed onto graphene via π–π conjugations between themselves and the aromatic regions of graphene[28].
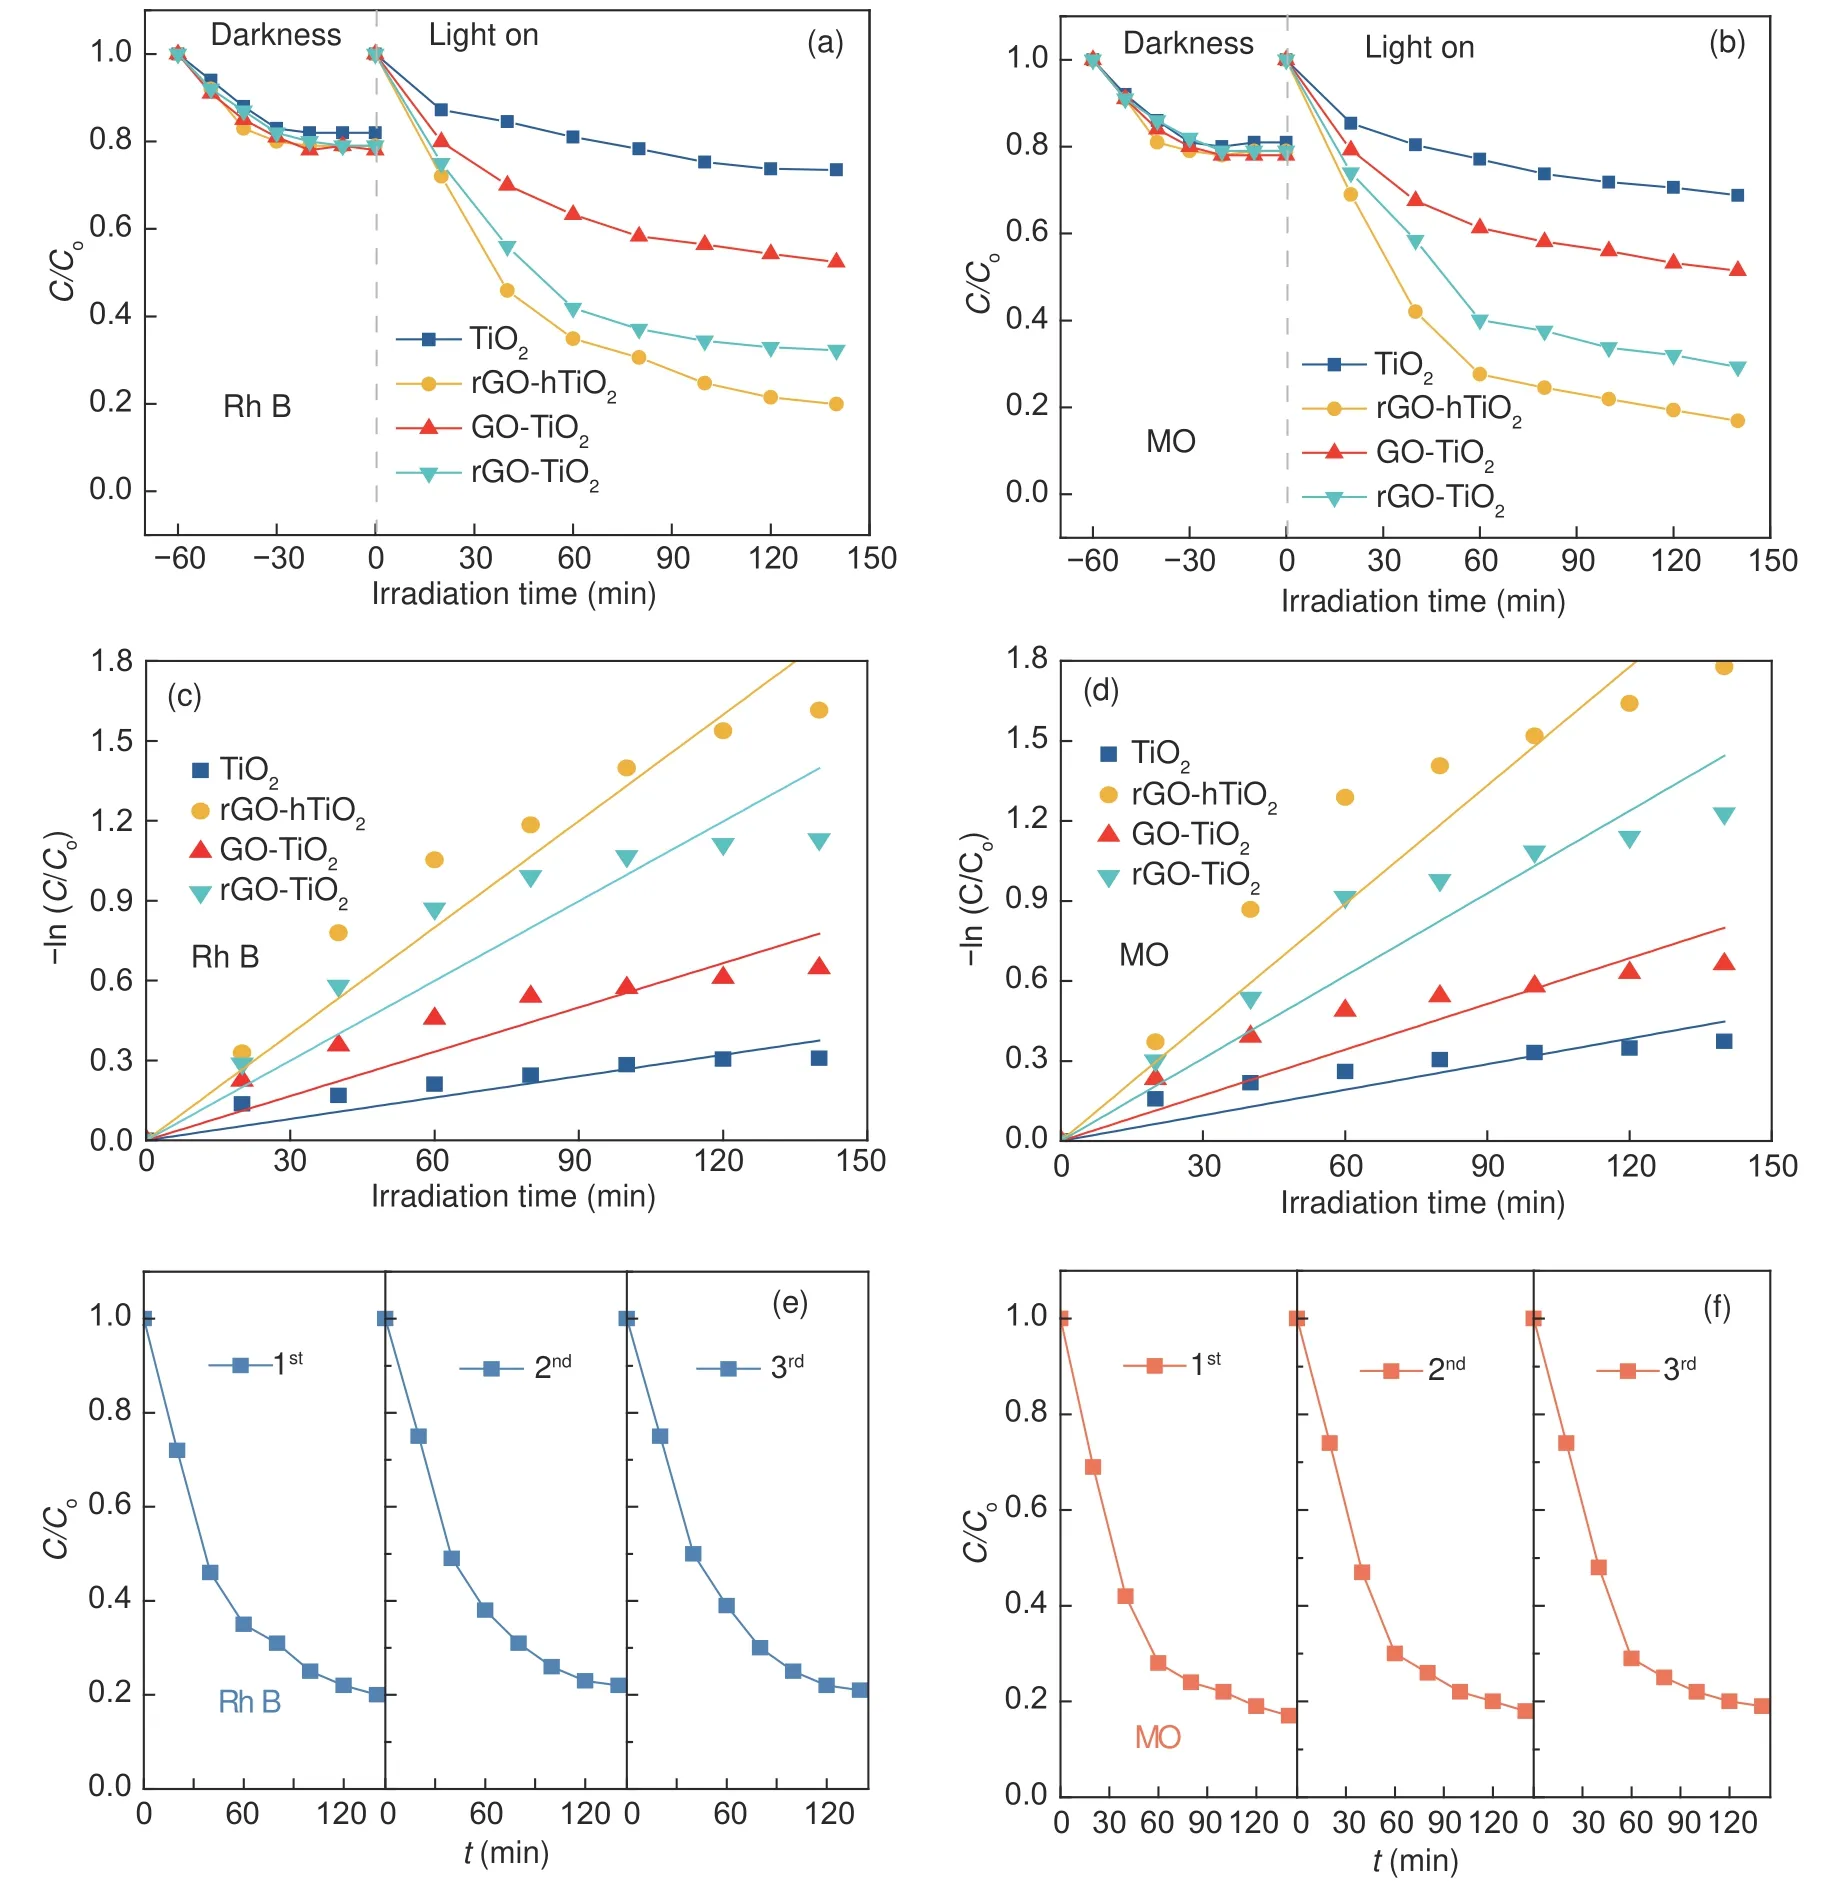
Fig.4 Adsorption-equilibrium and photocatalytic-degradation curves for (a) Rh B, (b) MO solutions over various catalysts.The first-order kinetics plots of(c) Rh B, (d) MO degradation over various catalysts.Cycle degradation experiments of (e) Rh B and (f) MO over the rGO-hTiO2 catalyst
The photocatalytic performance of TiO2and the composites was evaluated on the photocatalytic decomposition of Rh B and MO in their aqueous solutions under Xe-lamp irradiation.The concentration changes of Rh B and MO show different trends, as shown in Fig.4(a, b).With the extension of illumination time, the concentrations of Rh B and MO in the reaction system gradually decrease.The photocatalytic degradation rates of Rh B and MO are the fastest at the beginning of the reaction, which is due to the maximum initial concentration of reactants.The photocatalytic activities against Rh B and MO are clearly lower on bare TiO2than those on the composites, despite the well-known performance of TiO2in various photocatalytic reactions.When TiO2is composited with 5% GO or rGO by the hydrothermal or wet mixing method, the photocatalytic activities are remarkably enhanced.Furthermore, the hydrothermal method exerts a higher improvement effect than the wet mixing method.As demonstrated in different catalysts, graphene introduction improves the adsorb ability of the catalyst to Rh B and MO, but adsorption does not play the main role in the photodegradation reaction and other factors must contribute to the photoactivity enhancement.The experimental data in Fig.4 indicate that graphene improves the activity of the photodegradation reactions on the catalyst, probably by extending the light-absorption range and improving the efficiencies of charge separation and transportation[4,20,21].
According to the literatures[24,29], the photocatalytic degradation of MB under UV irradiation was a first-order kinetic reaction (Eq.(1)).Through fitting the experimental data of the photocatalytic degradation experiment (Fig.4 (c, d)) to this expression, we can compute the rate constantk, the basic kinetic parameter for comparing the photocatalytic activities of different samples.The first-order reaction rate constants over the Rh B and MO solutions were listed in Table 2.The fitting results of Fig.4 (c, d) deviate from the first-order kinetic model, possibly because the photodegradation process is affected not only by the reaction kinetics, but also by the light conditions and catalyst characteristics.In the first-order rate equation:

Table 2 The first-oeder reaction rate constants of the photocatalysts

whereC0andCdenote the Rh B or MO concentrations at times 0 andt,respectively, andkis the firstorder rate constant.
A promising catalyst must exhibit a good cycle stability.Hence, we performed cycle degradation experiments of Rh B and MO over the rGO-hTiO2catalyst, as shown in Fig.4 (e, f).The photocatalytic activities do not significantly degraded after three cycle tests, indicating high stability and recyclability of rGO-hTiO2.
3.3 Photocatalytic mechanism
As mentioned above, light absorptionis the second premise of a photocatalytic reaction.Fig.5 (a)displays the UV–Vis diffuse reflectance spectra( UV–Vis DRS) of bare TiO2and the composites.Bare TiO2absorbs only in the UV region, but the graphene-based composites absorb strongly in the visible light region (400-800 nm).Moreover, their UVlight absorption is strengthened from that of bare TiO2.The absorption edge of the composites shows slight redshift compared to that of bare TiO2, probably contributed by the Ti―O―C bonds formed at the interface between TiO2and rGO[18].The band gaps of the photocatalysts can be calculated by the Kubelka-Munk equation[23].From the relationship between (αhυ)2and photon energy (Fig.5(b)), the band-gap energies of TiO2, GO-TiO2, rGO-TiO2, and rGO-hTiO2are extrapolated to be 3.24, 2.81, 2.68 and 2.45 eV, respectively.In this relationship, α,handυdenote absorbance, Planck’s constant and the light frequency, respectively.The narrowing of the band gap in the composite catalyst is attributed to the introduction of graphene into the TiO2matrix, which improves the effectiveness of visible light utilization[30].
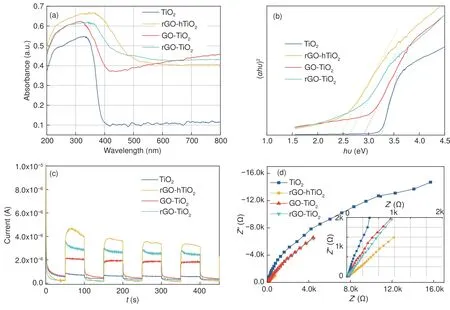
Fig.5 (a) Diffuse reflectance absorption spectra, (b) band-gap energy plots, (c) transient photocurrent curves, and (d) EIS changes of TiO2 and the composites
To explore how graphene enhances the photocatalytic activity, the photocatalysts were subjected to photoelectrical experiments, and their transient photocurrent responses and electrochemical impedance spectroscopy (EIS) results were obtained[18,26].Fig.5 (c) displays the photocurrent densities of TiO2and its graphene composites.The photocurrent densities are negligible in the dark, but increase rapidly under illumination.Moreover, the graphene/TiO2composites yield higher photocurrent densities than bare TiO2.
The large photocurrent densities in the composites can be ascribed to effective charge separation and high transfer rates of their photogenerated carriers.The interfacial charge transfer properties of the catalysts are revealed in the EIS measurements.Fig 5(d)shows the EIS Nyquist plots of the four samples.A small arc radius in a Nyquist plot indicates effective separation of the photogenerated electron-hole pairs and fast interfacial charge transfer in a photocatalyst.The arc radii on the present EIS Nyquist plots decrease in the following order: bare TiO2> GO-TiO2>rGO-TiO2> rGO-hTiO2.Based on these results, it is concluded that graphene promotes the photocatalytic activity of TiO2, mainly by providing excellent electronic acceptance and transfer characteristics.The excited TiO2electrons in the graphene/TiO2composites can transfer from the conduction band to graphene via a percolation mechanism, which effectively suppresses the recombination of charge carriers.
As a representative photocatalytic candidate,TiO2is commonly used to explain the degradation mechanism of organic compounds by photocatalysis[8,23,31–33].The photocatalytic process of organic compounds by TiO2is thought to proceed as follows:
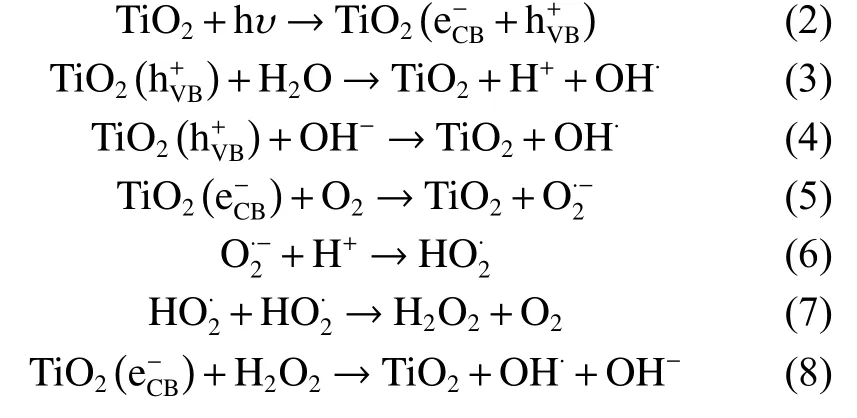
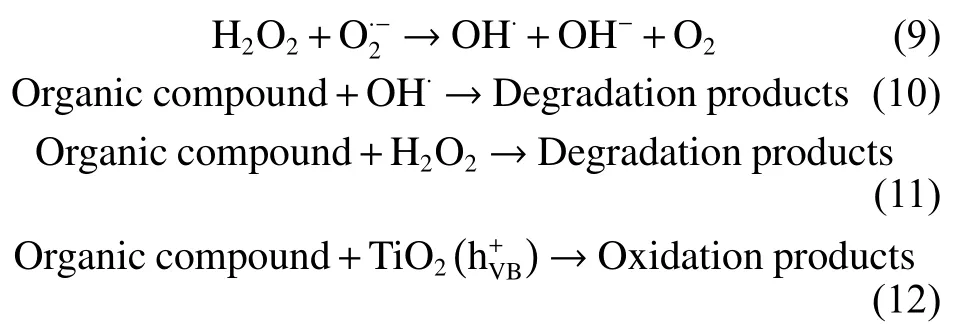
When a photon with energy equal to or exceeding the band-gap impinges on TiO2, an electron jumps from the valence band (VB) to the conduction band,generating positive holes in the VB or electron-hole pairs.During the photodegradation of organic compounds, these photo-excited holes react with H2O to produce hydroxyl radical species, whereas photo-excited electrons produce radical oxygen species that decompose Rh B and MO into small molecules (Fig.6).
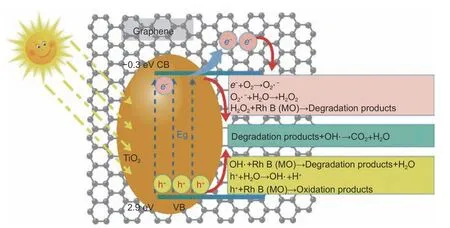
Fig.6 Suggested mechanism of decomposition of Rh-B and MO through photodegradation by graphene/TiO2 composites
From the above reaction mechanism, the photogenerated electrons and holes are responsible for the photodegradation of organic compounds.As is wellknown, the band gap of TiO2is 3.24 eV, meaning that the photocatalytic reaction is initiated only at wavelengths below 380 nm (constituting ~4% of the solar energy)[5].Facilitating the separation of the photogenerated electron-hole pairs and widening the light-responsive region are crucial for enhancing the overall photocatalytic performance of photocatalysts.To improve the photocatalytic activity of TiO2, some researchers have enhanced the degradation performance of organic compounds by this species[9,10,33].With its large surface area and high conductivity,graphene provides a two-dimensional conductive support path for charge transfer and collection, which boosts the photocatalysis process.Therefore, when TiO2is composited with graphene, the resulting composite photocatalyst has the advantages of large surface area, abundant surface-active sites, and high electron–hole separation rate.In the present study,graphene greatly enhances the photocatalytic degradation activity of TiO2for Rh B and MO under visible light irradiation, by virtue of its effective charge separation and transfer, and the narrow band gap.
4 Conclusions
In this work, graphene is successfully synthesized using low-cost sub-bituminous coal as the carbon source, and graphene/TiO2composite photocatalysts are formed by different mixing methods.The graphene introduction into TiO2improves the photocatalytic performance by providing good light-absorption properties, and by inhibiting the recombination rate of electron-hole pairs via providing conductive paths for electron transfer.The hydrothermal method, by which TiO2is uniformly distributed on the rGO surface, improves the photodegradation characteristics of the catalyst more than the wet mixing method.The proposed strategy is effective to prepare high-performance composite photocatalysts from coal-derived graphene and TiO2, which is potentially applicable to pollution treatment.
Data Availability Statement
The data that support the findings of this study are openly available in Science Data Bank at https://www.doi.org/10.57760/sciencedb.06477 or http://resolve.pid21.cn/31253.11.sciencedb.06477.
Acknowledgements
This work was kindly supported by Open Fund Project of National Engineering Research Center of Coal Preparation and Purification (2018NERCCPPB06), National Natural Science Foundation of China-Coal based low carbon joint Foundation of Shanxi Province (U1810113) and Natural Science Foundation of Shaanxi Province (2019JLP-12).
杂志排行
新型炭材料的其它文章
- Ni(OH)2/石墨相氮化碳/石墨烯三元复合材料的制备及电化学性能
- 炭纸衬底上化学气相沉积直立型二维过渡金属硫化物及其电催化产氢性能
- Preparation and lithium storage of anthracite-based graphite anode materials
- A flexible hard carbon microsphere/MXene film as a high-performance anode for sodium-ion storage
- 咖啡渣成型制备生物质炭及其CH4/N2分离性能
- Oxygen-incorporated carbon nitride porous nanosheets for highly efficient photoelectrocatalytic CO2 reduction to formate
