Preparation and lithium storage of anthracite-based graphite anode materials
2022-12-13LIYuanTIANXiaodongSONGYanYANGTaoWUShijieLIUZhanjun
LI Yuan, TIAN Xiao-dong, SONG Yan,*, YANG Tao, WU Shi-jie, LIU Zhan-jun
(1.CAS Key Laboratory of Carbon Materials, Institute of Coal Chemistry, Chinese Academy of Sciences, Taiyuan 030001, China;2.Center of Materials Science and Optoelectronics Engineering, University of Chinese Academy of Sciences, Beijing 100049, China)
Abstract: Several graphite samples with different microstructures were prepared from anthracite using industrial silicon powders as catalyst.The mechanism of the catalytic reaction and the electrochemical properties of the prepared coal-based graphite in lithium anodes were investigated.The correlation between the microstructure and the properties of the graphite is discussed.Results show that the sample with 5% silicon (G-2800-5%) has the best lithium storage.It has the well-developed graphitic structure with a degree of graphitization of 91.5% as determined from the interlayer spacing.When used as an anode material, a high reversible capacity of 369.0 mAh g−1 was achieved at 0.1 A g−1 and its reversible capacity was 209.0 mAh g−1 at a current density of 1 A g−1.It also exhibits good cycling stability with a capacity retention of 92.2% after 200 cycles at 0.2 A g−1.The highly developed graphite structure,which is favorable for the formation of a stable SEI and therefore reduces lithium ion loss, is responsible for the superior electrochemical performance.
Key words: Anthracite;Catalytic graphitization;Lithium ion battery;Anode materials
1 Introduction
In order to alleviate the growing contradiction between the global energy crisis, environmental pollution and the development of human society, the development of mobile devices and low-emission vehicles such as hybrid electric vehicles (HEVs), plug-in HEVs, and electric vehicles (EVs) are needed worldwidely[1].Lithium-ion batteries (LIBs) have been widely used due to the distinct characteristics of high energy density, long lifespan, low self-discharge rate and high safety, compared with lead acid batteries,nickel zinc batteries and nickel cadmium batteries[2].However, the LIBs for EVs and stationary energy storage applications are restricted by some unresolved problems such as costs, low temperature performance and materials availability.The development of electrode materials for LIBs has attracted much attentions.
Graphite as anode material has been diffusely applied in the commercial LIBs.From an economic point of view, natural graphite obviously is a great choice as anode material compared to other carbonaceous materials due to high capacity derived from the high degree of crystallinity and low flat potential profile versus lithium[3].However, the larger graphite sheet and obvious anisotropy could lead to the poor compatibility with electrolyte and severe volume expansion, thus resulting in weak cyclic stability and inferior rate capacity, which impede its further application in EVs and HEVs.In comparison, artificial graphite has shown much superior consistency and purity than natural graphite.Therefore, it could offer the good cyclic stability and the rate performance,showing a great potential in the field of batteries industry.
A variety of precursors including petroleum coke, needle coke, pitch coke and mesocarbon microbeads (MCMBs), biomass, etc., have been employed for preparing artificial graphite[4–7].However,to obtain the graphite material with a higher degree of graphitization and the better electrochemical performance, cokes need to be treated as high as 3 000 °C,which increases the cost and energy consumption.Although MCMB has stable structure and good electrochemical performance, the complicated preparation process and high cost seriously hinder their scale-up application for a long time.While the rich biomass suffers from its low utilization during pyrolysis.Therefore, it is of great significance to find low-cost and abundant raw materials to prepare high-performance graphite anodes through a simple process.
Anthracite, as a kind of abundant underground mineral, can be fabricated into various products including activated carbon, fertilizer and reinforcing agent[8].Moreover, 90% of carbon content makes it an ideal precursor for the preparation of graphite.A macromolecular structure with aromatic rings forming large units of graphene layers connected by aliphatic or ether groups is favorable to form ordered structure[9,10].Thus, the preparation of graphite anode materials from anthracite has a great research value and application prospect.Cameán et al.[11]prepared graphite anode material by using spanish anthracite with different characteristics, and found that the properties of anthracite have a certain effect on the electrochemical performance of coal-based graphite.Zhang et al.[12]confirmed that heat treatment temperature has an effect on the electrochemical properties of as-obtained carbon materials.They also found that sample treated at low-temperature showed unsatisfied cyclic stability due to its impurities which can be improved by increasing the temperature to 2 800 °C.And the asprepared sample delivers a high capacity retention of 89.3% after 300 cycles, which is comparable to that of FSN-1[13].However, conventional graphitization is time-energy consuming, which accounts for 45% of the total manufacturing cost.To reduce the energy consumption, catalytic graphitization is proposed under the lower temperature.Metals and their compounds have been used as catalyst for the fabrication of graphitic carbon at low temperature[10,14].Ma et al.[14]prepared the graphite materials with nickel particles as catalyst which showed good electrochemical performance.Wang et al.[10]have systematically investigated the effects of H3BO3, La2O3, Pr6O11, and CeO2on the catalytic graphitization of anthracite, exhibiting that the product catalyze by La2O3shows the excellent performance.However, the complicated post-treatment are usually required to remove the remaining metal impurities from the metal-based catalysts.Qiu et al.[15]investigated the relationship between single-component doped silicon and graphite recrystallization, and proved the feasibility of silicon powder as the catalyst for catalytic graphitization.Nevertheless, there are few reports on the usage of silicon powder during catalytic graphitization of anthracite for lithium battery anode.
In this regard, anthracite-based artificial graphites with different microstructures were prepared with anthracite and industrial silicon powder as precursor and catalyst, respectively.Herein, the effect of silicon contents on the microstructure of products was deeply investigated.The results show that silicon can not only accelerate the catalytic graphitization but also enhance the regularity of graphite microcrystals.The anthracite-based graphite with proper microstructure exhibits excellent electrochemical performance.This work provides a promising approach for the efficient and clean utilization of coal resources and the development of low cost and high performance graphite anode materials.
2 Experimental
2.1 Materials
Anthracite (ash content: 20.35%, volatile component: 8.32%) was obtained from Shanxi Anthracite Coal Co.Ltd (Jincheng, China).Industrial silica powder (200 mesh) was purchased from Sinopure Group.
2.2 Fabrication process of graphitized anthracite
The fabrication of graphitized anthracite was depicted in Fig.1.After crushing, the anthracite was heated to 800 °C under inert atmosphere at a ramp rate of 10 °C min−1and kept at 800 °C for 1 h to remove the organic species (named as Pre-C anthracite).Subsequently, the industrial silicon powder was added.The mixture was then transferred into a graphitization furnace and heated up to 2 800 °C for 0.5 h under inert atmosphere.The samples catalyzed by 0, 5% and 10% weight content of industrial silicon powder were remarked as G-2800-0%, G-2800-5% and G-2800-10%, respectively.

Fig.1 Illustration of the fabrication process of graphitized anthracite
2.3 Cell fabrication
The coal-based graphite, conductive agent (acetylene black) and binder (CMC) were mixed with the mass ratio of 8∶1∶1.Then, deionized water was added.The electrode slurry was cast onto the copper foil with the thickness of 10 μm and dried under vacuum at 80 °C for 5 h.After cooled to room temperature, the electrode was then calendered and punched into electrode discs with the diameter of 1 cm.The loading mass of active material in the tested anodes was in a range of 0.80 to 0.85 mg cm−2.
Electrochemical characterization of electrode was evaluated by using CR 2016 coin cells.The halfcells were fabricated in a glove box filled with Ar.Lithium foil was used as the counter electrode.1 mol L−1LiPF6of the mixture for ethylene carbonate and dimethyl carbonate with the volume ratio of 50∶50 as co-solvent, and 5% (vol.) fluoroethylene carbonate (FEC) was used as electrolyte.A piece of Celgard 2400 microporous polypropylene membrane was used as separator.
2.4 Materials characterization
The microstructure of the samples were analyzed by XRD and Raman.X-ray diffraction patterns were collected by the X-ray diffractometer (D8 Advance, CuKα).Raman spectroscopy was recorded with a wavelength of 532 nm (LabRAM HR Evolution).Electrochemical impedance (EIS) spectra curves were obtained in a frequency range of 10 kHz to 0.1 Hz with an alternating current amplitude of 5 mV on Chenhua electrochemical workstations.And the EIS data were fitted by Zsimpwin software.Cyclic voltammetry (CV) tests were conducted at a scanning rate of 0.1 mV s−1in the voltage range of 0.01-3.0 V.The galvanostatic rate performance and long-term cycling at various current densities in the voltage range of 0.01-3.0 V were conducted using CT2001A battery program controlling test system (LAND,Wuhan, China).All electrochemical tests were complicated at room temperature.
3 Results and discussion
3.1 Micro-structure analysis
The crystal structures of Pre-C anthracite, G-2800-0%, G-2800-5% and G-2800-10% were investigated by XRD.Standard silicon powder was added in the test as a reference system for correcting and calculating the degree of graphitization.In Fig.2a, no obvious peaks can be observed apart from the diffraction peaks of the calibrated substance, indicating the dominant amorphous nature of precursor Pre-C-anthracaite.It can be seen that the precursor has no graphite characteristic peak before graphitization.All samples after heat-treatment at 2 800 °C showed a distinct peaks at 26.5°, which can be ascribed to the (002)plane of graphite crystal.The narrower peak demonstrates that the carbon atoms rearrange into more ordered graphite-like structure after catalytic graphitization.As shown in Fig.2b, in addition to the typical diffraction peaks at 26.5°,the peak at 42.5° and 54.2°which are corresponding to (100) and (004) planes of the microcrystalline structure of graphite also proves that anthracite has formed a large amount of perfect graphite structure after high temperature treatment.
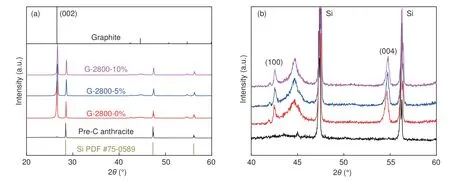
Fig.2 XRD patterns of samples
In order to further analyze the crystal structure characteristics of the three samples, the graphite interlayer spacingd(002), the graphitization degree and the graphite stack thickness (Lc) were calculated by the Bragg diffraction equation, the Mering-Maire formula, and the Scherer formula, respectively.The calculation error of the Scherer formula is relatively large with the crystallite size (La) about 100 nm.Thererfore the formulaLa= 9.5/(d(002)−3.354) was invoked.The calculation results of the above-mentioned structure parameters were listed in Table 1.

Table 1 Lattice parameters of samples
It can be seen that the interlayer spacingd(002)of graphite decreases and the degree of graphitization increases after catalytic graphitization.The result shows that the value ofd(002)of all samples is much smaller than that of amorphous carbon (0.344 0 nm) and close to that of natural graphite (0.335 4 nm), demonstrating the development of the graphitic crystal structure.Among them, G-2800-5% shows the smallest value ofd(002)and the highest graphitization degree, suggesting the good crystallinity with a perfect graphitic structure.After catalytic graphitization, the grain size ofLaand the stacking thickness ofLcof graphite increase significantly, indicating that the catalyst facilitates the axial stacking of graphite microcrystals.
According to the previous literature[16], the smaller the graphite layer spacing, the smaller the band gap between the conduction band and the valence band,which is conducive to the electron excitation from thevalence band to the conduction band and increases the carrier concentration and hole position.The lower defect degree will weaken the scattering effect of carrier conduction at the interface, thus ensuring better conductivity of the material.However, an excessive amount of catalyst will negatively affect the catalytic graphitization to some extent.The detailed analysis of catalytic graphitization mechanism can be seen in the section of 3.2.
Fig.3 displays the Raman spectra of different samples.Each graphitized sample has 2 obvious characteristic peaks, locating at 1 354 and 1 580 cm−1,which can be ascribed to the disordered withDband,ofA1gsymmetry and graphite carbon withGband ofE2gsymmetry, respectively[17,18].
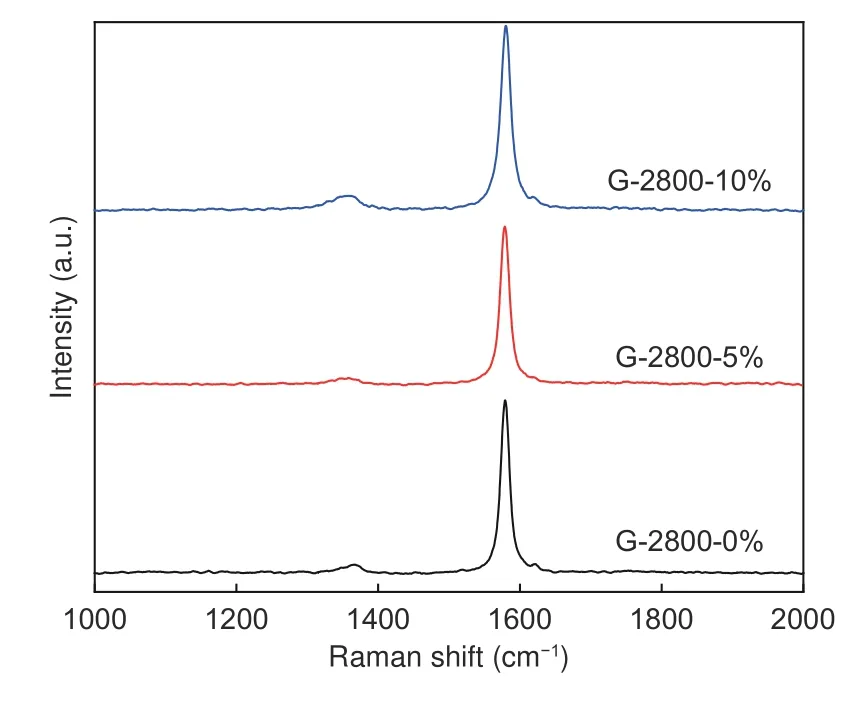
Fig.3 Raman spectra of samples
Generally, the smaller value ofID/IGis accompanied by the higher graphitization degree.In this work, theID/IGvalues of the samples for G-2800-0%,G-2800-5% and G-2800-10% are 0.09, 0.07 and 0.10,respectively.The smallestID/IGvalue of G-2800-5%indicates the highest degree of graphitization, which is well matched with the XRD results.
3.2 Analysis of catalytic graphitization mechanism
The results of XRD and Raman have proved that an appropriate amount of silicon powder can dramatically increase the graphitization degree of the material.However, a non-linear relationship between the amount of catalyst and graphitization degree can be found.According to the previous results[19,20], carbide conversion mechanism was proposed to further analyze the catalytic graphitization process and the detail process is shown in Fig.4.
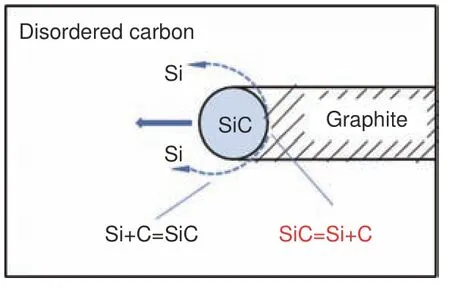
Fig.4 Schematic diagram for the mechanism of catalytic graphitization
When the temperature rises to 1 600-2 000 °C,which is higher than the melting point of silicon(1 410 °C), liquid silicon wets the carbon surface and reacts with amorphous carbon, gradually forming β-SiC intermediates at the interface of each phase in the mixed system[21].Between 2 000 and 2 600 °C, gradually β-SiC transforms into α-SiC.Zhang et al[22]have found that the β-SiC could be detected in the prepared C/C-SiC composites after the graphitization at 2 300 °C.As the temperature further increases, silicon and carbon with a better graphitic structure were generated due to the decomposition of the SiC intermediate.Subsequently, elemental silicon diffuses along the silicon carbide particles from the reacted side to the unreacted side, and then reacts with the residual disordered carbon to form a SiC intermediate again, thereby consuming the amorphous carbon.With the migration of SiC, the above process occurs repeatedly, and finally amorphous carbon turns into well organized graphite crystal.With the temperature rising from 2 600 to 2 800 °C, the intermediate will be completely decomposed.The silicon produced by the decomposition of SiC vaporizes and diffuses outward,completing the catalytic graphitization process.According to the above XRD patterns results, SiC intermediate doesn’t exist in the final product, which correspond to the above analytical process.
Thermal energy may be slowly radiated into the whole system during the heating procedure with the excessive catalyst due to the relatively poor thermal conductivity of the silicon powder.Thus, a small quantity of SiC was formed, leading to a small amount of reaction sites in the early stage.A large amount of SiC can be formed rapidly with the temperature raising.Because of the fast diffusion and migration of SiC, the lesser graphite crystallite size was obtained.Moreover, during the decomposition of SiC at 2 800 °C, a large amount of silicon gasifies and escapes, resulting in the damaged microcrystalline structure and reducing the graphitization degree.
3.3 Electrochemical measurement
The performance of artificial graphite derived from anthracite as anode was invstigated.The first charge-discharge profiles of the samples and the catalyst-free sample between 0.01 and 3.0 V (vs Li+/Li) at current density of 0.1 A g−1are shown in Fig.5a.A short slope ranging from 1.0-1.2 V, 0.6-0.8 V and a distinct plateau below 0.25 V can be corresponded to the decomposition of organic electrolyte, formation of SEI layer and insertion of lithium ions into crystalline graphite, respectively.[23,24]For charge curve, the region of 0-0.25 V is mainly due to the deintercalation process of LiCx.The CV curves of samples for the initial cycle at scan rate of 0.1 mV s−1are presented in Fig.5b.All samples show similar shape with a weak peak between 1.0-1.2 V corresponding to the decomposition of electrolytic additive of FEC and a broad peak at around 0.6-0.8 V derived from the formation of SEI film.In addition, the sharp cathodic peak at 0.2 V can be attributed to the lithiation process to form LiCx.The anodic scanning curves display a sharp peak at 0.15, 0.23 and 0.25 V, which correspond to Li+extraction out of LiCx.For G-2800-5% in Fig.5c, the disappearance of peaks at around 0.8 and 1.0 V in the following cycles indicates that stable SEI layer has been formed in the first cycle.
Fig.5d and 5e show the cyclic stability and rate.As shown in the Fig.5d, all samples exhibit good cyclic stability.Among them, G-2800-5% shows the highest specific capacity even after 200 cycles.The initial charge capacity of G-2800-0%, G-2800-5% and G-2800-10% samples at 0.1 A g−1are 320.1, 393.7 and 345.7 mAh g−1respectively, which is associated with the initial coulombic efficiency of 65.1%, 64.9%and 67.8% (Table 2).The undesirable ICE can be explained by the formation of SEI and the secondary reaction on the electrode surface.Reversible capacity of aforementioned samples decrease to 287.9, 325.6 and 267.7 mAh g−1after 200 cycles at 0.2 A g−1, respectively.The initial charge capacity of 92.2% after 200 cycles for G-2800-5% is much higher than other reports, as shown in Table 3, which is significantly better than the microcrystalline graphite[25], natural graphite[26]and artificial graphite[27].
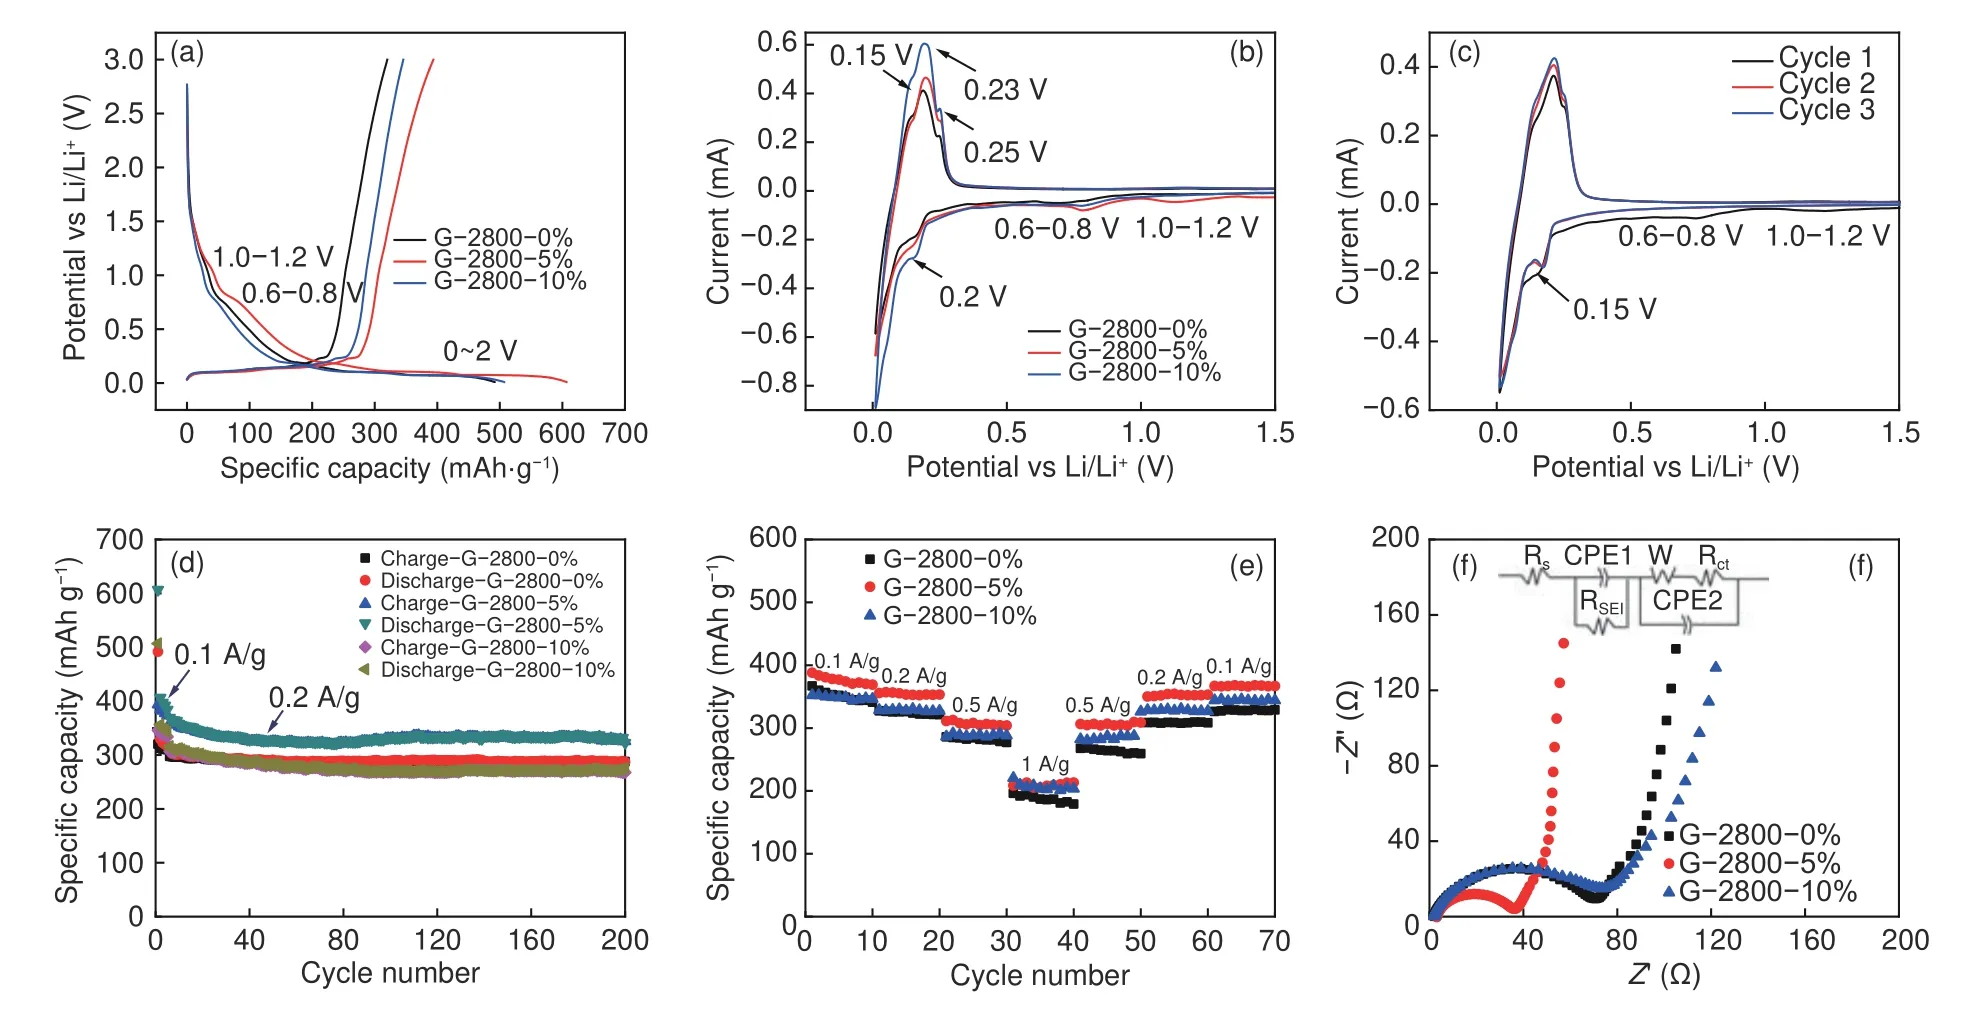
Fig.5 (a) Charge/discharge curves and (b) CV curves of as-obtained samples at 0.1 A g−1 and 0.1 mV s−1, respectively, (c) CV curves of G-2800-5% for the initial 3 cycles, (d) cyclic performance, (e) rate performance, and Nyquist plots of (f) as-prepared samples

Table 2 Electrochemical performance of samples

Table 3 Comparison of first charging performance of sample with other literatures
The rate capabilities of as-obtained samples were illustrated in Fig.5e.G-2800-5% delivers highest specific capacity at almost all current loads.The specific capacity of G-2800-5% at 0.1 A g−1can reach up to 369.0 mAh g−1, and 353.2, 305.9 and 209.0 mAh g−1at 0.2, 0.5 and 1.0 A g−1, respectively.In addition,when the current density decrease to 0.1 A g−1after 60 cycles, a high reversible capacity of 366.9 mAh g−1with 99.4% of the capacity retention can be obtained,indicating the good rate performance and electrochemical stability.The well-developed graphitic structure of G-2800-5% could be responsible for the high electrochemical performance.
The EIS measurements of G-2800-0%, G-2800-5% and G-2800-10% were also performed respectively.The equivalent circuits and detailed Nyquist plots were displayed in Fig.5f.All Nyquist plots consist of a depressed semicircle connecting the high frequency region and low frequency region and an inclined line in the low frequency.The high-frequency semicircle can be attributed to SEI resistance (RSEI, Li ions transport in the SEI film).While the medium-frequency semicircle is ascribed to the charge-transfer resistance (Rct).The line represents the Warburg impedance (W, Li ions diffuse through bulk active materials)[30,31].The smaller semicircle and steeper line of G-2800-5% indicates the lowerRctvalue and improved lithium diffusion capability.Data fitted by Zsimpwin also confirm the excellent ion transmission characteristics of G-2800-5% (RSEI: 33.5 Ω,W:714.4×10⁻⁶Ω).
3.4 Effect of structure on electrochemical performance
As is known, the interface electrochemical property was affected by the microstructure of graphite material, which can influence the physicochemical property of the as-formed SEI film on the electrode surface.According to the principle of SEI model[32]:

whereρis film resistivity,lis thickness of film andSis the electrode area.To simplify the model, we assumed that the change ofρandSis almost negligible during the standing time for the battery.ThereforeRSEIis positively correlated with the film thicknessl.According to the impedance value in Table 4, the G-2800-5% sample exhibits slimmer SEI film compared with the other 2 samples, indicating that developed graphitic structure is favorable to reducing the unstable sites for SEI formation[33].

Table 4 AC impedance fitting parameters of the graphite samples
In other words, graphite material with high graphitization degree and less defects can effectively overcome the damage to the graphite layer structure during intercalation or de-intercalation process, and could avoid repeatedly cracking and re-constructing of the SEI film, and finally reduce the average thickness of the SEI film, leading to improved initial capacity.The thinner SEI layer is conducive to Li ion’s charge transfer at the electrode/electrolyte interface, and thus can improve the electrochemical performance at large current density effectively.
4 Conclusion
In this work, graphites with different microcrystalline structures were prepared with anthracite and industrial silicon powder as the precursor and the catalyst respectively.The formation process was analyzed through the "carbide conversion mechanism".The asobtained G-2800-5% shows small interlayer spacing of 0.336 1 nm, large graphite crystallite size and high graphitization degree of 91.5%.The well-developed graphitic structure facilitates to the formation of a thin and uniform SEI film at the electrode/electrolyte interface.As a result, the sample delivers high specific capacity, good rate performance and long life-time.This work provides a promising approach for the efficient and clean utilization of coal resources and the development of low cost and high performance graphite anode materials.
Data Availability Statement
The data that support the findings of this study are openly available in Science Data Bank at https://www.doi.org/10.57760/sciencedb.06392 or http://resolve.pid21.cn/31253.11.sciencedb.06392.
Acknowledgements
National Natural Science Foundation of China(52072383, U1610252), Natural Science Foundation of Shanxi Province (201801D221371) and the Outstanding PhD.Program of Shanxi Province(SQ2019001).
杂志排行
新型炭材料的其它文章
- Coal-based graphene as a promoter of TiO2 catalytic activity for the photocatalytic degradation of organic dyes
- Oxygen-incorporated carbon nitride porous nanosheets for highly efficient photoelectrocatalytic CO2 reduction to formate
- 咖啡渣成型制备生物质炭及其CH4/N2分离性能
- A flexible hard carbon microsphere/MXene film as a high-performance anode for sodium-ion storage
- Microstructures and electrochemical properties of coconut shell-based hard carbons as anode materials for potassium ion batteries
- 炭纸衬底上化学气相沉积直立型二维过渡金属硫化物及其电催化产氢性能
