Identification of Potential Zinc Deficiency Responsive Genes and Regulatory Pathways in Rice by Weighted Gene Co-expression Network Analysis
2022-10-25BlaisePascalMuvunyiLuXiangZhanJunhuiHeSangYeGuoyou
Blaise Pascal Muvunyi, Lu Xiang, Zhan Junhui, He Sang, Ye Guoyou, 2
Research Paper
Identification of Potential Zinc Deficiency Responsive Genes and Regulatory Pathways in Rice by Weighted Gene Co-expression Network Analysis
Blaise Pascal Muvunyi1, Lu Xiang1, Zhan Junhui1, He Sang1, Ye Guoyou1, 2
(CAAS-IRRI Joint Laboratory for Genomics-Assisted Germplasm Enhancement, Agricultural Genomics Institute in Shenzhen, Chinese Academy of Agricultural Sciences (CAAS), Shenzhen 518120, China; Rice Breeding Innovations Platform, International Rice Research Institute (IRRI), Metro Manila 1301, the Philippines)
Zinc (Zn) malnutrition is a major public health issue. Genetic biofortification of Zn in rice grain can alleviate global Zn malnutrition. Therefore, elucidating the genetic mechanisms regulating Zn deprivation response in rice is essential to identify elite genes useful for breeding high grain Zn rice varieties. Here, a meta-analysis of previous RNA-Seq studies involving Zn deficient conditions was conducted using the weighted gene co-expression network analysis (WGCNA) and otherprediction tools to identify modules (denoting cluster of genes with related expression pattern) of co-expressed genes, modular genes which are conserved differentially expressed genes (DEGs) across independent RNA-Seq studies, and the molecular pathways of the conserved modular DEGs. WGCNA identified 16 modules of co-expressed genes. Twenty-eight and five modular DEGs were conserved in leaf and crown, and root tissues across two independent RNA-Seq studies. Functional enrichment analysis showed that 24 of the 28 conserved modular DEGs from leaf and crown tissues significantly up-regulated 2 Kyoto Encyclopedia of Genes and Genomes (KEGG) pathways and 15 Gene Ontology (GO) terms, including the substrate- specific transmembrane transporter and the small molecule metabolic process. Further, the well-studied transcription factors (and), protein kinase (and), and miRNAs (OSA-MIR397Aand OSA-MIR397B) were predicted to target some of the identified conserved modular DEGs. Out of the 24 conserved and up-regulated modular DEGs, 19 were yet to be experimentally validated as Zn deficiency responsive genes. Findings from this study provide a comprehensive insight on the molecular mechanisms of Zn deficiency response and may facilitate gene and pathway prioritization for improving Zn use efficiency and Zn biofortification in rice.
rice; biofortification; zinc deficiency; gene expression; weighted gene co-expression network analysis
Zinc (Zn) malnutrition is an alarming health concern, particularly for children from developing countries (Black, 1998; Dardenne, 2002). With the present pandemic of COVID-19, Zn malnutrition can intensify infection rates (van der Straeten et al, 2020; Akhtar et al, 2021; Huizar et al, 2021), stressing the necessity for Zn biofortification. Biofortitying Zn in rice (L.) has a great potential to improve global Zn nutritional status, as rice is a staple food for nearly half of the world’s population (van der Straeten et al, 2020).
Breeding approaches are relatively more cost-effectiveand sustainable than agronomic (i.e., chemical fertilization)or postharvest strategies used to combat Zn malnutrition (White and Broadley, 2009). Understanding the genetic and molecular mechanism of Zn uptake and transport into rice grain is necessary to genetically enhance Zn uptake and translocation into grain tissue. Plants’ response to nutrient deficiency is a complex trait with coordinated multi-layer interactions of multiple genes and signal transduction pathways for nutrient uptake and transport, biochemical adaptation, and nutrient homeostasis (Hajiboland, 2012; Zeng et al, 2019a). In addition, Zn content in rice grains is strongly influenced by soil Zn availability and the ability of crop varieties to take up Zn from the soil (Wissuwa et al, 2008; Impa et al, 2013).
Rice plant increases Zn availability for root absorption by altering the root system architecture and exuding phytosiderophores and organic acids with low molecular weight from root tissues (Ptashnyk et al, 2011; Nanda and Wissuwa, 2016; Banakar et al, 2017). The above traits are particularly associated with higher grain Zn or Fe accumulation in Zn efficient rice genotypes than inefficient genotypes (Nozoye et al, 2011; Impa et al, 2013; Nanda and Wissuwa, 2016). Zn transporter genes, including ZIP (Zn-regulated transporters and iron-regulated transporter proteins), HMAs (heavy metal ATPases) and MTPs (metal tolerance proteins), are also essential for the uptake, distribution, and cellular Zn homeostasis in different plant tissues under low Zn deficiency conditions (Ishimaru et al, 2005; Olsen and Palmgren, 2014). However, considering that grain Zn concentration is a complex trait, several other uncharacterized genes can be used in accelerating the breeding for high grain Zn if identified.
With the recent progress in next-generation sequencing, it has been possible to investigate the functions of multiple genes systematically. For example, numerous differentially expressed genes (DEGs) and molecular pathways regulating Zn deficiency have been identified in RNA-Seq studies of rice (Bandyopadhyay et al, 2017; Nanda et al, 2017; Zeng et al, 2019b; Lu et al, 2021). One of the ongoing issues is effectively utilizing the ever-increasing RNA-Seq data in breeding projects. Meanwhile, Azodi et al (2020) have demonstrated that DEGs from RNA-Seq studies can be useful when genomic selection-based breeding approaches are used to improve complex traits. However, for successfully leveraging findings from separate RNA-Seq studies, it is necessary to identify the most reliable DEGs, such as co-expressed and conserved DEGs across independent studies.
Weighted gene co-expression network analysis (WGCNA) is an established method (Zhang and Horvath, 2005), which allows identifying modules of co-expressed genes in independent RNA-Seq studies (Tan et al, 2017; Lv et al, 2019). In WGCNA, genes are linked together based on their weighted co- expression across samples. The strongly linked genes in a network are grouped as modules, while the most connected genes in a module are called hubs (Zhang and Horvath, 2005)In rice, WGCNA has been used to find core genes and modules of co-expressed genes under cadmium (Tan et al, 2017), salt (Zhu et al, 2019) and drought (Lv et al, 2019) stresses using gene expression data from various sources. WGCNA has also been used to elucidate the molecular mechanism offungus infection (Wang et al, 2018), programmed cell death (Chen et al, 2020) and blast tolerance (Tian et al, 2020) in rice.Further, WGCNA has been used in the functional annotation of rice genome (Childs et al, 2011).
This study identified conserved DEGs across previous RNA-Seq studies on Zn deficiency in rice by directly intersecting the DEGs reported in individual RNA-Seq studies. To further illustrate our findings, we used WGCNA to re-analyze earlier RNA-Seq data and construct modules of co-expressing genes. Conserved and co-expressing DEGs were finally retrieved from the co-expression network modules generated by WGCNA. In addition, regulatory genes, including transcription factors (TFs), transcription regulators (TRs), protein kinases (PKs) and miRNAs, potentially associated with the identified conserved modular DEGs, were predicted. The identified conserved modular DEGs are good candidates to track functional markers, which can be incorporated into breeding programs to improve rice grain Zn content.
RESULTS
Collection and curation of samples for co-expression network analysis
The collected RNA-Seq data consisted of 17 rice samples differing in genotypes, tissues, growth stages and durations of Zn deficiency treatment used in different studies (Nanda et al, 2017; Zeng et al, 2019b; Lu et al, 2021). As our primary objective was to identify modules of co-expressed genes under Zn deficiency conditions, correction methods were applied to adjust for the untargeted variations while maintaining variations among genotypes. Adjusting unwanted variations from different batches of studies significantly improved data quality, as shown by box plots principal component analysis (PCA) (Fig. 1). For example, samples from our study were grouped fairly closer to samples from SRP197370 (Zeng et al, 2019b), SRP083865 (Nanda et al, 2017) and SRP117202 (Lu et al, 2021) studies after correcting the batch effects (Fig. 1-B). Similarly, the separation of the in-house leaf and root samples was fairly reduced after removing the unwanted variations caused by different plant tissues used in the different studies. After the above data quality control procedures, fragments per kilobase of transcript per million mapped fragments (FPKM) table of 17 samples and 19 316 transcripts was generated and used as input for WGCNA (Table S1).
Modules of co-expressed genes and prediction of modules’ functions
WGCNA identified 16 modules of co-expressed genes (Table 1 and Fig. S1). Gene Ontology (GO) terms and Kyoto Encyclopedia of Genes and Genomes (KEGG) terms enrichment analysis were conducted for each identified module. In addition, we studied the distribution of previously experimentally validated Zn deficiency responsive (ZDR) genes (Table S2) (Swamy et al, 2016) in the detected modules. At least one significantly [false discovery rate (FDR) < 0.05] enriched GO term or KEGG pathway was found for each module (Tables 1 and S3). Mitogen-activated protein kinase (MAPK) signaling pathway-plant, and phenylpropanoid biosynthesis functional annotations were significantly enriched in at least two modules (Table 1). Genes co-expressing in the ‘E’ module enriched the highest number of functional annotations: 42 GO terms and 3 KEGG pathways (Table S3). Besides, 48 of 61 validated ZDR genes were found in 11 different modules (Table 1). Since the molecular functions and genes recognized for Zn or Fe uptake and transport to the grain tissue were found distributed across all the detected modules, all the 16 modules were considered in the next step to identify the uncharacterized potential ZDR genes.
Co-expression of uncharacterized conserved DEGs with validated ZDR genes in assembled modules
We hypothesized that DEGs conserved across previous independent RNA-Seq studies on Zn deficiency in rice and that co-express with the validated ZDR genes in the identified modules were also potential regulators of the molecular mechanism of Zn deficiency response in rice. To find these potential new ZDR genes, we first identified conserved DEGs across different RNA-Seq studies and then extracted the identified conserved DEGs from the identified modules (Fig. S2).
For root tissue samples, five DEGs were found conserved across the DEGs from two previous RNA-Seq studies (Table S4) (Zeng et al, 2019b; Lu et al, 2021). Of these conserved DEGs,,, andwere up-regulated in the both studies and co-expressed with validated ZDR genes in ‘B’, ‘D’ and ‘G’ modules, respectively (Table S4). The functional annotations for these conserved and up-regulated modular DEGs were: serine-type endopeptidase activity (), copper ion binding, electron carrier activity () and positive regulation of auxin-mediated signaling pathway () (Table S4). Besides,and(a well-studied transcription factor regulating the expression of Fe responsive genes) found in ‘E’ and ‘K’ modules, respectively were both repressed across the two previous RNA-Seq studies (Table S4).
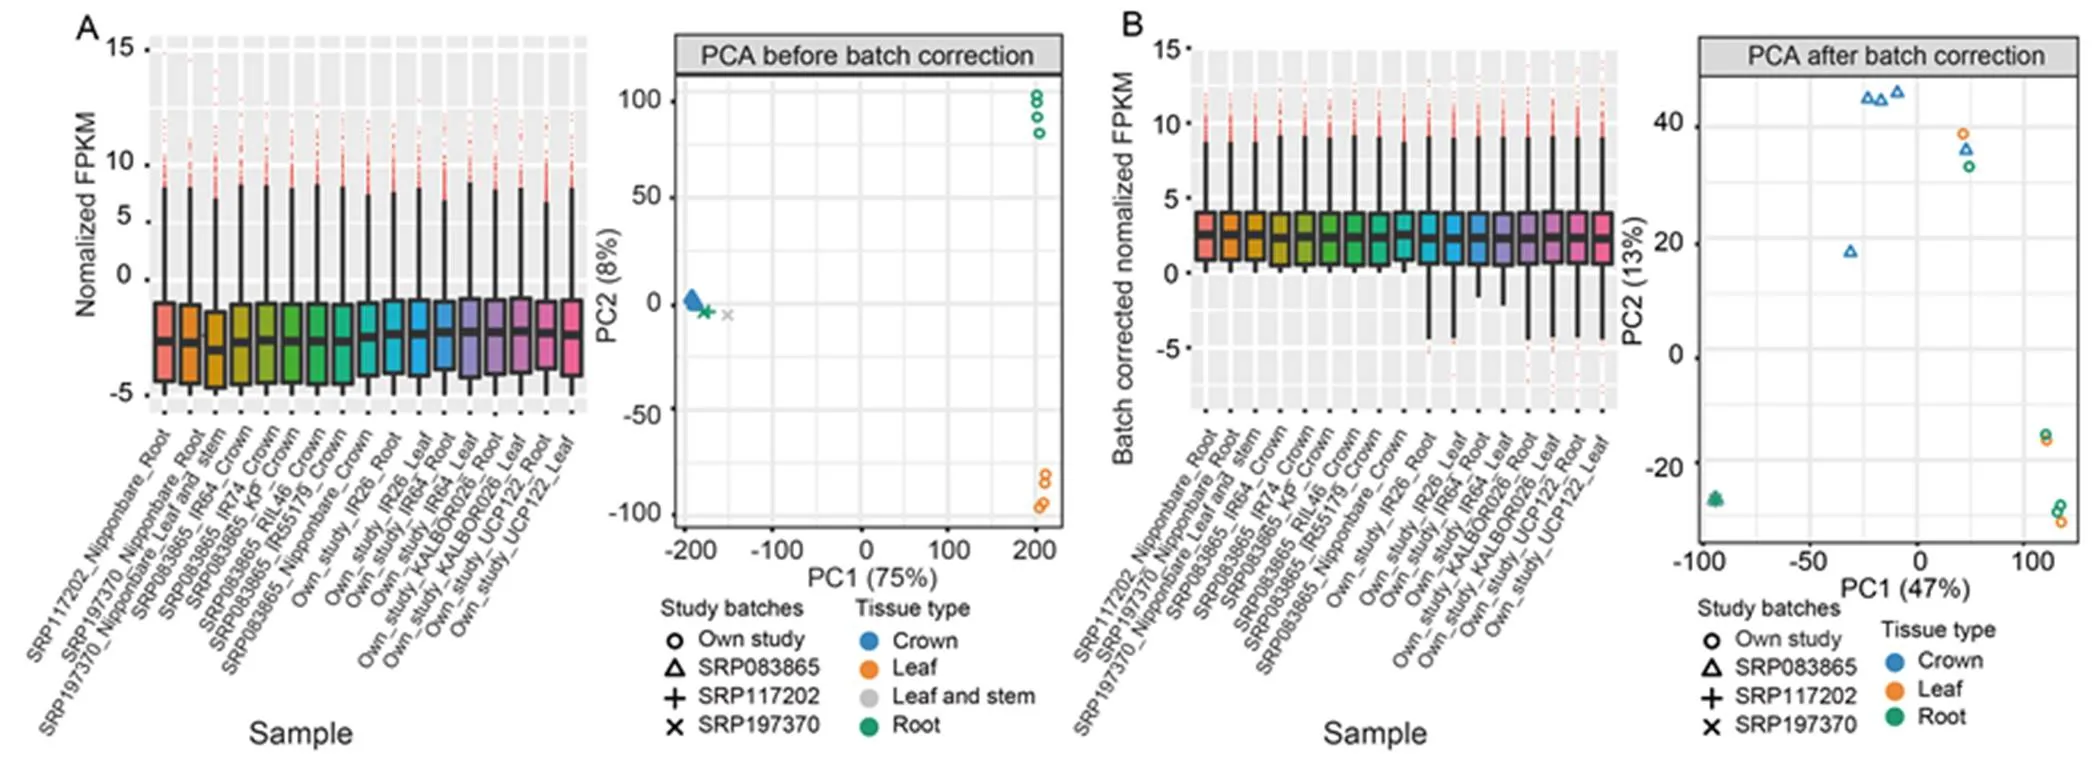
Fig. 1. Box plot and principal component analysis (PCA) using normalized fragments per kilobase of transcript per million mapped fragments (FPKM) before (A) and after (B) batch correction in 17 samples.
Samples with SRP197370, SRP083865 and SRP117202 were from Zeng et al (2019b), Nanda et al (2017) and Lu et al (2021), respectively. Only samples in the first two PCA axis were shown.
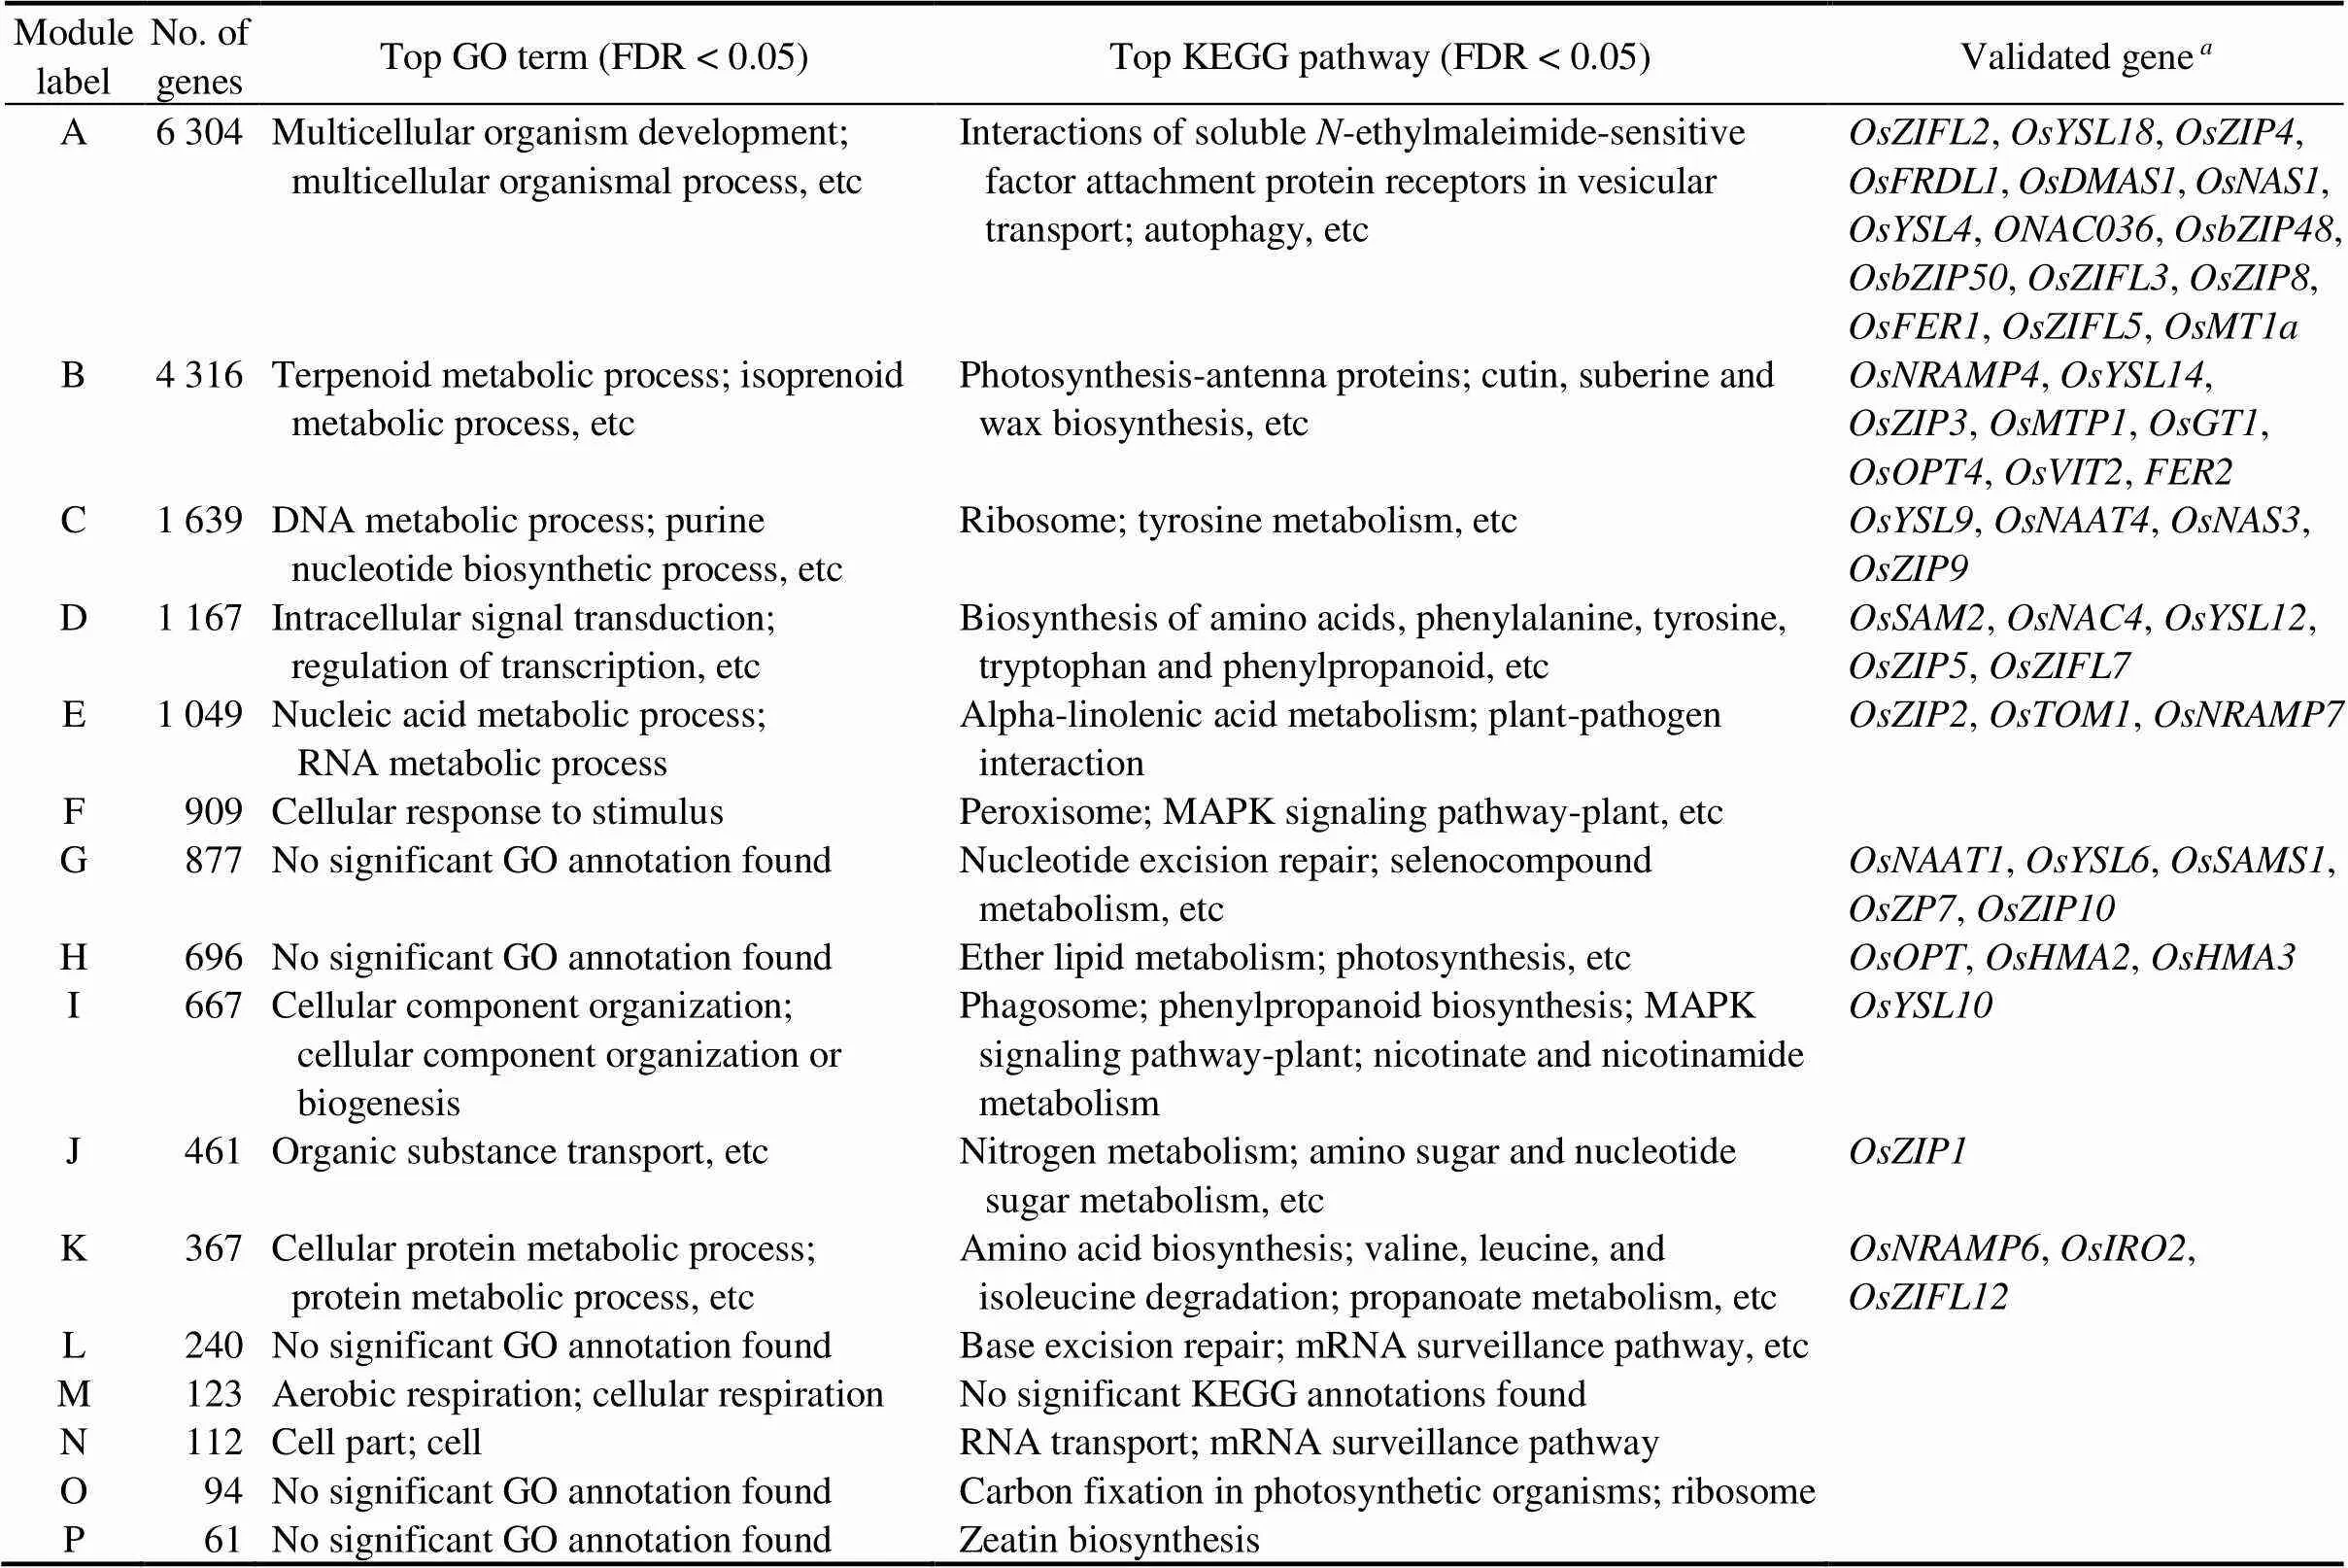
Table 1. Modules’ functional annotation and distribution of functionally validated Zn deficiency responsive genes in detected modules.
Total validated modular genes were 48. GO, Gene Ontology; KEGG, Kyoto Encyclopedia of Genes and Genomes; FDR,False discovery rate; MAPK, Mitogen-activated protein kinase.
Meanwhile, 32 DEGs were found conserved across the DEGsidentified by Nanda et al (2017) and our studyin crown and leaf tissues (Table S5), and 28 of them were found in 11 different modules, namely ‘A’, ‘B’, ‘C’, ‘D’, ‘E’, ‘F’, ‘G’, ‘H’, ‘I’, ‘J’ and ‘N’ (Table S5). Among these conserved modular DEGs, 24 were up-regulated in the both studies, including 6 validated ZDR genes,,,,,and(Table S5).
The rest of the conserved up-regulated modular DEGs are yet to be experimentally validated.,andco-induced with validated ZDR genes,, etc.,in the ‘A’ module.andco-upregulated with validated ZDR genes,, etc., inthe‘D’ module, whileandco-upregulated with well-studied ZDR genes,andin the ‘G’ module. The uncharacterized conserved up-regulated modular DEGs,,and, were also found co-induced with two well-studied ZDR genes,andin the ‘C’ module (Table S5). Lastly,andwere up-regulated in Nanda et al (2017) and our study, andco-upregulated with validated ZDR genes,, etc.,in the ‘B’ module (Table S5).
Functional annotations of identified conserved and up-regulated modular DEGs
Functional annotation analysis indicated that the 24 conserved and up-regulated modular DEGs significantly (FDR < 0.05) enriched 15 GO annotations (Tables 2 and S6) and 2 KEGG pathways (phenylalanine, tyrosine and tryptophan biosynthesis, and oxidative phosphorylation) (Table S6). The substrate-specific transmembrane transporter activity was the most significantly (FDR = 0.00010) enriched GO term.
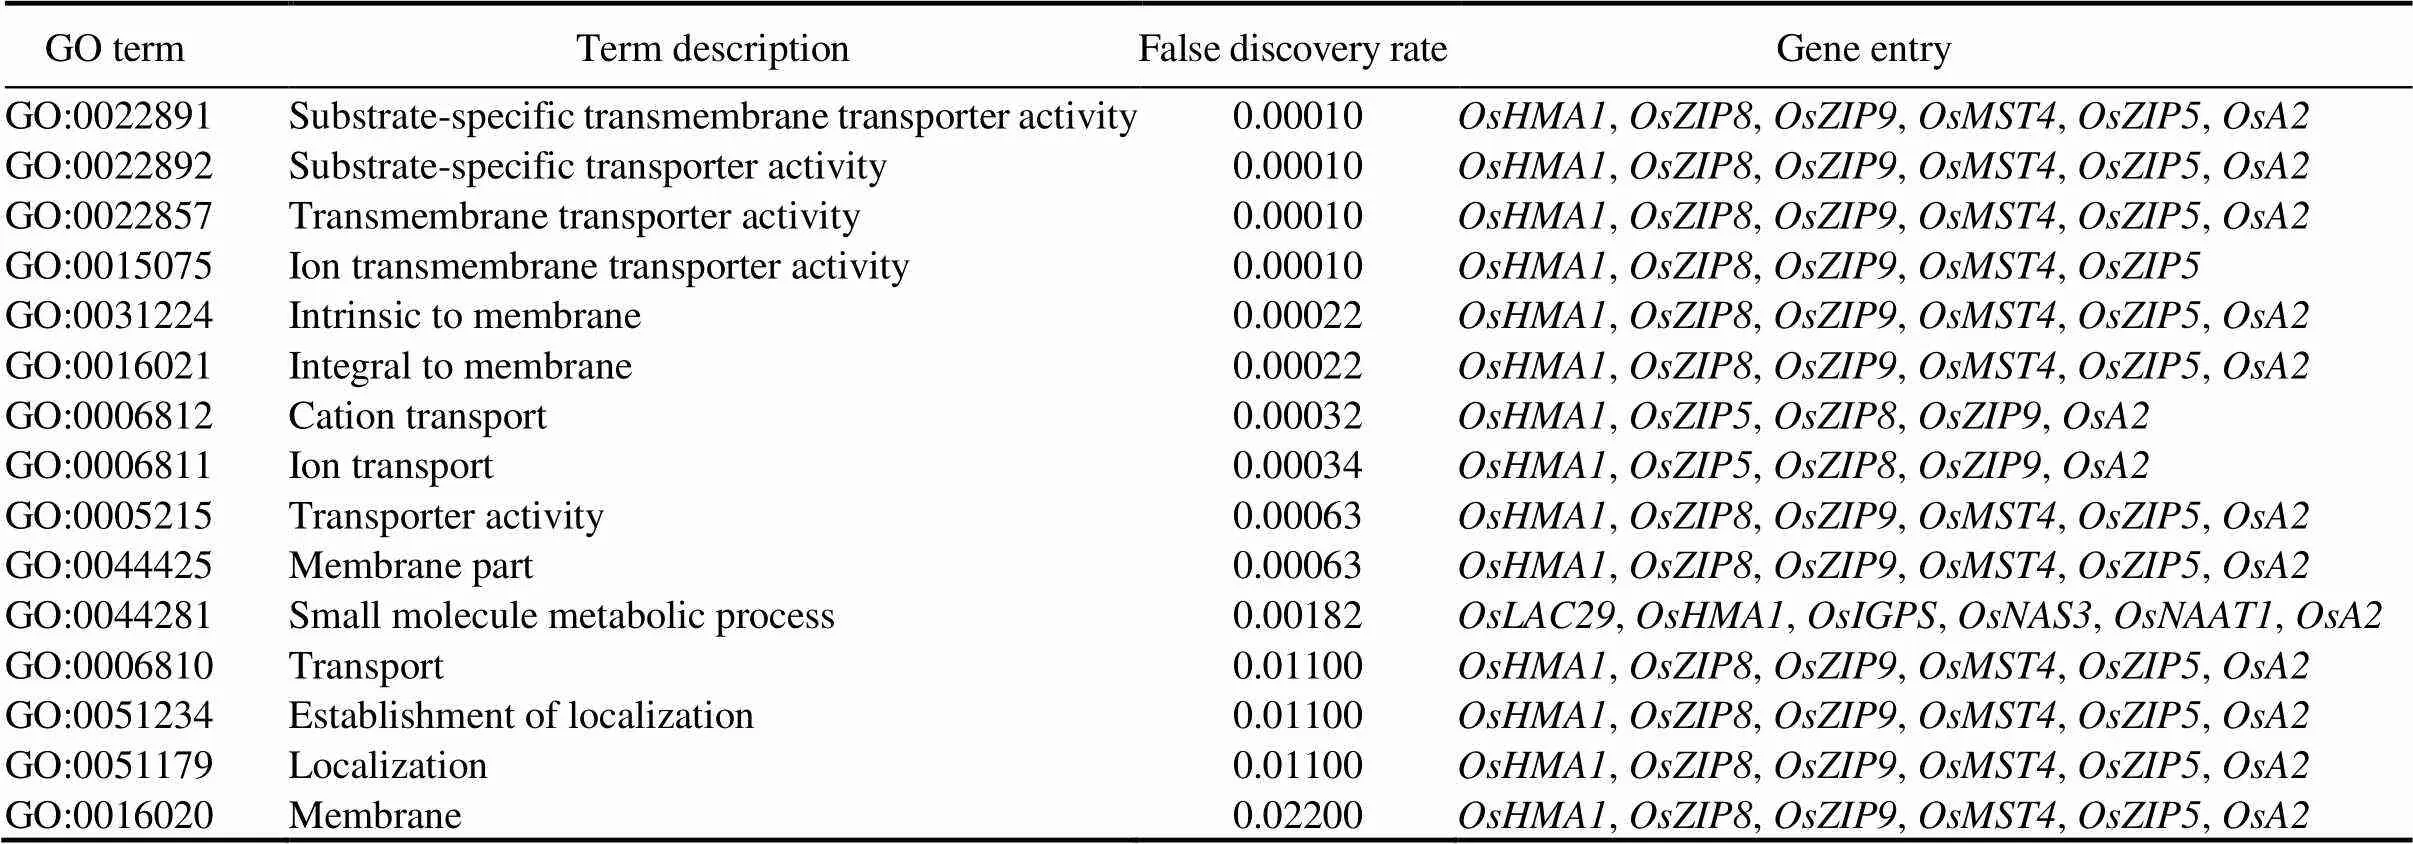
Table 2. Gene ontology (GO) annotations significantly enriched by conserved and up-regulated modular genes.
Other significantly affected GO annotations included small molecule metabolic process (FDR = 0.00182), and cation transport (FDR = 0.00032) (Table 2). Conserved up-regulated modular DEGs uncharacterizedfor ZDR functions, such as,,,,and, were found across more than 12 different GO annotations (Table 2).
Identification of miRNA target genes in conserved up-regulated modular DEGs
microRNAs play essential roles in nutrient homeostasis regulation (Zeng et al, 2014).prediction of miRNAs that potentially target the identified 24 conserved and up-regulated modular DEGs was conducted using http://structuralbiology.cau.edu.cn/ PlantGSEA/ database (Yi et al, 2013). In total, 30 miRNAs were predicted to target 5 conserved up-regulated modular DEGs (Fig. 2). A functionally characterized ZDR gene,, was a predicted target for 23 of the 30 identified miRNAs. The other four conserved and up-regulated modular DEGs uncharacterized for ZDR roles were also predicted as targets for different miRNAs./was target of OSA- MIR397A.2,OSA-MIR397Band OSA-MIR397B.2;was target ofOSA-MIR1858Aand OSA-MIR1858B;was target ofOSA-MIRF11620 while/was target of OSA-MIRF12033 (Fig. 2).
Prediction of regulatory genes controlling expression of identified conserved modular DEGs
Regulatory genes, such as TFs, TRs and PKs, regulate many aspects of plant growth and development and response to biotic and abiotic stimuli (Zheng et al, 2016). Regulatory genes directly interacting with the identified conserved modular DEGs were searched from all the genes co-expressed with the conserved modular DEGs in different modules. A total of 44 TF genes directly interacted with the conserved modular DEGs (Fig. S3). The most represented TF families were AP2/ERF and MYB. The other TFs belonged to NAC, ERF, bHLH, bZIP, HB-WOX, HB-KNOX and HD-ZIP families., a phytosiderophore gene, interacted with TFs that modulate several morpho-genetic events, includingand(Fig. S3-A and Table 3) and a monosaccharide transporter gene,. TF genes involved in the signaling of jasmonate (), ethylene () and cytokinin and auxin () were relatively more enriched in subnetwork ‘D’ (Fig. S3-B), where they interacted with two co-upregulated and conserved modular genes,(already validated) and. Interestingly, another TF gene,, which is also involved in cytokinin and auxin signaling (Table 3), interacted with a conserved modular DEG,(already validated)insubnetwork ‘A’(Fig. S3-BC)In the same subnetwork, three TR genes also directly interacted with. Similarly, a TR gene,, from the cytokinin signaling gene family interacted withinsubnetwork ‘A’.
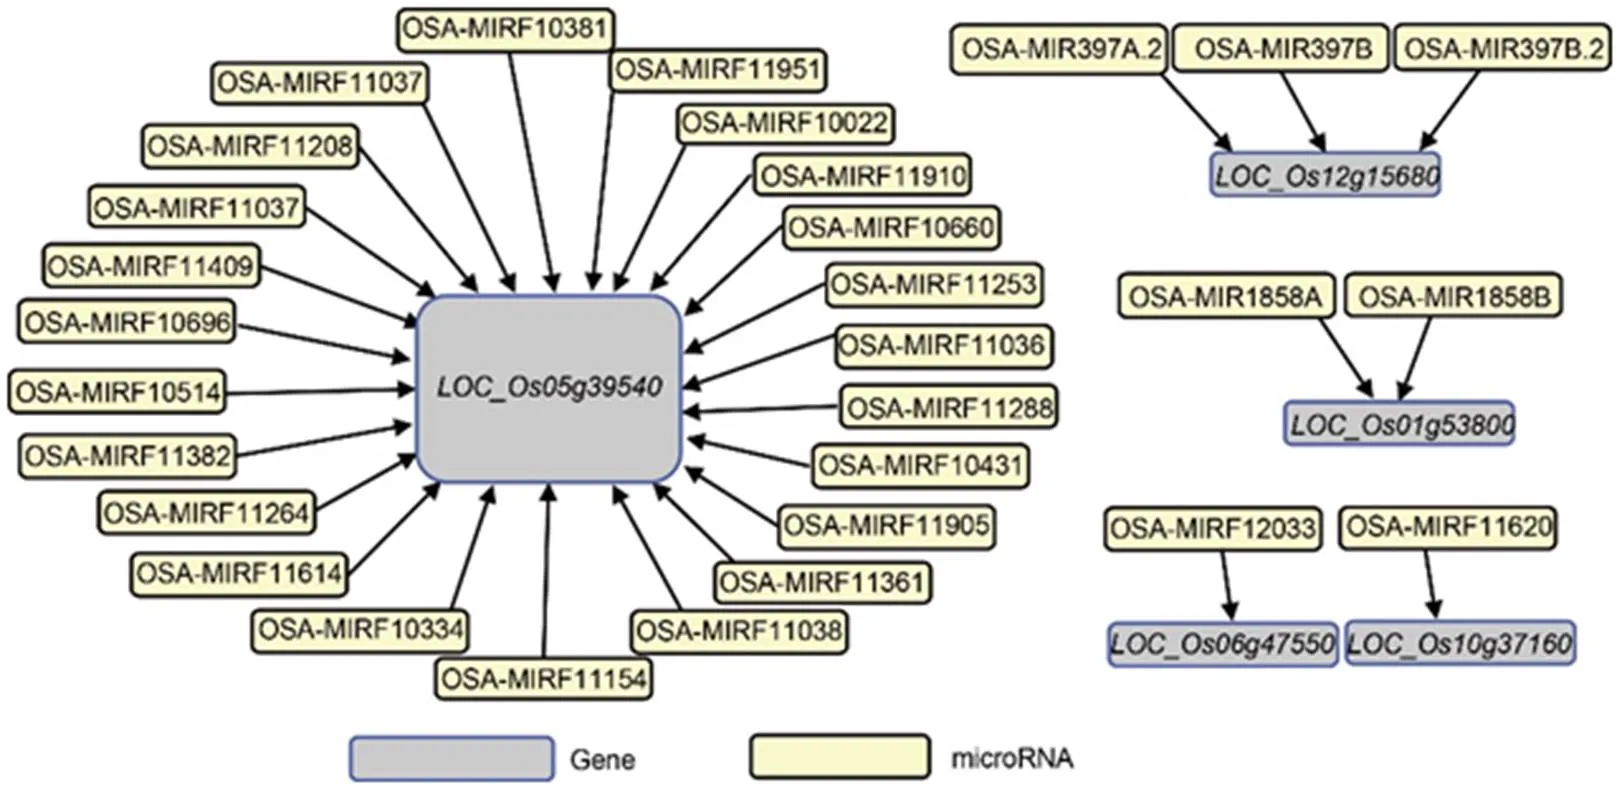
Fig. 2. miRNAs targeting the identified conserved differentially expressed modular genes.
miRNAs were retrieved from http://structuralbiology.cau.edu.cn/PlantGSEA/database (Yi et al, 2013).
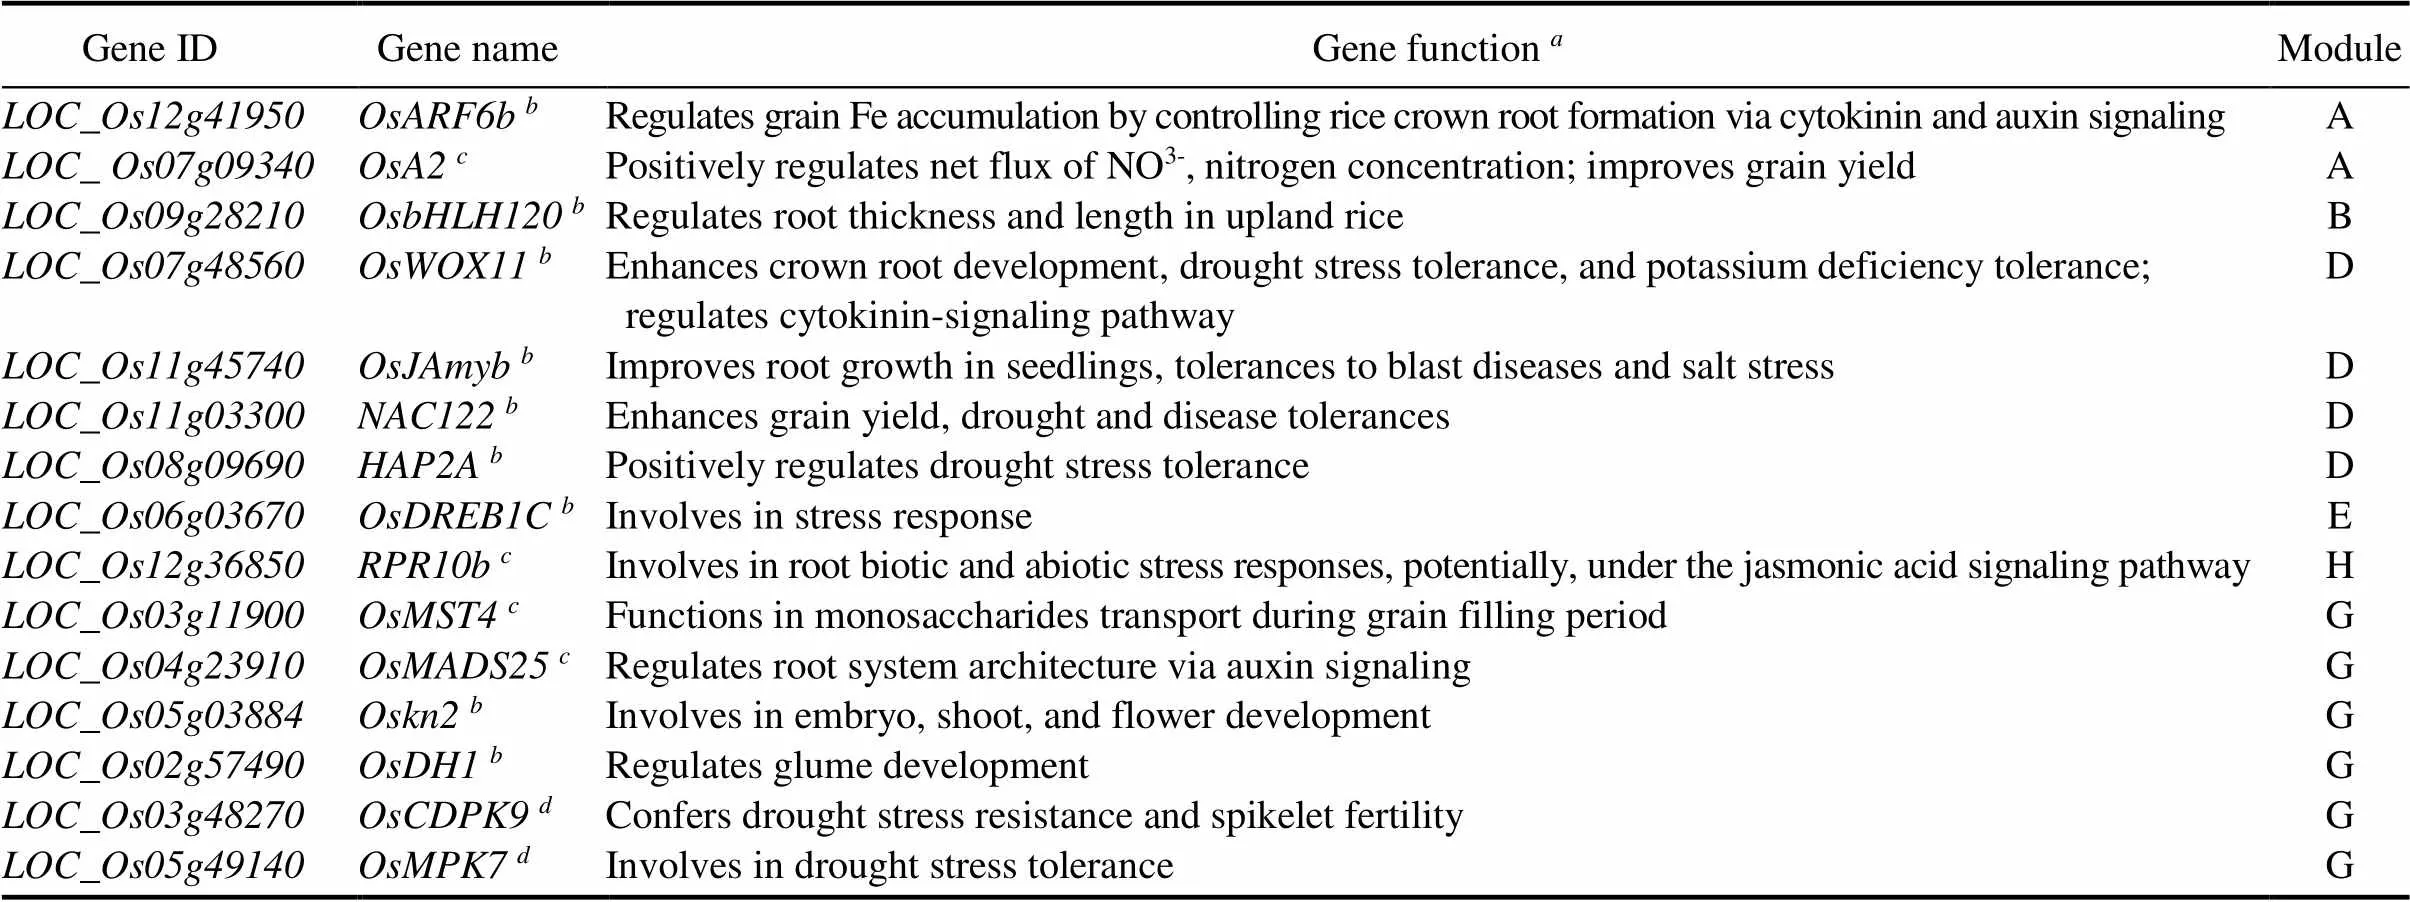
Table 3. Known functions of regulatory genes interacting with conserved differentially expressed modular genes.
Gene functions were retrieved from https://funricegenes.github.io/database (Yao et al, 2018).Transcription factors.Conserved modular differentially expressed genes.Protein kinase genes.
In addition to TF and TR genes, 36 PK genes interacting with the conserved modular DEGs were identified (Fig. S3). Of the 36 PK genes, 27 (75%) PK genes belonged to the receptor-like kinase (RLK) family. The other PK genes were from the calcium- dependent protein kinase (CDPK), calcineurin b-like protein-interacting protein kinase, kinase-like kinase, cysteine-rich-receptor-like kinase and MAPK families. Two RLK genes (and)interacted within subnetwork‘G’ (Fig. S3-A),whileinteracted with(already validated) in subnetwork ‘D’ (Fig. S3-B). Two CDPK genes,and, which are implicated in the signaling of Ca2+genes, interacted with conserved modular genes,and(a monosaccharide transporter gene), in subnetworks ‘E’ (Fig. S3-D) and ‘G’ (Fig. S3-A), respectively. Lastly,interacted withinsubnetwork ‘B’ (Fig. S3-E).
qRT-PCR validation of RNA-Seq expressions of conserved modular DEGs
We conducted a qRT-PCR analysis for nine randomly selected conserved modular genes to validate the expression of the detected conserved modular DEGs. The reported RNA-Seq fold changes for the selected genes, including/,,,,,,and(Tables S5 and S7) were found consistent with qRT-PCR fold changes (Fig. 3). These results suggested that the identified conserved modular DEGs interacting with different regulatory proteins and miRNAs are potentially involved in signaling pathways of Zn deficiency responses in rice (Fig. 4).
DISCUSSION
Utilization of publicly available RNA-Seq data
Our datasets consisted of RNA-Seq data from previous, independently-conducted studies on Zn deficiency in rice (Nanda et al, 2017; Zeng et al, 2019b; Lu et al, 2021). The rationale of integrating expression data from multiple sources includes increased statistical power,use of rare specimens, investigation of variance and noise, and the prediction of biological markers, which would be not evident in separate small-scale projects (Kumar Sarmah and Samarasinghe, 2010).
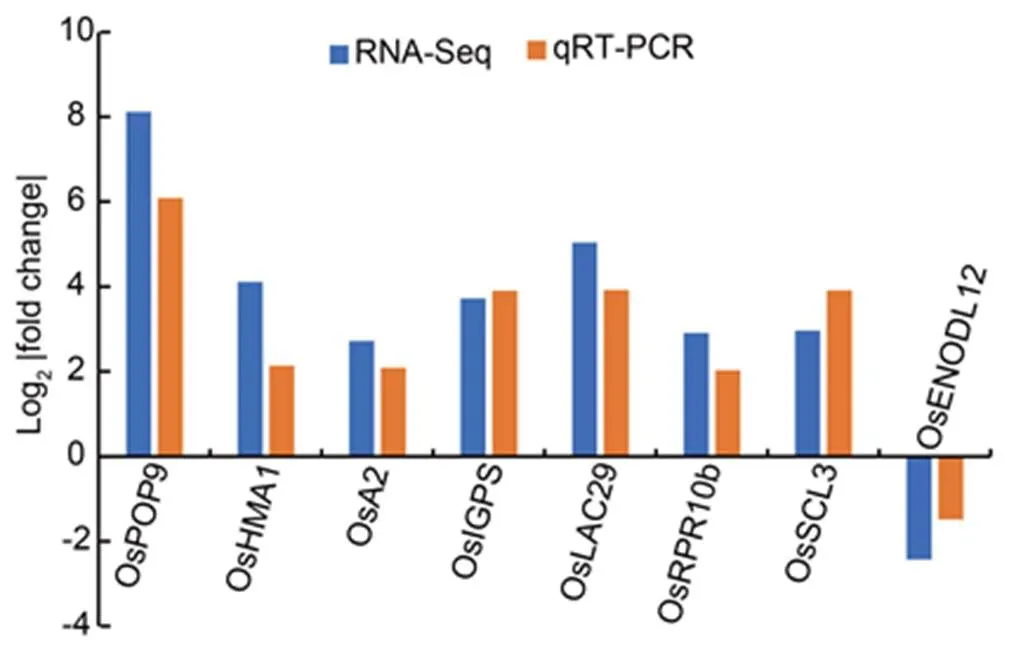
Fig. 3. qRT-PCR validation of RNA-Seq expression of conserved differentially expressed modular genes.
RNA-Seq fold changes, which have been reported for root (Table S5) and crown (Table S7) in Nanda et al (2017) and Zeng et al (2019b), respectively, were compared with the obtained qRT-PCR based fold change for the same tissues. During qRT-PCR, expression levels under the control conditions (Zn supply) were normalized to 1 for both root and crown tissues.was used as an internal reference. The Pearson correlation indicated a positive significant (< 0.05) correlation (2= 0.87) between fold changes obtained based on RNA-Seq and qRT-PCR analyses.
WGCNA allows the identification of co-expressed genes among independent gene expression studies (Tan et al, 2017). Nevertheless, the inherent data heterogeneity from different studies needs to be adequately handled for reliable results. Many algorithms are available to reduce heterogeneity in data from various sources (Ritchie et al, 2015; Zhang et al, 2020). The success of such adjustment procedures is usually demonstrated with PCA, boxplot, or hierarchical clustering dendrogram (Luo et al, 2010; Zhou et al, 2019). Here, we reduced data heterogeneity from the collected RNA-Seq datasets by applying the ‘remove batch effect’ function of the Limma R package (Ritchie et al, 2015) on normalized FPKM values. The PCA results showed that samples were grouped more closely after correcting the batch effects in studies from different sources (Fig. 1).
Significance of identified modules with genetic and molecular mechanism of Zn deficiency in rice
WGCNA identified 16 modules of co-expressed genes. The validated ZDR genes found in different assembled modules included Zn ion transmembrane transporter genes (,,,,and), transmembrane transporter genes (and), mugineic acid biosynthesis and transporter genes (,,and), nicotianamine acid gene (), yellow-stripe-like genes (and),and metallothionein protein-coding gene () (Table 1).is involved in Zn uptake and distribution in rice tissues (Lee et al, 2010), andis essential for Zn uptake and distribution in different tissues (Huang et al, 2020; Yang et al, 2020). Also, the expression ofcorrelates with high iron (Lee et al, 2009) and Zn (Maurya et al, 2018) concentrations in rice seeds. Similarly, mugineic acids and nicotianamine acids are low-molecular-weight metal chelators from the phytosiderophores associated with high accumulation of Zn or Fe into rice grain (Banakar et al, 2017). In addition,(a 2′-deoxymugenic acid efflux transporter gene) enhances tolerance to both Zn (Ishimaru et al, 2011) and Fe (Nozoye et al, 2011) deficiencies in rice. Therefore, targeting mugineic acid genes is proposed as an effective strategy for improving Zn and Fe in rice endosperm (Singh et al, 2017). Likewise, metallothionein protein genes are metal chelators that bind transition metals such as Zn (Sinclair and Krämer, 2012). Overexpressingin rice enhances Zn-induced CCCH Zn-finger TFs expressions, reactive oxygen scavenging capacity, drought stress tolerance and Zn concentrations in rice tissues (Yang et al, 2009). Modules in which these functionally validated ZDR genes co-express may have key roles in the molecular mechanism of Zn deficiency response in rice.
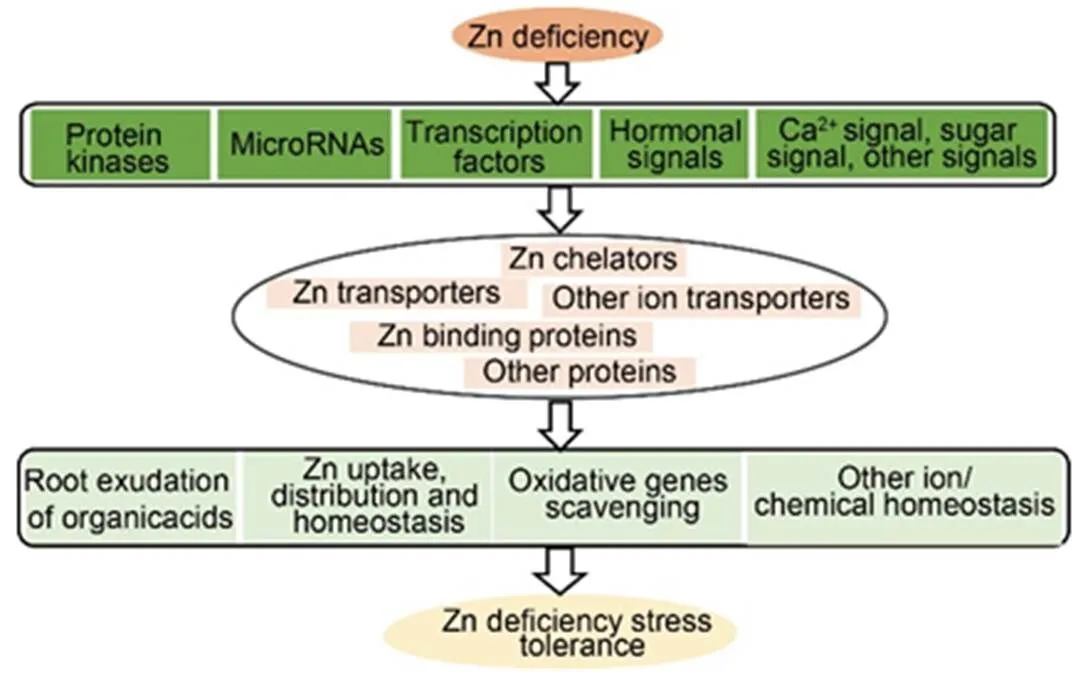
Fig. 4. A theoretical model for signaling pathways underlying Zn deficiency responses in rice.
Zn deficiency stress first activates regulatory proteins, such as miRNAs,protein kinases, and transcription factors that modulate various hormonalstress responses, sugar transports, and morphogenetic events. Following that, regulatory proteins induce the expression of the downstream Zn responsive genes, including the small-molecule metabolic process genes, Zn transporter genes, transmembrane transporter genes, metal binding and reactive oxygen species scavenging genes, ion or chemical transporter genes and sugar transporter genes.
Uncharacterized conserved modular DEGs are potentially involved in Zn deficiency response in rice
The identified new candidate ZDR genes are conserved across different RNA-Seq studies and co-expressed with the experimentally validated ZDR genes, including,,,,andin different identified modules. These findings suggested potential functional similarities between the identified conserved modular DEGs and the already known ZDR genes.
Further, we found that conserved modular DEGs which up-regulated in crown and leaf tissues enriched several functional annotations, including the substrate- specific transmembrane transport activity, small molecule metabolic process, and cation transport (Table 2). The significant enrichment of the small molecule metabolic process corroborates previous results that the root exudation of low-molecular- compounds is essential for immobilizing and uptaking solubilized Zn or Fe from the soil to root tissues (Suzuki et al, 2008). Conserved modular DEGs found in the small molecule metabolic process included the well-studied phytosiderophores family genes,and,and theuncharacterized conserved modular DEGs,,andCuriously,andwere also predicted as targets of OSA-MIR397A.2/OSA- MIR397B and OSA-MIR397B.2 miRNAs, which are involved in rice stress response, respectively. Particularly, OSA-MIR397B is induced by Zn deficiency in rice (Zeng et al, 2019b) and up-regulated in flag leaves of the drought-tolerant rice variety Nagina 22, while it is repressed in susceptible genotypes (Pusa Basmati 1 and IR64) under drought stress conditions (Balyan et al, 2017).
Closest hubs of conserved modular DEGs are well-known stress regulatory genes
Regulatory genes such as TFs and TRs are involved in several stress responses by acting upstream of stress-inducible genes (de Los Reyes et al, 2015). PK genes also regulate various plant signal transduction cascades under nutrient deficiency stress (Gratz et al, 2019). Here, regulatory genes with strong connectivity with the conserved modular DEGs were mined to predict upstream regulators of ZDR genes. We observed direct gene-gene interactions between the conserved modular DEGs and various regulatory genes that mediate multiple morphogenetic events and hormonal stress responses (Table 3). These included TFs involved in the signaling of stress and abscisic acid (,,and),jasmonate (), ethylene (and), and cytokinin or auxin(,and) (Fig. S3).
The TF genesand, involved in the cytokinin or auxin signaling pathway, have also been associated with crown root development under iron deficiency and drought stress, respectively(Qi et al, 2012; Cheng et al, 2016). In rice, cytokinin inhibits crown root development, while auxin promotes the process (Rani Debi et al, 2005; Kitomi et al, 2011).
is an/homolog that positively regulates the expression of several genes involved in Fe uptake in rice(Ogo et al, 2006),In addition, both TFs have a homeodomain leucine zipper (HD-Zip 1) element known to mediate various hormone and stimulus responses (Ariel et al, 2007). Therefore, whether the activity ofunder Zn or Fe deficiency is similar torequires further studies.
Conserved modular DEGs also interacted with several PK genes, including the calcium-dependent protein genes (and) (Fig. S3-A and -D) and mitogen-activated protein gene () (Fig. S3-B), which are associated with important agronomic traits in rice (Table 3). Of the identified PK and TF genes,,,,andhave been reported as Zn deficiency induced genes in at least one previous RNA-Seq study (Table S5) (Nanda et al, 2017; Zeng et al, 2019b). The above findingsuggested that the regulation of hormonal stress responses and Ca2+signals are important in Zn deficiency stress adaptation.
However, we recognized that the long durations of Zn deficiency treatment (i.e., one month of Zn stress treatment) in the analyzed datasets can also trigger the expression of regulatory genes involved in the general stress response mechanisms. Therefore, the observed changes in gene expression may not be attributed solely to Zn deficiency stress. Nevertheless, we found that the regulatory genes largely showed the same expression pattern with their interacting conserved modular DEGs (Table S5 and Fig. S3). Subsequently, a theoretical model of signaling pathways underlying Zn deficiency stress response is proposed based on the detected interrelationships between the conserved modular DEGs and the well-studied regulatory genes (Fig. 4).
Potential use of identified genes for biofortification of grain Zn
There is a great scope for using the identified conserved modular DEGs in breeding programs involving genomic selection. Genomic selection approaches which exploit the genomic markers have proven promising in accelerating the genetic enhancement of complex traits, including Zn (Meuwissen et al, 2001; Guo et al, 2020; Xu et al, 2021). However, several studies showed that the predictive ability of genomic selection models can be improved by prioritizing trait-relevant markers from high-density marker panels (Spindel et al, 2016; Ahmadi et al, 2021). Here, co-expression network analysis enabled the identification of multiple genes co-regulated with transgenically validated grain Zn genes, suggesting potential functional similarities. Therefore, genomic selection models prioritizing markers in the boundaries of the validated grain Zn genes and the identified conserved modular genes will potentially outperform traditional models with whole genomic features and accelerate breeding efficiency.
Further, attempts on the biofortification of grain Zn/Fe in rice via transgenic techniques have shown promising results (Singh et al, 2017). Therefore, if functionally validated, the identified conserved modular DEGs can facilitate the development of transgenic or genome-edited biofortified crops. Nevertheless, mainstreaming varieties developed from unconventional methods is likely to face regulatory barriers in most developing countries where Zn malnutrition is highly prevalent. An illustration of the potential use of the newly identified or known ZDR genes in breeding schemes for high grain Zn is provided (Fig. 5).
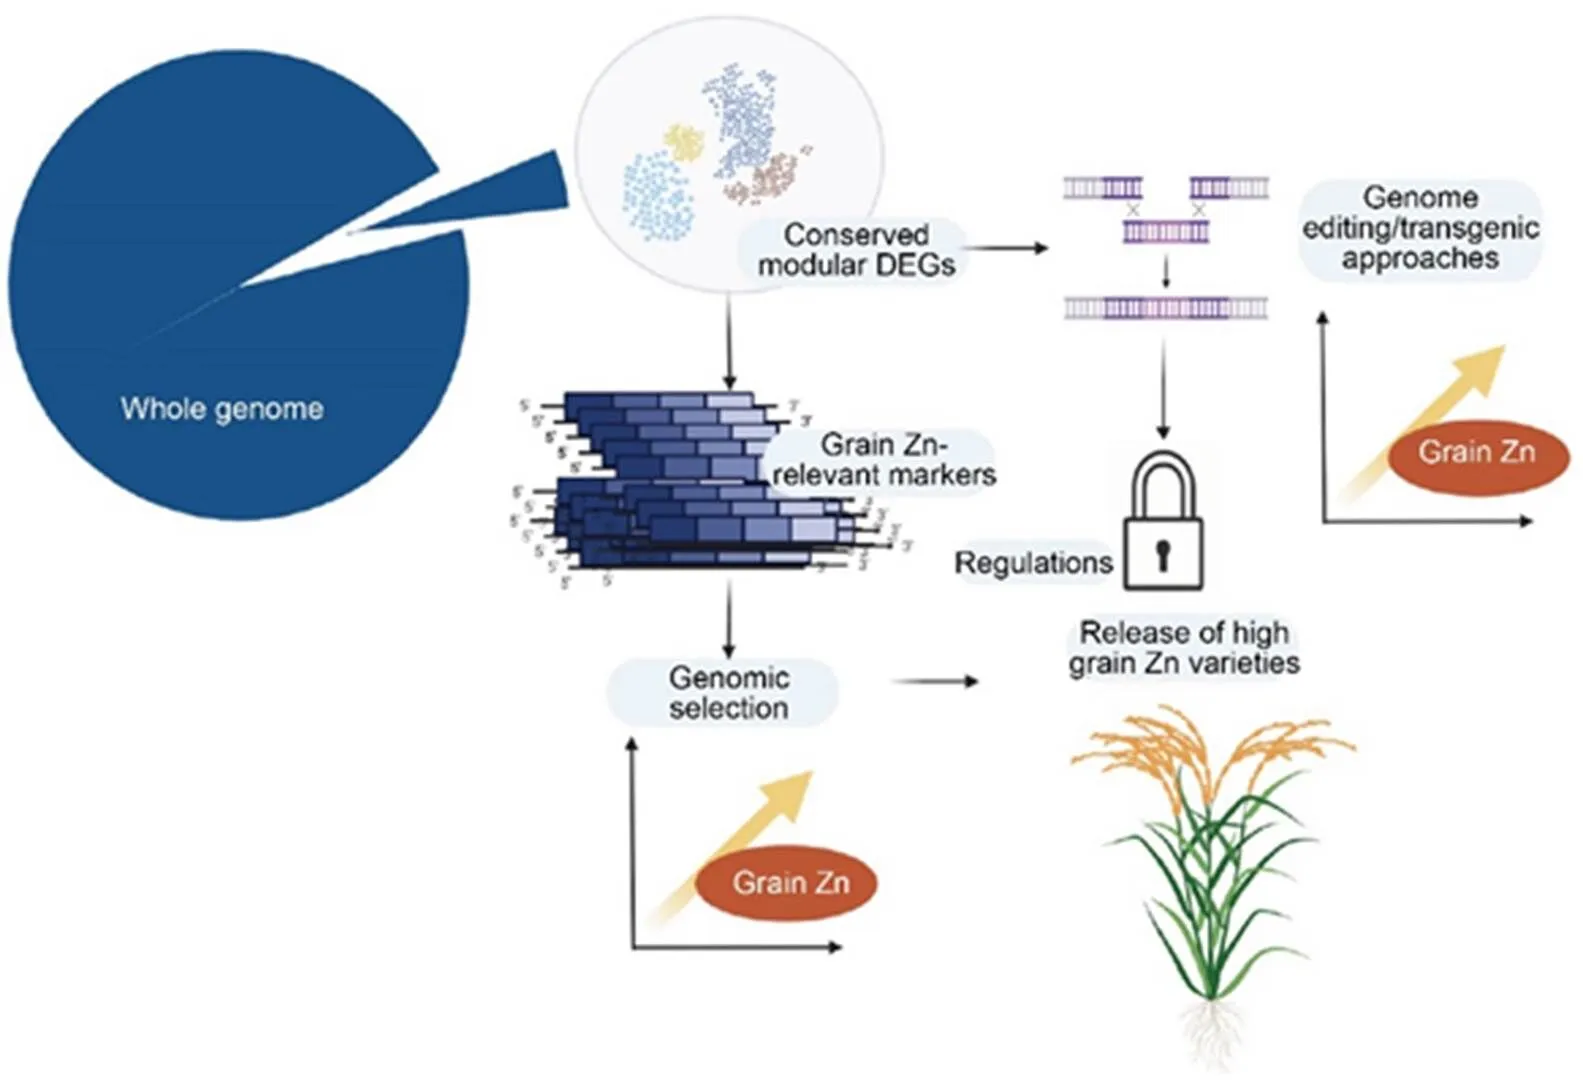
Fig. 5. An illustration of potential use of conserved modular differentially expressed genes (DEGs) in breeding schemes for high grain Zn.
Co-expression network analysis allows identification of modules of co-expressed genes. By intersecting modular genes with DEGs reported in different studies on Zn deficiency stress, conserved modular DEGs are obtained. In the next stage, grain Zn-relevant markers can be obtained by selecting features in the proximities of conserved modular DEGs. Finally, the functional markers identified can be deployed in genomic selection models to improve prediction accuracy of high grain Zn lines. Besides genomic selection-based methods, if functionally validated, conserved modular DEGs could also facilitate the development of high-grain Zn via genome editing or transgenic methods. However, food regulations in most developing countries are likely to obstruct delivery of genome-edited or genetically modified biofortified crops.
WGCNA identified 16 modules of co-expressed genes in rice. DEGs that are conserved in different RNA-Seq studies on Zn deficiency and co-express with the experimentally validated ZDR genes could have essential functions in Zn uptake and transport into rice grain. Further, transcription factors, protein kinase genes, and miRNAs targeting some of these conserved modular DEGs were also predicted. Given that rice grain Zn content is a complex trait controlled by many genes, the identified conserved modularDEGs may facilitate precision breeding by targeting the most relevant genes and molecular pathways to enhance Zn biofortification in rice.
Methods
Sample collection and FPKM table generation
An FPKM table (Table S7) was generated by an RNA-Seq service provider for eight Zn deficiency-treated rice samples (four different genotype samples, each with root and leaf tissues). The rice genotypes used were twoecotypes (UCP122 and KALIBORO26) and twovarieties (IR26 and IR46) from the International Rice Research Institute collection. We previously used FPKM values of root tissue to identify ZDR genes (Lu et al, 2021). However, FPKM values of leaf tissue were for the first time used in this study. The filtering statistics and quality check results from the pipeline that generated the FPKM values for the both tissues were provided in Table S8 and Fig. S4, respectively. In addition, we also used publicly available raw RNA-Seq datasets from https://www.ncbi.nlm.nih.gov/Traces/study/?acc= SRP197370&o=acc_s%3Aa (Zeng et al, 2019b), https://www. ncbi.nlm.nih.gov/Traces/study/?acc=SRP083865&o=acc_s%3Aa (Nanda et al, 2017), and https://www.ncbi.nlm.nih.gov/ Traces/study/?acc=SRP117202%20&o=acc_s%3Aabio-projects (Table S5). Samples from the public datasets consisted of nine Zn deficiency-treated samples of genotypes belonging to(Nipponbare and KP) and(IR55179, RIL46, IR64 and IR74) ecotype groups, and they included root, stem, leaf and crown tissues. The retrieved raw RNA-Seq datasets for these samples were fed into our RNA-Seq pipeline to obtain their corresponding FPKM values.
Briefly, our RNA-Seq pipeline began with quality processing of the retrieved raw reads with trimmomatic tool (Bolger et al, 2014), which eliminated low-quality reads (reads with poly-N, reads containing an adapter, and reads with Phred quality score of 20, corresponding to reads with base call accuracy of 99%) from the raw reads. Next, clean reads were mapped to the Michigan State University rice reference genome (MSU7) using the HISAT2 alignment tool (Pertea et al, 2016). Only reads mapped with a mapping quality score (MAPQ) > 30 were selected using the SAM tool version 0.1.19 (Li et al, 2009). A BAM file of quality reads generated by the SAM tool was then fed into the subread tool (Liao et al, 2014) along with a gene model annotation file to generate a table of gene counts. The reference genome and the annotation files were both obtained from the Illumina’s iGenomes project (htttp://support.illumina. com/sequencing/sequencing_software/igenome.html). As the RNA-Seq dataset obtained from Lu et al (2021) was in FPKM, and given the impracticability of converting FPKM values to gene counts, the obtained gene count matrix from our RNA-Seq pipeline was rather converted into FPKM (Table S9) with an in-house R script and then merged with the FPKM table from the RNA-Seq service provider (Table S7). After averaging sample replicates from each of the studies, an FPKM table of 17 samples (Table S1)was finally generated for subsequent data quality check analysis.
Data quality processing for WGCNA
The value of co-expression network analysis with WGCNA depends on the quality of datasets being used. Unfortunately, the publicly available RNA-Seq samples on Zn deficiency in rice were from small-size independent projects and have significant levels of heterogeneity (different tissue types, tissue development stages, and durations of Zn stress treatment used). To address the issue of data heterogeneity, we adjusted for the untargeted variations among different studies as suggested by WGCNA developers (https://horvath.genetics.ucla.edu/html/ Co-expressionNetwork/Rpackages/WGCNA/faq.html) by applying the ‘remove batch effect’ function of limma R package (Ritchie et al, 2015) on a normalized FPKM [log2(FPKM + 1)] table of all the 17 samples. The success of this procedure was demonstrated with PCA and box plots of the normalized FPKM before and after correcting for the unwanted variations (Luo et al, 2010; Zhou et al, 2019). The generated normalized and batch-effect corrected FPKM table (Table S1) was then used as input for WGCNA.
Construction of modules of co-expressed genes
WGCNA (version_1.70-3) R package (Langfelder and Horvath, 2008) was used to assemble modules of co-expressed genes. A co-expression network was conducted for all the 17 Zn deficiency-treated samples and 19 316 transcripts. A scale-free topology was applied to select the soft-power threshold (β) for the computation of adjacency matrix asa= |s|β; wheresis the correlation between geneand gene(Zhang and Horvath, 2005). Soft thresholding refers to the continuous reduction of low correlation by powering the correlation between genes to β thresholding parameter. The β parameter was determined using the ‘pick soft threshold’ function. The soft power threshold of 20 (Fig. S5-A) was selected as the first power that surpasses the scale-free topology fit index of 0.8 (Ramírez-González et al, 2018). Next, a topological overlap matrix (TOM) was constructed from adjacency matrices using β value of 20 (Fig. S5-B). TOM is used to determine the network connectivity of a gene as defined by all its adjacencies with the rest of the genes. Lastly, a ‘step by step’ procedure in WGCNA was used to construct modules of co-expressed genes (Langfelder and Horvath, 2008). For reference, the obtained modules were labeled with alphabetic letters in a hierarchical order of their sizes.
Collection of DEGs from previous studies and identification of conserved modular DEGs
To identify the conserved modular DEGs, all the DEGs reported in previous gene expression studies on Zn deficiency in rice (Nanda et al, 2017; Zeng et al, 2019b; Lu et al, 2021) were first collected. Next, a common statistical threshold (|fold-change| ≥ 2 or ≤ -2, and FDR ≤ 0.05) was applied to the collected DEGs to generate a final list of DEGs. Conserved DEGs in root tissue samples across previous studies were obtained by intersecting DEGs from Zeng et al (2019b) and Lu et al (2021). Similarly, DEGs conserved in crown and leaf tissues were obtained by intersecting DEGs from Nanda et al (2017) and our study, respectively. Lastly, to find the conserved modular DEGs, the identified conserved DEGs in root, crown and leaf tissue samples were obtained and separately intersected with genes co-expressing in each of the identified modules (Fig. S2).
Functional annotation enrichment analysis
GO terms and KEGG pathways affected by the conserved modular DEGs were identified using agriGO web program (http://systemsbiology.cau.edu.cn/agriGOv2/) (Du et al, 2010) and clusterProfiler R package (Yu et al, 2012), respectively. A statistical threshold (FDR ≤ 0.05) was applied to identify functional annotations significantly enriched by the queried genes.
Identification of TF, TR, PK genes, miRNAs and network visualization
Plant TF, TR and PK genes were identified using a web program for plant regulatory genes (http://itak.feilab.net/cgi- bin/itak/online_itak.cgi) (Zheng et al, 2016). miRNAs potentially targeting the identified conserved modular DEGs were predicted using a miRNA search database (http:// structuralbiology.cau.edu.cn/PlantGSEA/) (Yi et al, 2013). Gene-gene network structures for the conserved modular DEGs were plotted using Cytoscape v3.8 (Cline et al, 2007).
Validation of RNA-Seq based FPKM expression with qRT-PCR analysis
qRT-PCR was used to confirm the FPKM expression levels of the conserved modular DEGs derived from RNA-Seq analysis of root and crown tissues. For root tissue samples, treatment conditions reported in Zeng et al (2019b) were followed. Similarly, treatment conditions as implemented in Nanda et al (2017) for crown tissue samples were used. For Zn supply treatment, 1.5 μmol/L ZnSO4was added to the growing medium (Wang et al, 2008).
For confirming the RNA-Seq expression levels of the conserved modular DEGs with qRT-PCR, the first strand of cDNA obtained from 1μg of RNA extracted from the prepared samples was used as a template for qRT-PCR analysis with HiScriptTMIII RT SuperMix Kit (Vazyme, Nanjing, China) and ChamQTMUniversal SYBR®qPCR Master Mix (Vazyme, Nanjing, China). Primer sequences for the selected conserved modular DEGs and the reference gene were designed with NCBI Primer-BLAST (http://www.ncbi.nlm.nih.gov/tools/primer- blast/) (Table S10). The total reaction volume was 25 μL, and all the qRT-PCR were run on BIO-RAD CFX384 quantitative PCR (Biorad, California, USA). The applied reaction conditions were: incubation at 95ºCfor 3 min, 40 cycles of denaturation at 95ºCfor 10 s, annealing at 55 ºCfor 30 s, extension at 72ºCfor 45 s, and the dissociation step for melt curve analysis (60 ºCto 94 ºC). Three technical replicates were considered for each of the three biological samples.was used as a reference gene to calculate the relative expression level of each conserved modular DEGs. The Pearson correlation was used to indicate a significant correlation between fold changes obtained based on RNA-Seq expression and those from qRT-PCR with the 2-ΔΔCTmethod (Schmittgen and Livak, 2008).
ACKNOWLEDGEMENTS
This study was financially supported by the Chinese Academy of Agricultural Sciences-Agricultural Science and Technology Innovation Program, and the Shenzhen Science and Technology Program (Grant No. JCYJ20200109150650397). The authors thank Ms. Chen Dandan for being helpful during sample preparation and qRT-PCR analysis and Dr. Liu Jindong for constructive discussion.
SUPPLEMENTAL DATA
The following materials are available in the online version of this article at http://www.sciencedirect.com/journal/rice-science; http://www.ricescience.org.
Fig. S1. Hierarchical dendrogram of co-expressed genes.
Fig. S2. A comprehensive pipeline followed in this study.
Fig. S3. Gene-gene interaction networks of identified conserved modular differentially expressed genes.
Fig. S4. A bar plot illustrating relative proportions of generated sequencing reads.
Fig. S5. Weighted gene co-expression network analysis of transcriptomic data of Zn deficiency-treated rice samples.
Table S1. Batch-corrected normalized fragments per kilobase of transcript per million mapped fragments for Zn deficiency- treated samples used for weighted gene co-expression network analysis.
Table S2. List of experimentally validated Zn deficiency responsive genes.
Table S3. Gene Ontology terms and Kyoto Encyclopedia of Genes and Genomes annotations for identified modules.
Table S4. Conserved modular differentially expressed genes in root tissues across Lu et al (2020) and Zeng et al (2019).
Table S5. Conserved differentially expressed genes in crown and leaf tissues across Nanda et al (2017) and our study, respectively.
Table S6.Gene Ontology terms and Kyoto Encyclopedia of Genes and Genomes annotations enriched by conserved modular differentially expressed genes upregulated in crown (Nanda et al, 2017) and leaf tissues (our study), respectively.
Table S7. Fragments per kilobase of transcript per million mapped fragments for samples from our study.
Table S8. Filtering statistics for Zn deficiency-treated samples used in this study.
Table S9. Fragments per kilobase of fragments per kilobase of transcript per million mapped fragments for the public samples used.
Table S10. Primers used for qRT-PCR validation.
Ahmadi N, Cao T V, Frouin J, Norton G J, Price A H. 2021. Genomic prediction of arsenic tolerance and grain yield in rice: Contribution of trait-specific markers and multi-environment models., 28(3): 268–278.
Akhtar S, Das J K, Ismail T, Wahid M, Saeed W, Bhutta Z A. 2021. Nutritional perspectives for the prevention and mitigation of COVID-19., 79(3): 289–300.
Ariel F D, Manavella P A, Dezar C A, Chan R L. 2007. The true story of the HD-Zip family., 12(9): 419–426.
Azodi C B, Pardo J, VanBuren R, de Los Campos G, Shiu S H. 2020. Transcriptome-based prediction of complex traits in maize., 32(1): 139–151.
Balyan S, Kumar M, Mutum R D, Raghuvanshi U, Agarwal P, Mathur S, Raghuvanshi S. 2017. Identification of miRNA- mediated drought responsive multi-tiered regulatory network in drought tolerant rice, Nagina 22., 7(1): 15446.
Banakar R, Alvarez Fernandez A, Díaz-Benito P, Abadia J, Capell T, Christou P. 2017. Phytosiderophores determine thresholds for iron and zinc accumulation in biofortified rice endosperm while inhibiting the accumulation of cadmium., 68(17): 4983–4995.
Bandyopadhyay T, Mehra P, Hairat S, Giri J. 2017. Morpho- physiological and transcriptome profiling reveal novel zinc deficiency-responsive genes in rice., 17(5): 565–581.
Black M M. 1998. Zinc deficiency and child development., 68: 464S–469S.
Bolger A M, Lohse M, Usadel B. 2014. Trimmomatic: A flexible trimmer for Illumina sequence data., 30(15): 2114–2120.
Chen X Y, Mei Q, Liang W F, Sun J, Wang X M, Zhou J, Wang J M, Zhou Y H, Zheng B S, Yang Y, Chen J P. 2020. Gene mapping, genome-wide transcriptome analysis, and WGCNA reveals the molecular mechanism for triggering programmed cell death in rice mutant., 9(11): 1607.
Cheng S F, Zhou D X, Zhao Y. 2016.-related homeobox geneincreases rice drought resistance by controlling root hair formation and root system development., 11(2): e1130198.
Childs K L, Davidson R M, Buell C R. 2011. Gene coexpression network analysis as a source of functional annotation for rice genes., 6(7): e22196.
Cline M S, Smoot M, Cerami E, Kuchinsky A, Landys N, Workman C, Christmas R, Avila-Campilo I, Creech M, Gross B, Hanspers K, Isserlin R, Kelley R, Killcoyne S, Lotia S, Maere S, Morris J, Ono K, Pavlovic V, Pico A R, Vailaya A, Wang P L, Adler A, Conklin B R, Hood L, Kuiper M, Sander C, Schmulevich I, Schwikowski B, Warner G J, Idker T, Bader G D. 2007. Integration of biological networks and gene expression data using Cytoscape., 2: 2366–2382.
Dardenne M. 2002. Zinc and immune function., 56: S20–S23.
de Los Reyes B G, Mohanty B, Yun S J, Park M R, Lee D Y. 2015. Upstream regulatory architecture of rice genes: Summarizing the baseline towards genus-wide comparative analysis of regulatory networks and allele mining., 8: 14.
Du Z, Zhou X, Ling Y, Zhang Z H, Su Z. 2010. agriGO: A GO analysis toolkit for the agricultural community., 38: W64–W70.
Gratz R, Manishankar P, Ivanov R, Köster P, Mohr I, Trofimov K, Steinhorst L, Meiser J, Mai H J, Drerup M, Arendt S, Holtkamp M, Karst U, Kudla J, Bauer P, Brumbarova T. 2019. CIPK11- dependent phosphorylation modulates FIT activity to promote Arabidopsis iron acquisition in response to calcium signaling., 48(5): 726–740.
Guo R, Dhliwayo T, Mageto E K, Palacios-Rojas N, Lee M, Yu D S, Ruan Y Y, Zhang A, San Vicente F, Olsen M, Crossa J, Prasanna B M, Zhang L J, Zhang X C. 2020. Genomic prediction of kernel zinc concentration in multiple maize populations using genotyping-by-sequencing and repeat amplification sequencing markers., 11: 534.
Hajiboland R. 2012. Effect of micronutrient deficiencies on plants stress responses.: Ahmad P, Prasad M. Abiotic Stress Responses in Plants. New York, USA: Springer: 283–329.
Huang S, Sasaki A, Yamaji N, Okada H, Mitani-Ueno N, Ma J F. 2020. The ZIP transporter family member OsZIP9 contributes to root zinc uptake in rice under zinc-limited conditions., 183(3): 1224–1234.
Huizar M I, Arena R, Laddu D R. 2021. The global food syndemic: The impact of food insecurity, malnutrition and obesity on the healthspan amid the COVID-19 pandemic., 64: 105–107.
Impa S M, Morete M J, Ismail A M, Schulin R, Johnson-Beebout S E. 2013. Zn uptake, translocation and grain Zn loading in rice (L.) genotypes selected for Zn deficiency tolerance and high grain Zn., 64(10): 2739–2751.
Ishimaru Y, Bashir K, Nishizawa N K. 2011. Zn uptake and translocation in rice plants., 4(1): 21–27.
Ishimaru Y, Suzuki M, Kobayashi T, Takahashi M, Nakanishi H, Mori S, Nishizawa N K. 2005. OsZIP4, a novel zinc-regulated zinc transporter in rice., 56: 3207–3214.
Kitomi Y, Kitano H, Inukai Y. 2011. Molecular mechanism of crown root initiation and the different mechanisms between crown root and radicle in rice., 6(9): 1270–1278.
Kumar Sarmah C, Samarasinghe S. 2010. Microarray data integration: Frameworks and a list of underlying issues., 5(4): 280–289.
Langfelder P, Horvath S. 2008. WGCNA: An R package for weighted correlation network analysis., 9: 559.
Lee S, Chiecko J C, Kim S A, Walker E L, Lee Y, Guerinot M L, An G. 2009. Disruption ofleads to iron inefficiency in rice plants., 150(2): 786–800.
Lee S, Kim S A, Lee J, Guerinot M L, An G. 2010. Zinc deficiency- inducibleencodes a plasma membrane-localized zinc transporter in rice., 29(6): 551–558.
Li H, Handsaker B, Wysoker A, Fennell T, Ruan J, Homer N, Marth G, Abecasis G, Durbin R, 1000 Genome Project Data Processing Subgroup. 2009. The sequence alignment/map format and SAMtools., 25(16): 2078–2079.
Liao Y, Smyth G K, Shi W. 2014. featureCounts: An efficient general purpose program for assigning sequence reads to genomic features., 30(7): 923–930.
Lu X, Liu S, Zhi S, Chen J, Ye G. 2021. Comparative transcriptome profile analysis of rice varieties with different tolerance to zinc deficiency., 23(2): 375–390.
Luo J, Schumacher M, Scherer A, Sanoudou D, Megherbi D, Davison T, Shi T, Tong W, Shi L, Hong H, Zhao C, Elloumi F, Shi W, Thomas R, Lin S, Tillinghast G, Liu G, Zhou Y, Herman D, Li Y, Deng Y, Fang H, Bushel P, Woods M, Zhang J. 2010. A comparison of batch effect removal methods for enhancement of prediction performance using MAQC-II microarray gene expression data., 10(4): 278–291.
Lv Y M, Xu L, Dossa K, Zhou K, Zhu M D, Xie H J, Tang S J, Yu Y Y, Guo X Y, Zhou B. 2019. Identification of putative drought- responsive genes in rice using gene co-expression analysis., 15(7): 480–489.
Maurya S, Vishwakarma A K, Dubey M, Shrivastava P, Shrivastava R, Chandel G. 2018. Developing gene-tagged molecular marker for functional analysis ofmetal transporter gene in rice., 78(2): 180.
Meuwissen T H, Hayes B J, Goddard M E. 2001. Prediction of total genetic value using genome-wide dense marker maps., 157(4): 1819–1829.
Nanda A K, Wissuwa M. 2016. Rapid crown root development confers tolerance to zinc deficiency in rice., 7: 428.
Nanda A K, Pujol V, Wissuwa M. 2017. Patterns of stress response and tolerance based on transcriptome profiling of rice crown tissue under zinc deficiency., 68(7): 1715–1729.
Nozoye T, Nagasaka S, Kobayashi T, Takahashi M, Sato Y, Sato Y, Uozumi N, Nakanishi H, Nishizawa N K. 2011. Phytosiderophore efflux transporters are crucial for iron acquisition in graminaceous plants., 286(7): 5446–5454.
Ogo Y, Itai R N, Nakanishi H, Inoue H, Kobayashi T, Suzuki M, Takahashi M, Mori S, Nishizawa N K. 2006. Isolation and characterization of IRO2, a novel iron-regulated bHLH transcription factor in graminaceous plants., 57(11): 2867–2878.
Olsen L I, Palmgren M G. 2014. Many rivers to cross: The journey of zinc from soil to seed., 5: 30.
Pertea M, Kim D, Pertea G M, Leek J T, Salzberg S L. 2016. Transcript-level expression analysis of RNA-seq experiments with HISAT, StringTie and Ballgown., 11(9): 1650–1667.
Ptashnyk M, Roose T, Jones D L, Kirk G J D. 2011. Enhanced zinc uptake by rice through phytosiderophore secretion: A modelling study., 34(12): 2038–2046.
Qi Y H, Wang S K, Shen C J, Zhang S N, Chen Y, Xu Y X, Liu Y, Wu Y R, Jiang D A. 2012., a transcription activator on auxin response gene, regulates root elongation and affects iron accumulation in rice ()., 193(1): 109–120.
Ramírez-González R H, Borrill P, Lang D, Harrington S A, Brinton J, Venturini L, Davey M, Jacobs J, van Ex F, Pasha A, Khedikar Y, Robinson S J, Cory A T, Florio T, Concia L, Juery C, Schoonbeek H, Steuernagel B, Xiang D, Ridout C J, Chalhoub B, Mayer K F X, Benhamed M, Latrasse D, Bendahmane A, Consortium I W G S, Wulff B B H, Appels R, Tiwari V, Datla R, Choulet F, Pozniak C J, Provart N J, Sharpe A G, Paux E, Spannagl M, Bräutigam A, Uauy C. 2018. The transcriptional landscape of polyploid wheat., 361: eaar6089.
Rani Debi B, Taketa S, Ichii M. 2005. Cytokinin inhibits lateral root initiation but stimulates lateral root elongation in rice ()., 162(5): 507–515.
Ritchie M E, Phipson B, Wu D, Hu Y F, Law C W, Shi W, Smyth G K. 2015. Limma powers differential expression analyses for RNA-sequencing and microarray studies., 43(7): e47.
Schmittgen T D, Livak K J. 2008. Analyzing real-time PCR data by the comparative C(T) method., 3(6): 1101–1108.
Sinclair S A, Krämer U. 2012. The zinc homeostasis network of land plants., 1823(9): 1553–1567.
Singh S P, Gruissem W, Bhullar N K. 2017. Single genetic locus improvement of iron, zinc and β-carotene content in rice grains., 7(1): 6883.
Spindel J E, Begum H, Akdemir D, Collard B, Redoña E, Jannink J L, McCouch S. 2016. Genome-wide prediction models that incorporateGWAS are a powerful new tool for tropical rice improvement., 116(4): 395–408.
Suzuki M, Tsukamoto T, Inoue H, Watanabe S, Matsuhashi S, Takahashi M, Nakanishi H, Mori S, Nishizawa N K. 2008. Deoxymugineic acid increases Zn translocation in Zn-deficient rice plants., 66(6): 609–617.
Swamy B P M, Rahman M A, Inabangan-Asilo M A, Amparado A, Manito C, Chadha-Mohanty P, Reinke R, Slamet-Loedin I H. 2016. Advances in breeding for high grain zinc in rice., 9(1): 49.
Tan M P, Cheng D, Yang Y N, Zhang G Q, Qin M J, Chen J, Chen Y H, Jiang M Y. 2017. Co-expression network analysis of the transcriptomes of rice roots exposed to various cadmium stresses reveals universal cadmium-responsive genes., 17(1): 194.
Tian D G, Chen Z J, Lin Y, Chen Z Q, Bui K T, Wang Z H, Wang F. 2020. Weighted gene co-expression network coupled with a critical-time-point analysis during pathogenesis for predicting the molecular mechanism underlying blast resistance in rice., 13(1): 81.
van der Straeten D, Bhullar N K, de Steur H, Gruissem W, MacKenzie D, Pfeiffer W, Qaim M, Slamet-Loedin I, Strobbe S, Tohme J, Trijatmiko K R, Vanderschuren H, van Montagu M, Zhang C Y, Bouis H. 2020. Multiplying the efficiency and impact of biofortification through metabolic engineering., 11(1): 5203.
Wang A J, Shu X Y, Niu X Y, Zhao W J, Ai P, Li P, Zheng A P. 2018. Comparison of gene co-networks analysis provide a systems view of rice (L.) response toinfection., 13(10): e0202309.
Wang Y, Frei M, Wissuwa M. 2008. An agar nutrient solution technique as a screening tool for tolerance to zinc deficiency and iron toxicity in rice., 54(5): 744–750.
White P J, Broadley M R. 2009. Biofortification of crops with seven mineral elements often lacking in human diets: Iron, zinc, copper, calcium, magnesium, selenium and iodine., 182(1): 49–84.
Wissuwa M, Ismail A M, Graham R D. 2008. Rice grain zinc concentrations as affected by genotype, native soil-zinc availability, and zinc fertilization., 306: 37–48.
Xu Y, Ma K X, Zhao Y, Wang X, Zhou K, Yu G N, Li C, Li P C, Yang Z F, Xu C W, Xu S Z. 2021. Genomic selection: A breakthrough technology in rice breeding., 9(3): 669–677.
Yang M, Li Y T, Liu Z H, Tian J J, Liang L M, Qiu Y, Wang G Y, Du Q Q, Cheng D, Cai H M, Shi L, Xu F S, Lian X M. 2020. A high activity zinc transporter OsZIP9 mediates zinc uptake in rice., 103(5): 1695–1709.
Yang Z, Wu Y R, Li Y, Ling H Q, Chu C C. 2009. OsMT1a, a type 1 metallothionein, plays the pivotal role in zinc homeostasis and drought tolerance in rice., 70: 219–229.
Yao W, Li G W, Yu Y M, Ouyang Y D. 2018. funRiceGenes dataset for comprehensive understanding and application of rice functional genes., 7(1): 1–9.
Yi X, Du Z, Su Z. 2013. PlantGSEA: A gene set enrichment analysis toolkit for plant community., 41: W98–W103.
Yu G C, Wang L G, Han Y Y, He Q Y. 2012. clusterProfiler: An R package for comparing biological themes among gene clusters., 16(5): 284–287.
Zeng H Q, Wang G P, Hu X Y, Wang H Z, Du L Q, Zhu Y Y. 2014. Role of microRNAs in plant responses to nutrient stress., 374: 1005–1021.
Zeng H Q, Zhang X, Ding M, Zhang X J, Zhu Y Y. 2019a. Transcriptome profiles of soybean leaves and roots in response to zinc deficiency., 167(3): 330–351.
Zeng H Q, Zhang X, Ding M, Zhu Y Y. 2019b. Integrated analyses of miRNAome and transcriptome reveal zinc deficiency responses in rice seedlings., 19(1): 585.
Zhang B, Horvath S. 2005. A general framework for weighted gene co-expression network analysis., 4: Article17.
Zhang Y Q, Parmigiani G, Johnson W E. 2020. ComBat-seq: Batch effect adjustment for RNA-seq count data., 2(3): lqaa078.
Zheng Y, Jiao C, Sun H H, Rosli H G, Pombo M A, Zhang P F, Banf M, Dai X B, Martin G B, Giovannoni J J, Zhao P X, Rhee S Y, Fei Z J. 2016. iTAK: A program for genome-wide prediction and classification of plant transcription factors, transcriptional regulators, and protein kinases., 9(12): 1667–1670.
Zhou W, Koudijs K K M, Böhringer S. 2019. Influence of batch effect correction methods on drug induced differential gene expression profiles., 20(1): 437.
Zhu M D, Xie H J, Wei X J, Dossa K, Yu Y Y, Hui S Z, Tang G H, Zeng X S, Yu Y H, Hu P S, Wang J L. 2019. WGCNA analysis of salt-responsive core transcriptome identifies novel hub genes in rice., 10(9): 719.
9 December 2021;
24 April 2022
Copyright © 2022, China National Rice Research Institute. Hosting by Elsevier B V
This is an open access article under the CC BY-NC-ND license (http://creativecommons.org/licenses/by-nc-nd/4.0/)
Peer review under responsibility of China National Rice Research Institute
http://dx.doi.org/10.1016/j.rsci.2022.04.002
Ye Guoyou (g.ye@irri.org); He Sang (hesang@caas.cn)
(Managing Editor: Wang Caihong)
杂志排行
Rice Science的其它文章
- Transcriptome Analysis Provides Novel Insights into Salt Stress Response in Two Egyptian Rice Varieties with Different Tolerance Levels
- QTL Mapping for Plant Height Using Introgression Lines Derived from Zhonghui 8015 and Wild Rice (Oryza rufipogon)
- Genetic Dissection of Quantitative Trait Loci for Panicle Traits and Heat Tolerance by High-Density Bin Map in Rice
- Improvement of Rice Production under Drought Conditions in West Africa:Application of QTLs in Breeding for Drought Resistance
- Characterization of a Novel Weak Allele of RGA1/D1 and Its Potential Application in Rice Breeding
- CRISPR/Cas9-Targeted Knockout of Rice Susceptibility Genes OsDjA2 and OsERF104 Reveals Alternative Sources of Resistance to Pyricularia oryzae
